. 2025 Jul 25;11(30):eadw4974.
doi: 10.1126/sciadv.adw4974. Epub 2025 Jul 25.

Hippo signaling regulates the nuclear behavior and DNA binding times of YAP and TEAD to control transcription

Affiliations

Hippo signaling regulates the nuclear behavior and DNA binding times of YAP and TEAD to control transcription

Benjamin Kroeger et al. Sci Adv. .

Abstract

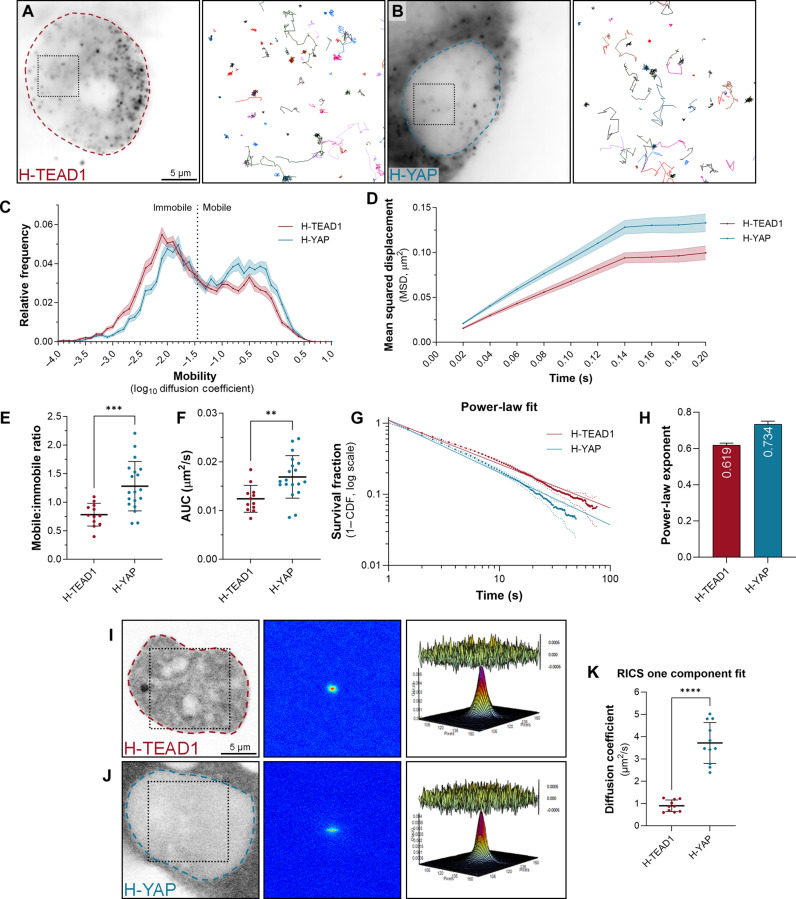
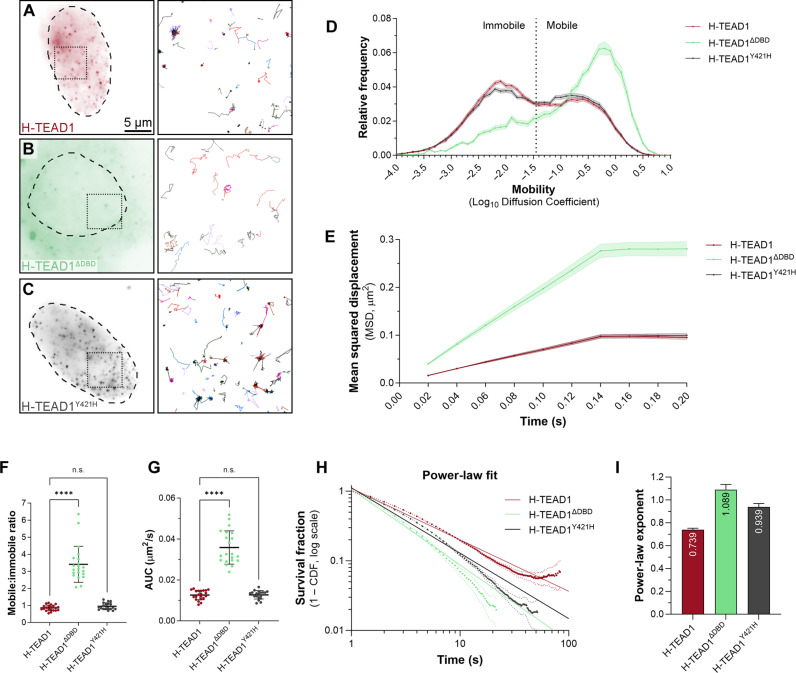
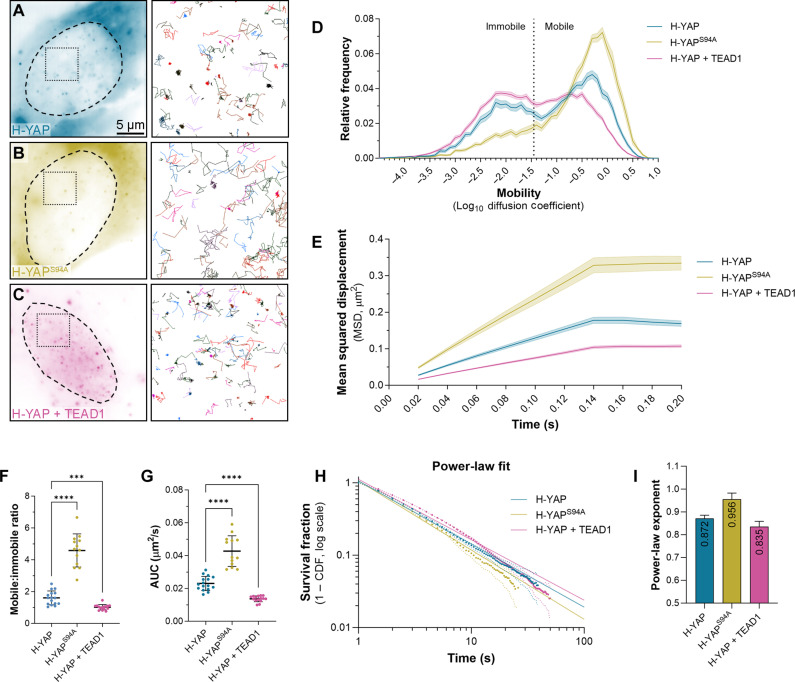
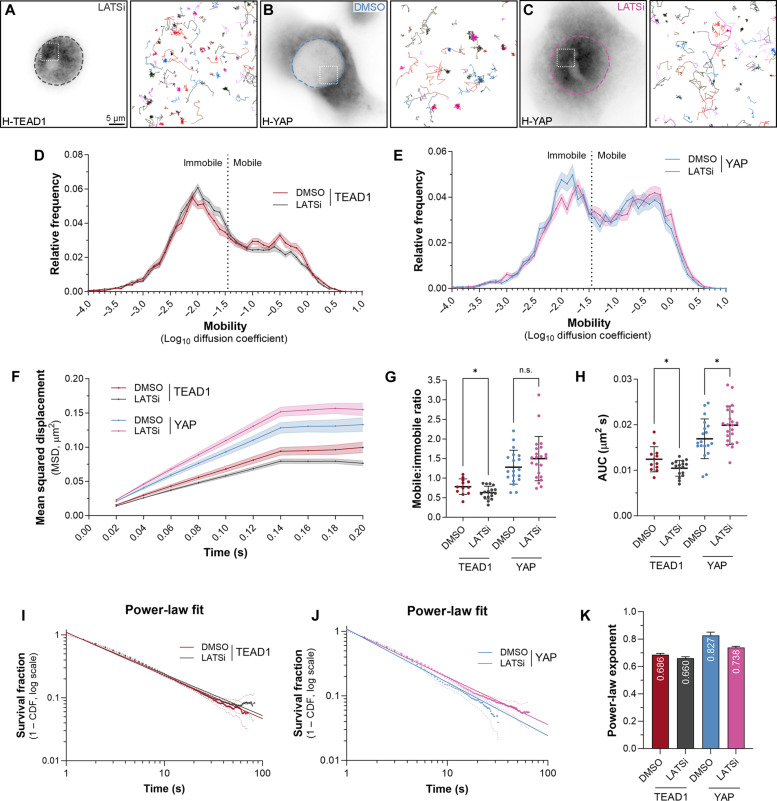
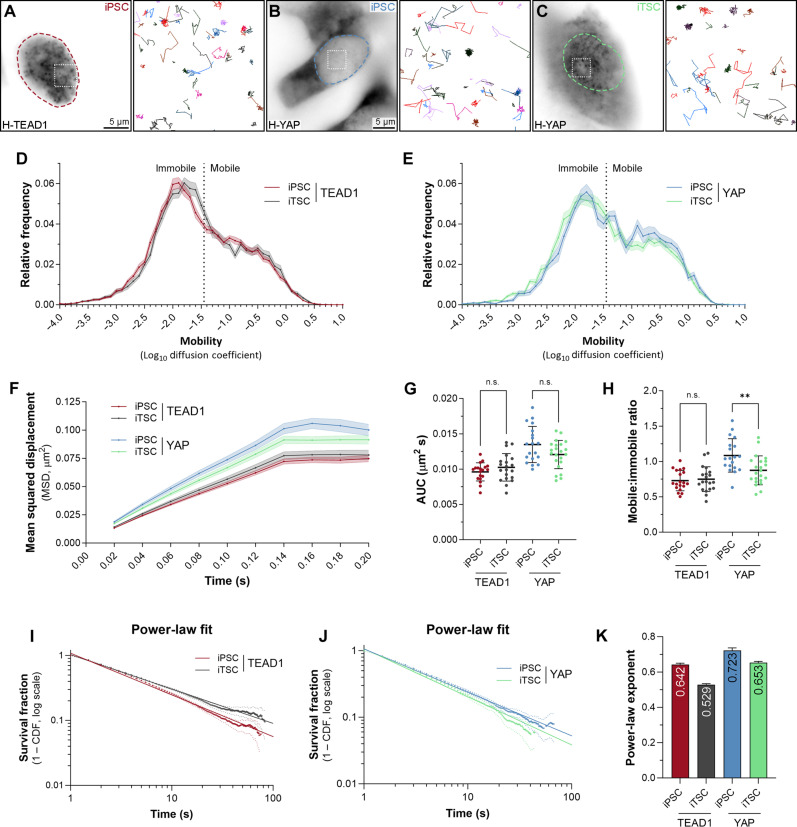
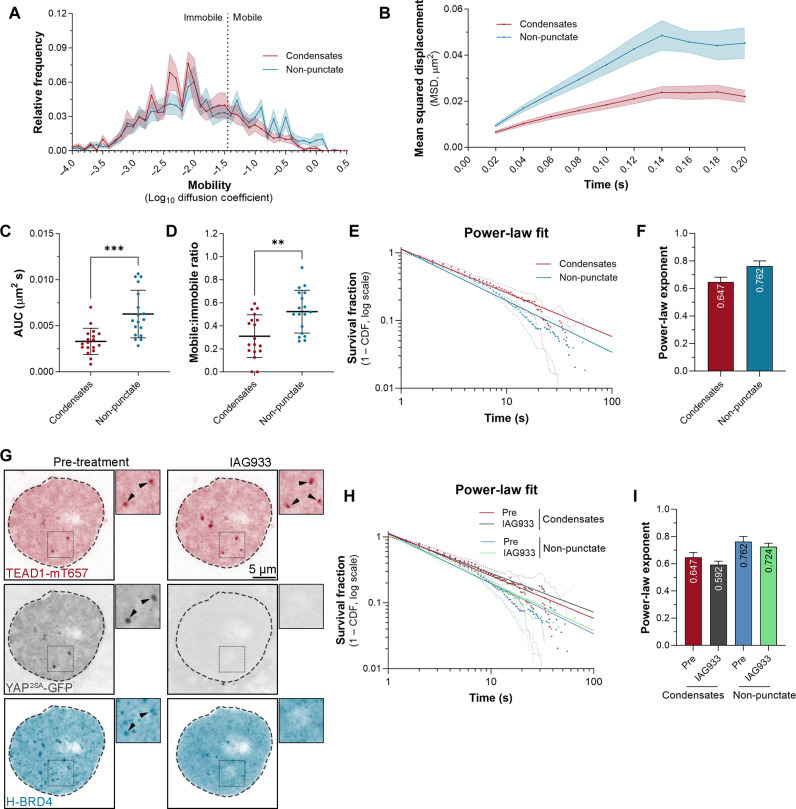
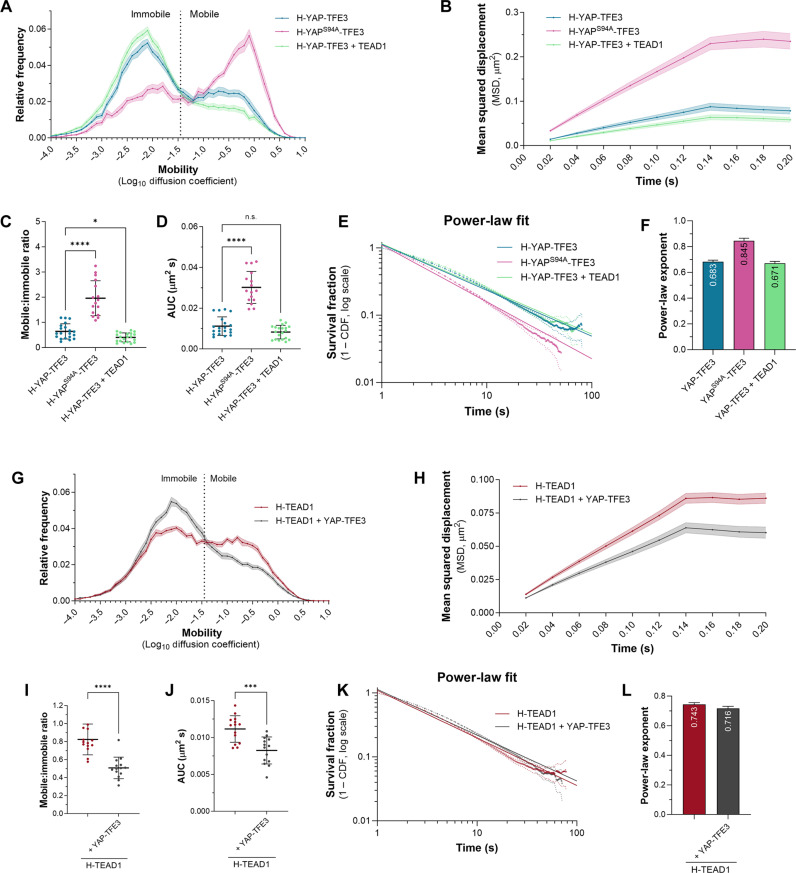
Over the past two decades, genetic and proteomic screens have identified the Hippo pathway as a complex signaling network that controls tissue growth and human cancer. Despite these advances, our understanding of how Hippo signaling regulates transcription is less clear. To address this, we used live microscopy to study the nuclear behavior of the major Hippo pathway transcription effectors, YAP and TEADs. We reveal that TEADs are a major determinant of YAP DNA binding and nuclear mobility, while YAP minorly influences TEADs. YAP and TEAD1 associate with DNA for longer periods in cells with intrinsically low Hippo pathway activity and upon acute Hippo pathway perturbation. TEAD1 binds the genome on a broad range of timescales, and this is extended substantially in nuclear condensates. Last, a cancer-associated YAP fusion protein exhibits substantially different biophysical behavior than either YAP or TEAD1. Thus, we reveal that Hippo signaling regulates transcription, in part, by influencing the DNA binding times of YAP and TEADs.


Figures

Fig. 1.
Fig. 1.. YAP and TEAD1 exhibit different nuclear biophysical properties.
(A and B) Left panels display single MCF10A cells expressing HaloTagged TEAD1 (A) or YAP (B), imaged at single-molecule resolution. Dashed outlines indicate nuclei. Right panels (boxed regions in left panels) show trajectories of TEAD1 or YAP molecules tracked over time. Scale bar indicated. (C) Chart of relative frequency of molecule mobilities (log10 diffusion coefficient) for TEAD1 (red) and YAP (blue) in MCF10A cell nuclei over time. Data are means ± SEM from 14,053 trajectories from 12 cells (TEAD1) and 6386 trajectories from 19 cells (YAP). (D) Chart of mean squared displacement (MSD; square micrometers) of TEAD1 (red) and YAP (blue) molecules in MCF10A cell nuclei over time. Data are means ± SEM. (E and F) Charts of mobile-to-immobile ratio (E) or area under the curve (AUC) (F) (square micrometers per second) of TEAD1 and YAP molecules in MCF10A cell nuclei. Data are means ± SD; t test; **P < 0.01; ***P < 0.001; n = 12 (TEAD1) and 19 (YAP). (G) Chart of photobleach-corrected survival distribution of TEAD1 or YAP molecules in MCF10A cell nuclei, with power-law fits (solid lines). Dotted lines are ±99% confidence interval (CI). n = 61,860 trajectories from 31 cells (TEAD1) and 27,748 trajectories from 20 cells (YAP). CDF, cumulative distribution function. (H) Chart of power-law exponents of TEAD1 and YAP in MCF10A cells. Error bars indicate 95% CI. (I and J) Left panels display TEAD1 (I) or YAP (J) in single MCF10A cells. Scale bar indicated. Boxed region shows analyzed nuclear region. Central panels are RICS correlation functions. Right panels show single-component diffusion model fits of RICS functions; residuals between data and fit shown above. (K) Chart of diffusion coefficient (square micrometers per second) of TEAD1 and YAP in MCF10A cell nuclei. Data are means ± SD; t test; ****P < 0.0001; n = 10 and 11.
Fig. 2.
Fig. 2.. TEAD1’s ability to bind DNA, not YAP, is the primary determinant of its nuclear behavior.
(A to C) Left panels are average intensity projection images of single HeLa cells expressing HaloTagged TEAD1 proteins; wild-type (A), TEA DNA binding domain mutant (B), or TEADY421H (C), imaged at single-molecule resolution by HILO. Dashed outlines indicate the nucleus. Right panels show the trajectories of individual TEAD1 molecules tracked over time. Boxed regions in cell images indicate the area corresponding to trajectories. Scale bar is indicated. (D) Chart of relative frequency of molecule mobilities (log10 diffusion coefficient) of TEAD1 (red), TEAD1ΔDBD (green), and TEAD1Y421H (gray) molecules in HeLa cell nuclei over time. Data are presented as the means ± SEM. Mobile and immobile fractions are indicated. Data are from 73,348 trajectories from 21 cells for TEAD1, 17,369 trajectories from 21 cells for TEAD1ΔDBD, and 67,321 trajectories from 19 cells for TEAD1Y421H. (E) Chart of MSD (square micrometers) of TEAD1 (wild-type and mutant) molecules in HeLa cell nuclei over time. Data are presented as means ± SEM. (F and G) Charts of mobile-to-immobile ratio (F) or AUC (G) (square micrometers per second) of TEAD1, TEAD1ΔDBD, or TEAD1Y421H in HeLa cell nuclei. Data are presented as means ± SD; P values were obtained using a Brown-Forsythe and Welch analysis of variance (ANOVA) with Dunnett’s T3 multiple comparisons test; ****P < 0.0001; n.s., not significant; n = 21 cells (TEAD1), 21 cells (TEAD1ΔDBD), and 19 cells (TEAD1Y421H). (H) Chart of photobleach-corrected survival distribution of TEAD1 (wild-type or mutant) molecules in the nucleus of HeLa cells, with power-law fits (solid lines). Dotted lines are 99% CI. n = 202,613 trajectories from 26 cells (TEAD1), 38,766 trajectories from 22 cells (TEAD1ΔDBD), and 83,778 trajectories from 21 cells (TEAD1Y421H). (I) Chart of power-law exponents of TEAD1 proteins. Error bars indicate 95% CI.
Fig. 3.
Fig. 3.. TEADs have a major influence on YAP’s nuclear behavior.
(A to C) Left panels show single HeLa cells expressing HaloTagged YAP proteins; wild-type (A), YAPS94A (B), and YAP with overexpressed TEAD1 (C), imaged at single-molecule resolution. Dashed outlines indicate nuclei. Right panels (boxed regions in left panels) show trajectories of individual molecules tracked over time. Scale bar indicated. (D) Chart of relative frequency of molecule mobilities (log10 diffusion coefficient) of YAP (blue), YAPS94A (olive), and YAP with overexpressed TEAD1 (pink) molecules in HeLa cell nuclei over time. Data are presented as means ± SEM. Data are from 14,648 trajectories from 16 cells (YAP), 13,785 trajectories from 13 cells (YAPS94A), and 52,442 trajectories from 15 cells (YAP with overexpressed TEAD1). (E) Chart showing MSD (square micrometers) of YAP (wild-type and mutant) molecules in HeLa cell nuclei over time. Data are presented as means ± SEM. (F and G) Charts of mobile-to-immobile ratio (F) or AUC (G) (square micrometers per second) of YAP, YAPS94A, or YAP with overexpressed TEAD1 in HeLa cell nuclei. Data are presented as means ± SD; P values were obtained using a Brown-Forsythe and Welch ANOVA with Dunnett’s T3 multiple comparisons test; ***P < 0.001; ****P < 0.0001; n.s., not significant; n = 16 cells (YAP), 13 cells (YAPS94A), and 15 cells (YAP with overexpressed TEAD1). (H) Chart showing photobleach-corrected survival distribution of YAP (wild-type or mutant) molecules in HeLa cell nuclei, with power-law fits (solid lines). Dotted lines are 99% CI. n = 62,126 trajectories from 24 cells (YAP), 33,571 trajectories from 13 cells (YAPS94A), and 126,127 trajectories from 16 cells (YAP with overexpressed TEAD1). (I) Chart showing power-law exponents of TEAD1 proteins. Error bars indicate 95% CI.
Fig. 4.
Fig. 4.. Hippo signaling limits YAP and TEAD1 DNA binding times.
(A to C) Left panels show single MCF10A cells expressing HaloTagged TEAD1 (A) or YAP (B and C), treated with 3 μM LATSi (A and B) or dimethyl sulfoxide (DMSO) (B). Dashed outlines indicate nuclei. Right panels (boxed regions in left panels) show trajectories of individual molecules tracked over time. Scale bar indicated. (D and E) Chart of relative frequency of molecule mobilities (log10 diffusion coefficient) of TEAD1 (D) or YAP (E) in MCF10A cell nuclei over time (treated with DMSO or LATSi). Data are presented as means ± SEM. Data are from 14,053 trajectories from 12 cells (TEAD1, DMSO), 20,093 trajectories from 17 cells (TEAD1, LATSi), 6386 trajectories from 19 cells (YAP, DMSO), and 10,752 trajectories from 22 cells (YAP, LATSi). (F) Chart of MSD (square micrometers) of TEAD1 or YAP molecules in MCF10A cell nuclei over time (treated with DMSO or LATSi). Data are presented as means ± SEM. (G and H) Charts of mobile-to-immobile ratio (G) or AUC (H) (square micrometers per second) of TEAD1 and YAP molecules in MCF10A cell nuclei (treated with DMSO or LATSi). Data are presented as means ± SD; *P < 0.05 (unpaired t test); n.s., not significant; n = 12 and 17 cells (TEAD1) and n = 19 and 22 cells (YAP). (I and J) Chart of photobleach-corrected survival distribution of TEAD1 or YAP molecules in MCF10A cell nuclei, with power-law fits (solid lines, treated with DMSO or LATSi). Dotted lines are 99% CI. n = 54,886 trajectories from 21 cells (TEAD1, DMSO), 68,992 trajectories from 17 cells (TEAD1, LATSi), 14,104 trajectories from 19 cells (YAP, DMSO), and 46,056 trajectories from 22 cells (YAP, LATSi). (K) Chart of power-law exponents of YAP and TEAD1 in MCF10A cells (DMSO or LATSi). Error bars indicate 95% CI.
Fig. 5.
Fig. 5.. YAP and TEAD1 bind DNA longer in cells with intrinsically high YAP/TEAD activity.
(A to C) Left panels are single iPSC or iTSC expressing HaloTagged TEAD1 (A) or YAP (B and C). Dashed outlines indicate nuclei. Right panels (boxed regions in left panels) show trajectories of individual molecules tracked over time. Scale bars indicated. (D and E) Chart of relative frequency of molecule mobilities (log10 diffusion coefficient) of TEAD1 (D) or YAP (E) in iPSC or iTSC nuclei. Data are presented as means ± SEM. Mobile and immobile fractions are indicated. Data are from 17,036 trajectories from 19 cells for TEAD1 (iPSC), 17,257 trajectories from 20 cells for TEAD1 (iTSC), 6874 trajectories from 19 cells for YAP (iPSC), and 23,382 trajectories from 22 cells for YAP (iTSC). (F) Chart of MSD (square micrometers) of TEAD1 or YAP molecules in iPSC or iTSC nuclei over time. Data are presented as the means ± SEM. (G and H) Charts of mobile-to-immobile ratio (G) or AUC (H) (square micrometers per second) of TEAD1 and YAP molecules in iPSC or iTSC nuclei. Data are presented as means ± SD; **P < 0.01 (unpaired t test); n.s., not significant; n = 19 and 20 cells (TEAD1) and n = 19 and 22 cells (YAP) (iPSC and iTSC, respectively). (I and J) Chart of photobleach-corrected survival distribution of TEAD1 or YAP molecules in cocultured iPSC or iTSC nuclei, with power-law fits (solid lines). Dotted lines are 99% CI. n = 47,191 trajectories from 22 cells (TEAD1, iPSC), 42,339 trajectories from 22 cells (TEAD1, iTSC), 13,381 trajectories from 25 cells (YAP, iPSC), and 26,931 trajectories from 23 cells (YAP, iTSC). (K) Chart of power-law exponents of YAP and TEAD1 in cocultured iPSC and iTSC nuclei. Error bars indicate 95% CI.
Fig. 6.
Fig. 6.. TEAD1 exhibits reduced mobility and extended DNA binding behavior in nuclear condensates.
(A) Chart of relative frequency of molecule mobilities (log10 diffusion coefficient) of TEAD1 in MCF10A cell nuclear condensates and non-punctate nuclear regions (n = 1247 and 955 trajectories from 18 cells). Data is means ± SEM. (B) Chart of MSD (square micrometers) of TEAD1 in MCF10A cell nuclear condensates and non-punctate nuclear regions, over time. Data is means ± SEM. (C and D) Charts showing mobile-to-immobile ratio (C) or AUC (D) (square micrometers per second) of TEAD1 in MCF10A cell nuclear condensates and non-punctate nuclear regions. Data is means ± SD; **P < 0.01; ***P < 0.001; unpaired t tests; n = 18 cells. (E) Chart of photobleach-corrected survival distribution of TEAD1 molecules in MCF10A cell nuclear condensates and non-punctate nuclear regions (n = 1080 and 2628 trajectories from 14 cells), with power-law fits (solid lines). Dotted lines are 99% CI. (F) Chart of power-law exponents of TEAD1 in MCF10A cell nuclear condensates and non-punctate nuclear regions. Error bars indicate 95% CI. (G) A HeLa cell expressing TEAD1-mT657 (red), YAP2SA-EGFP (gray), and HaloTagged-BRD4 (turquoise) pre- and posttreatment with 3 μM IAG933 for ~1 min. Dashed outlines indicate the nucleus. Black arrowheads indicate condensates having TEAD1, YAP2SA, and BRD4 pretreatment and TEAD1 post–IAG933 treatment. Zoomed images of boxed regions are shown. Scale bar indicated. (H) Chart showing photobleach-corrected survival distribution TEAD1 in MCF10A cell nuclear condensates and non-punctate nuclear regions, pre- and posttreatment with 3 μM IAG933 for 30 min, with power-law fits (solid lines). Dotted lines are 99% CI. Trajectory numbers were: 1080, 2628, 672, and 1465 from 14 cells. (I) Chart of power-law exponents of TEAD1 in MCF10A cell nuclear condensates and non-punctate nuclear regions, pre- and posttreatment with 3 μM IAG933 for 30 min. Error bars indicate 95% CI.
Fig. 7.
Fig. 7.. The nuclear behavior of YAP-TFE3 differs substantially from YAP.
(A) Chart of relative frequency of molecule mobilities (log10 diffusion coefficient) of YAP-TFE3 (blue), YAPS94A-TFE3 (pink), and YAP-TFE3 with overexpressed TEAD1 (green) in HeLa cell nuclei over time (42,829 trajectories, 20 cells; 34,229 trajectories, 16 cells; and 71,291 trajectories, 20 cells); means ± SEM. (B) Chart showing MSD (square micrometers) of YAP-TFE3, YAPS94A-TFE3, and YAP-TFE3 with overexpressed TEAD1; means ± SEM. (C and D) Charts of mobile-to-immobile ratio (C) or AUC (D) (square micrometers per second) of YAP-TFE3, YAPS94A-TFE3, or YAP-TFE3 with overexpressed TEAD; n = 20,16,20; means ± SD; *P < 0.05; ****P < 0.0001 (Brown-Forsythe and Welch ANOVA with Dunnett’s T3 multiple comparisons test); n.s., not significant. (E) Chart of photobleach-corrected survival distribution of YAP-TFE3, YAPS94A-TFE3, or YAP-TFE3 with overexpressed TEAD1 (n = 167,283 trajectories, 27 cells; 104,009 trajectories, 19 cells; 86,983 trajectories, 20 cells), with power-law fits (solid lines). Dotted lines are 99% CI. (F) Chart of power-law exponents of YAP-TFE3, YAPS94A-TFE3, or YAP-TFE3 with overexpressed TEAD1, with 95% CI. (G) Chart of relative frequency of molecule mobilities (log10 diffusion coefficient) of TEAD1 ± YAP-TFE3-GFP (46,400 or 50,235 trajectories, 14 cells each); means ± SEM. (H) Chart of MSD (square micrometers) of TEAD1 molecules ± YAP-TFE3-GFP; means ± SEM. (I and J) Charts of mobile-to-immobile ratio (I) or AUC (J) (square micrometers per second) of TEAD1 molecules ± YAP-TFE3-GFP; means ± SD; ***P < 0.001; ****P < 0.0001 (Brown-Forsythe and Welch ANOVA with Dunnett’s T3 multiple comparisons test); n = 14 cells each. (K) Chart of photobleach-corrected survival distribution of Halo-TEAD1 molecules ± YAP-TFE3-GFP (121,486 trajectories, 16 cells; and 102,439 trajectories, 15 cells), with power-law fits (solid lines). (L) Chart of power-law exponents of TEAD1 molecules ± YAP-TFE3-GFP, with 95% CI.

Similar articles

References

    1. Zheng Y., Pan D., The Hippo signaling pathway in development and disease. Dev. Cell 50, 264–282 (2019). - PMC - PubMed
    1. Gaspar P., Tapon N., Sensing the local environment: Actin architecture and Hippo signalling. Curr. Opin. Cell Biol. 31, 74–83 (2014). - PubMed
    1. Halder G., Dupont S., Piccolo S., Transduction of mechanical and cytoskeletal cues by YAP and TAZ. Nat. Rev. Mol. Cell Biol. 13, 591–600 (2012). - PubMed
    1. Meng Z., Moroishi T., Guan K.-L., Mechanisms of Hippo pathway regulation. Genes Dev. 30, 1–17 (2016). - PMC - PubMed
    1. Harvey K. F., Zhang X., Thomas D. M., The Hippo pathway and human cancer. Nat. Rev. Cancer 13, 246–257 (2013). - PubMed

MeSH terms

LinkOut - more resources