. 2025 Jul 25;10(109):eads0478.
doi: 10.1126/sciimmunol.ads0478. Epub 2025 Jul 25.

Regulatory T cells in brown adipose tissue safeguard thermogenesis by restraining interferon-γ-producing lymphocytes

Affiliations

Regulatory T cells in brown adipose tissue safeguard thermogenesis by restraining interferon-γ-producing lymphocytes

Nathan W Zammit et al. Sci Immunol. .

Abstract

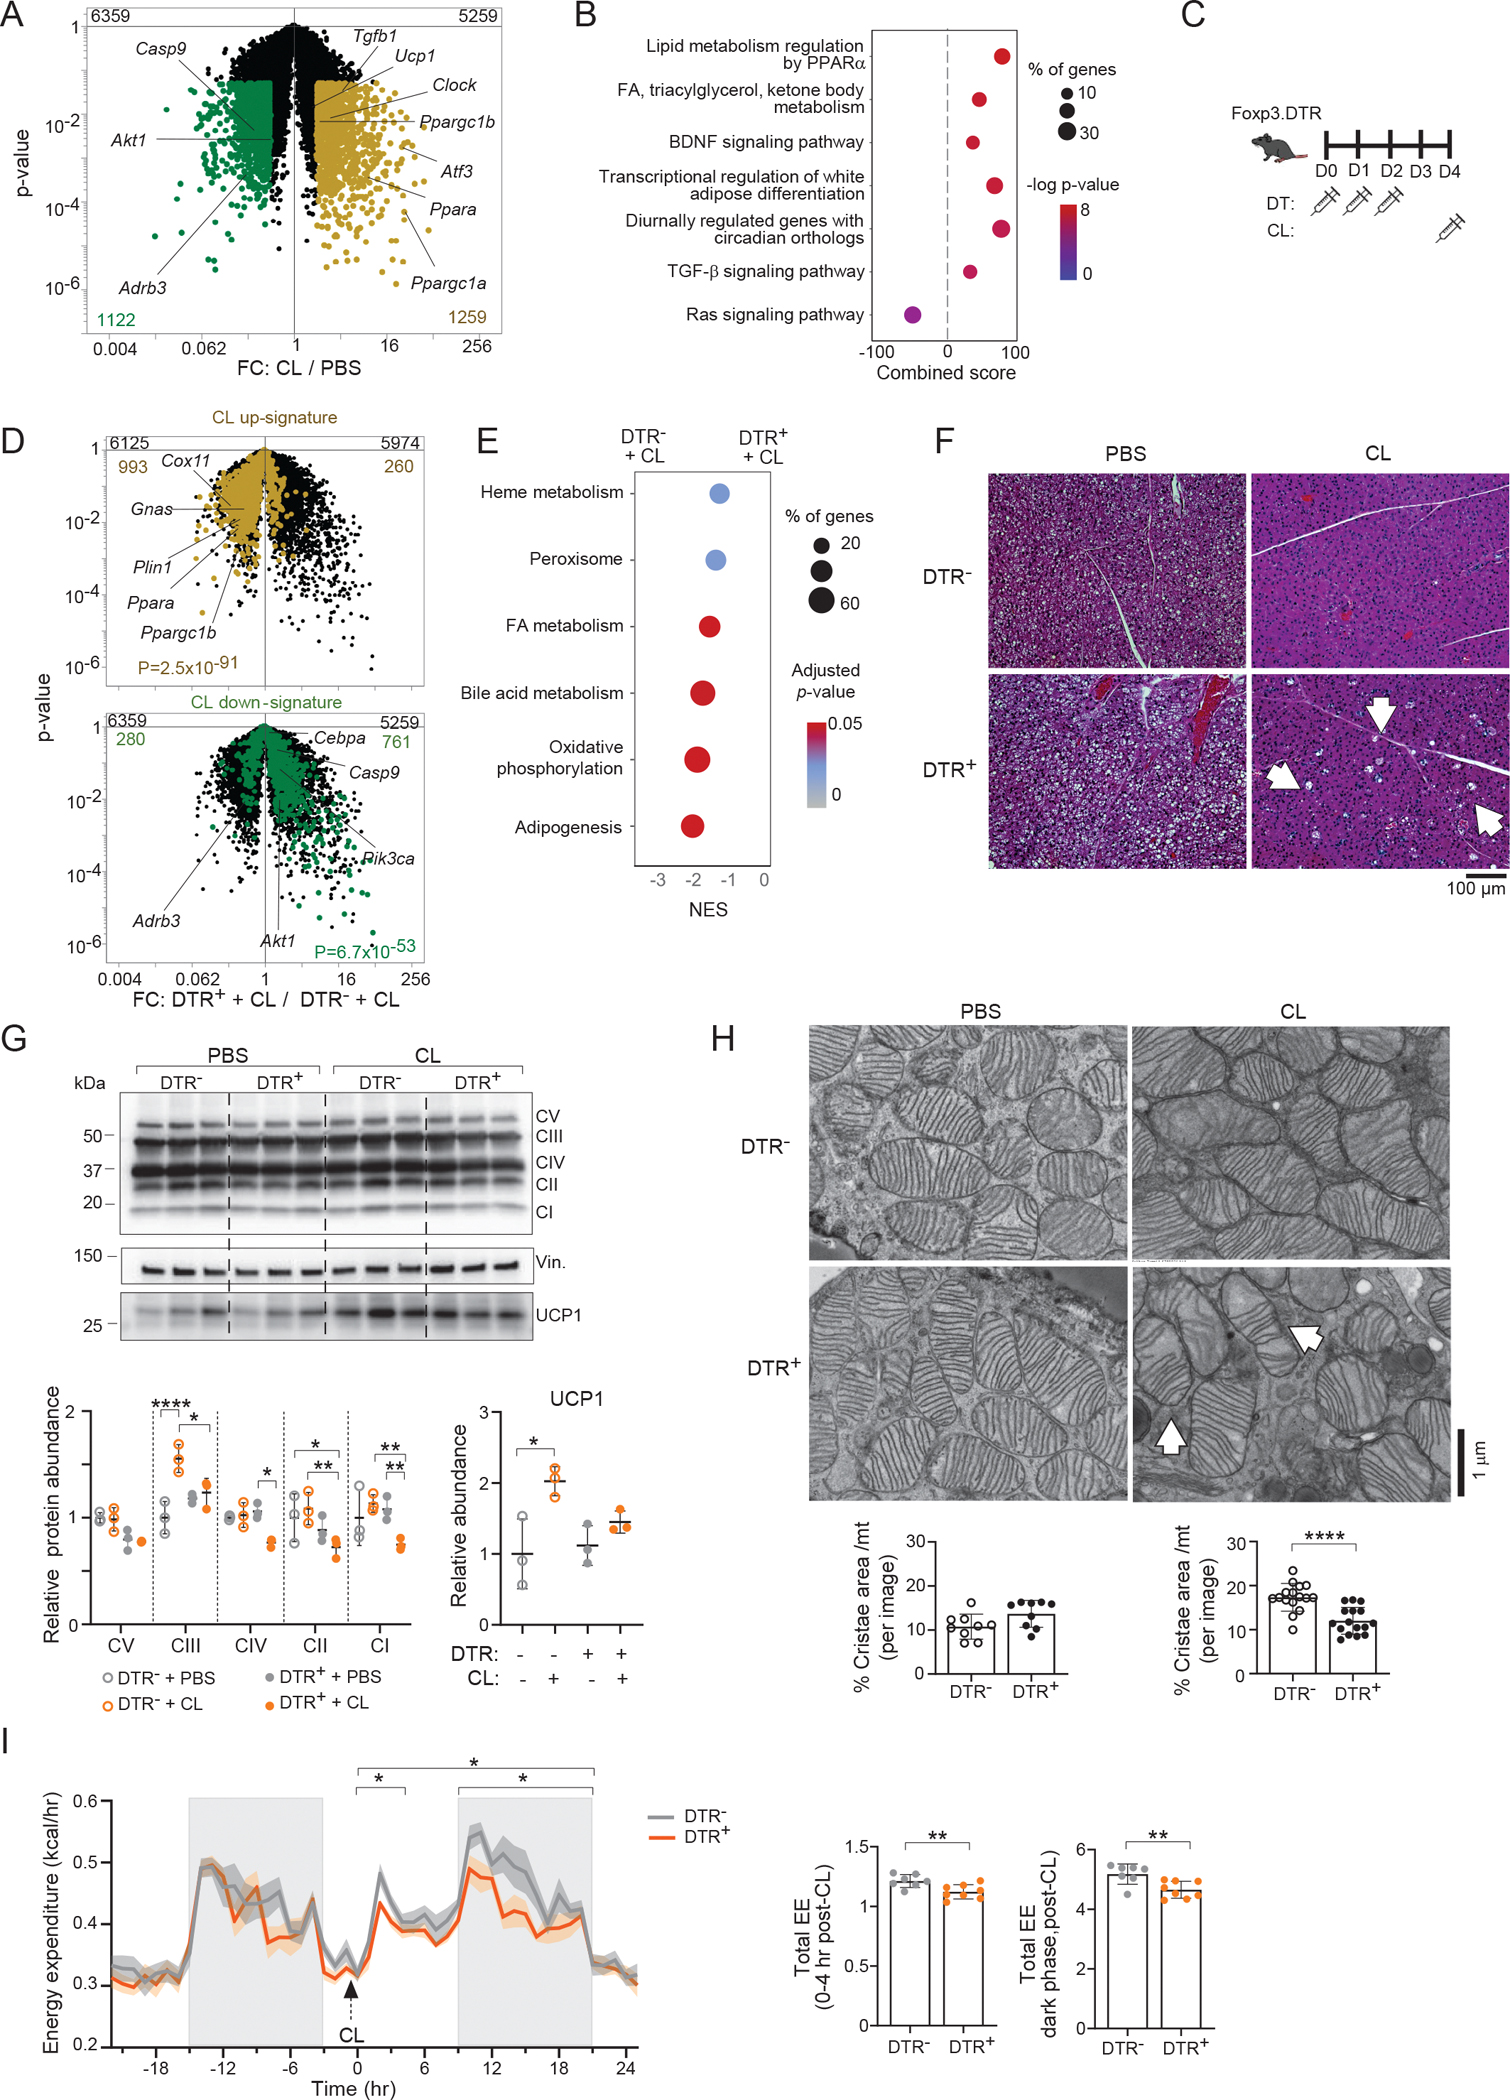
Whereas visceral adipose tissue (VAT) primarily stores excess energy, brown adipose tissue (BAT) dissipates it in a process termed nonshivering thermogenesis. Several key VAT features, particularly murine epidydimal VAT, are regulated by a distinct population of regulatory T (Treg) cells, raising the question of whether BAT hosts an analogous population. Although Treg cells have been observed in BAT, their properties and mechanisms of action require elucidation. We found BAT Treg cells to be heterogeneous in subtissular localization and subtype composition. Punctual depletion of Treg cells unleashed interferon-γ (IFN-γ)-producing lymphocytes in BAT, but not in subcutaneous or visceral fat depots, leading to IFN-γ-dependent mitochondrial dysfunction and metabolic dysregulation, thereby impeding nonshivering thermogenesis. Cold challenge selectively expanded the IL-18R1+ Treg subtype in BAT; stripping this receptor specifically from Treg cells unleashed IFN-γ-producing lymphocytes and compromised temperature control. Thus, control of local IFN-γ production is a core feature of Treg cell control of tissue homeostasis.


Conflict of interest statement

Competing interests: The authors declare that they have no competing interests.

Figures

Fig. 1.
Fig. 1.. Brown and subcutaneous adipose tissue host similar Treg-cell compartments.
(A) Representative dot plots (left, center) and quantification (right) of gated Treg-cell fraction or number from the indicated tissues of 8-wk-old male B6 mice (n = 6). Numbers beside gates indicate frequencies of gated cells among total CD4+ T cells. (B, C) Volcano plots comparing the transcriptomes of BAT (left) or SAT (right) Treg cells with that of their splenic counterparts. Overlaid are up- (pink) or down- (blue) signatures from pan-tissue (B) or eVAT (C) Treg cells (25) (n = 2–3 RNA samples per group). (D, E) Representative dot plots (left, center) and quantification (right) of fraction or number of gated Treg cells expressing PPARγ (D) or ST2 (E) (n = 5). Numbers beside gates indicate frequencies of gated cells (right gate) among total Treg cells (right + left gate). (F) Number of Treg cells (left) or frequency of ST2+ Treg cells (right) in the indicated fat depots and the spleen over time (n = 6–8). (G) Expression:expression plot comparing the SAT and BAT Treg-cell transcriptomes (n = 3 RNA samples per group). Summary plots show data pooled from ≥2 independent experiments. Mean ± SD. One-way ANOVA with Turkey’s multiple comparisons test (A, D, E) or χ2 test (B, C); *p < 0.05, **p < 0.01, ***p < 0.001, ****p< 0.0001. BAT, brown adipose tissue; SAT, subcutaneous adipose tissue; eVAT, epididymal visceral adipose tissue; Sp, spleen; Treg, regulatory T; FC, fold-change.
Fig. 2.
Fig. 2.. Adipose-tissue Treg-cell compartments are heterogeneous.
(A) Representative anti-TH immunofluorescence images to highlight sympathetic neurons within BAT from 8-wk-old Foxp3.GFP reporter mice. Controls are presented in Fig. S2A. (B) UMAP of scRNA-seq data from BAT-, SAT- or eVAT-Treg cells isolated from 24 8-wk-old mice and on eVAT-Treg cells from 40-wk-old mice that have been previously reported (27). (C) Left: heatmap of the most differentially expressed genes for each cluster; right: Overlay of marker-transcript expression. Color-code corresponds to that of (B). (D) UMAP in (B) split by fat depot type. (E) Summary cytofluorometric quantification of Treg subtypes (n = 10–11 mice over 3 independent experiments). Gating strategy and representative dot plots are depicted in Fig. S2B. (F) Overlay of published eVAT-Treg up- and down- signatures on the UMAP of (B). (G) Representative cytofluorometric plots (left) and quantification (right) of gated CD73hiST2lo or CD73loST2hi Treg cells (n = 7 mice from two independent experiments). Numbers beside gates indicate frequencies. Mean ± SD. One-way (G) or two-way (E) ANOVA with Tukey’s multiple comparisons test; p-values as per Fig. 1. TH, Tyrosine hydroxylase; UMAP, Uniform Manifold Approximation and Projection; wk, week; eVAT8, 8-wk eVAT; eVAT40, 40-wk eVAT.
Fig. 3.
Fig. 3.. Acute loss of Treg cells increases inflammatory programs in BAT while compromising metabolic programs.
Eight-wk-old, male DTR+ and DTR littermates were administered diphtheria toxin to specifically deplete Treg cells in the former. DT was injected at days 0, 1 and 2, and mice were analyzed on days 3 or 4 (n = 4–5). (A-D) BAT, SAT and spleen (Sp) were assayed on the indicated days after the initial DT injection. Frequency of Treg cells (A). Mouse and tissue weights (B). Immunocyte numbers (C, D). (E) Volcano plots comparing the whole-tissue transcriptomes of BAT (left) or SAT (right) depleted or not depleted of Treg cells on day 4 after the first DT injection. Some BAT lineage-defining and thermogenic transcripts are indicated. Differentially expressed genes (≥ 2-fold, p < 0.05) highlighted in red (up) or blue (down), n = 3–4 RNA samples per group. (F) Gene Set Enrichment Analysis: shown are the Hallmark gene sets most differentially enriched or impoverished in the BAT transcriptome. (G) Key differentially expressed Hallmark signatures identified in (F) are overlain on the volcano plots of (E). Numbers at the top indicate up (right) and down (left) regulated transcripts. Mean ± SD. Two-way ANOVA with Šidák’s multiple comparisons test (A-D) and, χ2 test (G). P values as per Fig. 1. DT, diphtheria toxin; DTR, DT receptor; DT, Diphtheria toxin.
Fig. 4.
Fig. 4.. Loss of Treg cells blunts the thermogenic response and is associated with BAT mitochondrial dysfunction.
Foxp3.DTR+ mice acclimatized to thermoneutrality for 1 wk were depleted of Treg cells by administration of DT on days 0–2. The temperature was lowered to 4°C on day 4 and analysis performed on day 5. Control DTR+ mice were injected with PBS (PBS n = 11; DT n = 9; cumulative of two independent experiments). (A) Body mass composition on day −1. (B) The profile of energy expenditure (EE) during the entire 5-day experimental course. (C) Close-up of the final 24 h, once the temperature had been lowered to 4°C. (D) Linear regression ANCOVA to compare slopes of mass versus EE within (Mass effect) and between groups (Group effect). (E) Core body temperature (rectal) at experimental endpoint, (F) and versus residual BAT Treg-cell numbers. (G) Profile of body temperatures measured via peritoneal probes (PBS n = 5; DT n = 4). (H) Representative H&E staining of the BAT depot at the experimental endpoint. Arrows show examples of lipid accumulation. (I) Serum glycerol or FFA levels. (J) Immunoblot of BAT lysates (left) and densitometry quantification (right) for indicated proteins. Vinculin is the loading control (representative of two independent experiments). (K) Left: representative transmission electron micrographs of BAT mitochondria from cold-exposed mice. Arrows highlight examples of aberrant cristae. Right: quantification of the total mitochondrial or cristae area (n ≥ 140 mt, each dot represents a quantified micrograph from one of the 3 mice per group). Mean ± SD or ± SEM (B, C, G). Two-way ANOVA with Šidák’s multiple comparisons test (A), area under the curve and Student’s t test analysis (B, C & G), Student’s t test (E, I, J, K), unless otherwise stated. P values as per Fig. 1. PBS, phosphate-buffered saline; h, hour; FOV, field of view; mt, mitochondria; FFA, Free fatty acid; Vin. Vinculin.
Fig. 5.
Fig. 5.. Treg-deficient mice show metabolic dysregulation and mitochondrial aberrancies upon treatment with an Adrb3 agonist.
(A) Volcano plot comparing the BAT transcriptomes of mice treated with CL316, 243 (CL) or PBS for 4h (n = 3 RNA samples per group). Differentially expressed (≥ 2-fold, p < 0.05) (bottom) and total (top) transcripts are indicated. (B) Pathway analysis on the differentially expressed genes highlighted in (A). (C-H) Mice with (DTR) or without (DTR+) Treg cells were administered CL or PBS and analyzed. (C) Experimental Scheme. (D) Volcano plot comparing the transcriptomes of DTR+ and DTR mice. CL-induced (olive) or repressed (green) gene signatures from (A) are overlain (n = 3 RNA samples per group). (E) GSEA showing the Hallmark gene-sets most impoverished in CL-treated Treg-cell-deficient mice. (F) Representative H&E histology of BAT depots. Arrows indicate lipid droplets. (G) Representative immunoblot of whole-lysates (top) and densitometry quantification (bottom) for the indicated proteins extracted from BAT tissues. Vin. = loading control. Triplicate data. (H) Top and center: representative transmission electron micrographs of BAT mitochondria with arrows highlighting examples of those with aberrant cristae; bottom: quantification of cristae area (n ≥ 120 mt, each dot represents a quantified micrograph from one of the 3 mice per group). (I) Trace of energy expenditure (left; Mean ± SEM) and cumulative EE during the acute (0–4h) or dark phase following CL injection (right; n = 7–8 mice per group). Mean ± SD, unless stated. Two-way ANOVA with Tukey’s multiple comparisons test (G), Student’s t-test (H; I, right), χ2 test (D), or ANCOVA (I, left ). P values as per Fig. 1. CL, Adrb3 agonist CL316, 243.
Fig. 6.
Fig. 6.. IFN-γ underlies brown-adipocyte mitochondrial dysfunction in the absence of Treg cells.
(A) IFN-γ-producing immunocytes in BAT of mice with (DTR) or without (DTR+) Treg cells (Fig. 3). (B) Volcano plot highlighting the Hallmark IFN gamma-response gene signature observed in BAT transcriptomes from mice depleted of Treg cells and administered α-IFN-γ or isotype-control antibody (as per Fig. S7D). (C-G) DTR+ and DTR mice were acclimatized to thermoneutrality for one week before administration of DT and α-IFN-γ or isotype-control antibody, and temperature switched to 4°C for 48 h (n = 7–10 per group, pooled from two independent experiments). (C) EE trace during the cold period. (D) EE during active phase plotted against the average mass over the cold period and general linear model (GLM) to test metabolic variables (Fig. 4D). (E) Core temperature and, (F) representative H&E staining and, (G) transmission electron micrographs of BAT at experimental endpoint. Arrows highlight examples of mitochondria with aberrant cristae (left), and quantified (right) Ctl-Ab n ≥ 180 mt; α-IFN-γ: 270 mt, each dot represents a micrograph from one of the 3–4 mice per group). (H) Upper left: Trace of oxygen consumption rate of in vitro-differentiated primary brown adipocytes, treated with IFN-γ or PBS. Upper right: Summary data of indicated parameter. Lower: Scheme of parameters measured. Representative of 2 independent experiments (n = 6–7 wells per group). (I) GSEA showing the Hallmark gene sets most enriched and impoverished in IFN-γ-treated BAs. (J) Volcano plot comparing the transcriptomes of BAs treated with IFN-γ or vehicle. A mouse TF signature is overlaid in pink (68), with significantly differentially expressed genes highlighted in grey (≥ 2-fold, p < 0.05). Mean ± SD, unless SEM (C, H). Student’s t-test (A, H), χ2 test (B), one-way ANOVA with Tukey’s multiple comparison test (E, G), or linear regression & ANCOVA (D). P-values as per Fig. 1. Ctl-Ab, isotype control antibody; IFN, interferon; OCR, oxygen consumption rate; Oligo.; oligomycin; FCCP; carbonyl cyanide-4 (trifluoromethoxy) phenylhydrazone; R/A; Retenone/antimycin A; non.mt = non-mitochondrial; Max, maximum.
Figure 7.
Figure 7.. IL-18R1+ Treg cells protect against IFN-γ-mediated thermogenic dysfunction.
(A & B) Mice were housed at 4°C or RT for 24 h, and BAT immunocyte populations quantified by flow cytometry (n = 11–14 per group, pooled from three independent experiments). (A) Summary data on T cell subsets, (B) or Treg-cell subtypes defined in Fig. 2. (C) Psuedo bulk and volcano plot analysis comparing the Il18r1hi Treg cell cluster with all other clusters defined in the UMAP of Fig.2. (D) UMAP density plots for expression of indicated genes. (E-J) Foxp3cre.Il18r1+/+ and their Foxp3cre.Il18r1fl/fl littermates were assessed after 24 h at 4°C or RT (n = 6–9 per treatment group, pooled from 2 independent experiments). (E) Numbers of IL-18R1+ BAT Treg cells. Fractions of the CD4+ T cell compartment are presented in Fig S8F. (F) Frequencies (left) and numbers (right) of total BAT-Treg cells. (G) Representative dot plots (left) and summary quantification (right) of CD29 and IL18R1 expression in Il18r1- deleted mice and their wild-type littermates. CD29 is a surrogate marker for IL-18R1 expression in BAT-Treg cells according to the scRNA-seq data of Fig. 2. (H) Core body temperature determined using a rectal probe. (I) BAT Ifng transcript level determined by RT-qPCR. (J) Frequency of IFN-γ-expressing cells amongst the indicated BAT immunocyte types. Mean ± SD. Student’s t-test (A) Two-way ANOVA with Tukey’s (E, F, J) or Šidák (B, G, H, I) multiple comparisons test. P-values as per Fig. 1. RT, Room temperature.

References

    1. Mathis D, Immunological goings-on in visceral adipose tissue. Cell Metab. 17, 851–859 (2013). - PMC - PubMed
    1. Donath MY, Shoelson SE, Type 2 diabetes as an inflammatory disease. Nat Rev. Immunol. 11, 98–107 (2011). - PubMed
    1. Dikiy S, Rudensky AY, Principles of regulatory T cell function. Immunity. 56, 240–255 (2023). - PubMed
    1. Feuerer M, Herrero L, Cipolletta D, Naaz A, Wong J, Nayer A, Lee J, Goldfine AB, Benoist C, Shoelson S, Mathis D, Lean, but not obese, fat is enriched for a unique population of regulatory T cells that affect metabolic parameters. Nat Med. 15, 930–939 (2009). - PMC - PubMed
    1. Cipolletta D, Feuerer M, Li A, Kamei N, Lee J, Shoelson SE, Benoist C, Mathis D, PPAR-γ is a major driver of the accumulation and phenotype of adipose tissue Treg cells. Nature. 486, 549–553 (2012). - PMC - PubMed

Substances

LinkOut - more resources