. 2025 Sep;12(36):e03932.
doi: 10.1002/advs.202503932. Epub 2025 Jul 25.

A Human Immuno-Lung Organoid Model to Study Macrophage-Mediated Lung Cell Senescence Upon SARS-CoV-2 Infection

Affiliations

A Human Immuno-Lung Organoid Model to Study Macrophage-Mediated Lung Cell Senescence Upon SARS-CoV-2 Infection

Yuling Han et al. Adv Sci (Weinh). 2025 Sep.

Abstract

While COVID-19 affects multiple organ systems, the human respiratory system is the primary viral target and main site for disease progression. In this study, spatial transcriptional assays (NanoString CosMx) are utilized to analyze both explant and autopsy samples from non-COVID and COVID-19 lungs, identifying the activation of proinflammatory macrophages in COVID-19 explants. It is further developed immuno-lung organoids comprising hPSC-derived alveolar and airway organoids co-cultured with macrophages to investigate the impact and underlying mechanisms of macrophage-mediated lung damage following SARS-CoV-2 infection. The findings demonstrate that proinflammatory macrophages induce lung cell senescence through the THBS1-(ITGA3+ITGB1) signaling axis, a mechanism further validated using spatial transcriptomics. This study not only establishes physiologically relevant immuno-lung organoid models for modeling macrophage-mediated tissue damage, but also identifies a previous unrecognized role of the THBS1-(ITGA3+ITGB1) pathway in driving lung cell senescence during infectious disease.

Keywords: macrophage; organoid; spatial transcriptomics.


Conflict of interest statement

S.C. and T.E. are the co‐founders of Oncobeat, Inc. S.C is the co‐founder of iOrganBio, Inc. The other authors have no conflict of interest.

Figures
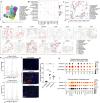
Figure 1
Figure 1
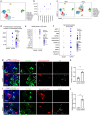
Spatial transcriptomics analysis of lung explant and autopsy samples from COVID‐19 patients. a) UMAP of non‐COVID (N=6), COVID‐E (N=6), COVID‐A (N=10) lung samples. b) Dot plot of marker gene expression in each cluster of non‐COVID (N=6), COVID‐E (N=6), COVID‐A (N=10) lung samples. c) Representative image plot shows the cell types in a non‐COVID sample. d) Representative image plots show the marker gene expression of each cluster of non‐COVID (N=6), COVID‐E (N=6), COVID‐A (N=10) lung samples. e) Quantification of macrophages and monocytes in non‐COVID (N=6), COVID‐E (N=6), COVID‐A (N=10) lung samples. f) Representative images of immunostaining of CD68 and a‐SMA in non‐COVID, COVID‐E, COVID‐A lung samples. Scale bar=20 µm. g) Quantification of CD68+ macrophages in in non‐COVID (N=6), COVID‐E (N=6), COVID‐A (N=10) lung samples. h) Dot plot analysis of proinflammatory macrophage‐associated genes in the macrophage cluster of non‐COVID (N=6), COVID‐E (N=6), COVID‐A (N=10) lung samples. i) Dot plot analysis of pulmonary fibrosis‐associated genes in the fibroblast cluster of non‐COVID (N=6), COVID‐E (N=6), COVID‐A (N=10) lung samples.
Figure 2
Figure 2
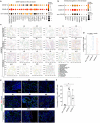
hPSC‐derived immuno‐alveolar organoids to study macrophage‐mediated lung damage during SARS‐CoV‐2 infection. a) UMAP of hPSC‐derived immuno‐alveolar organoids analyzed by scRNA‐seq. b) Dot plot displaying cell marker gene of each cluster of hPSC‐derived immuno‐alveolar organoids. c) Individual UMAP of immuno‐alveolar organoids exposed to mock (AVM+M) or SARS‐CoV‐2 (MOI=0.25, AVM+S), and alveolar organoids co‐cultured with 293T cells exposed to SARS‐CoV‐2 (MOI=0.25, AVT+S). d) Dot plot analysis of proinflammatory macrophage‐associated genes in macrophage cluster of AVM+M and AVM+S conditions. e,f) Immunostaining (e) and quantification (f) of the relative expression of IL‐1β in RFP+ macrophages of AVM+M and AVM+S conditions. The yellow arrows highlight the expression of IL1‐B in RFP+ macrophages. Scale bar= 50 µm. g) Enrichment of cell death pathways in AT2 cell cluster of immuno‐alveolar organoids (AVM+S) or 293T co‐cultured with alveolar organoids (AVT+S) exposed to SARS‐CoV‐2 (MOI=0.25). h) Gene Set Enrichment Analysis (GSEA) of senescence pathway in AT2 cell cluster of AVM+S versus AVT+S condition. i) Dot plot analysis of senescence‐associated secretory phenotype (SASP) associated genes in AT2 cell cluster of AVM+S and AVT+S conditions. j) Dot plot analysis of senescence associated genes in AT2 cell cluster of AVM+S and AVT+S conditions. k,l) Immunostaining (k) and quantification (l) of the relative expression of p21 in of AVM+S and AVT+S conditions. The yellow arrows highlight the expression of p21 in HT2‐280+ AT2 cells. Scale bar= 50 µm. m,n) Immunostaining (m) and quantification (n) of the relative expression of γH2A.X in of AVM+S and AVT+S conditions. The yellow arrows highlight the expression of γH2A.X in HT2‐280+ AT2 cells. Scale bar= 50 µm. N=3 independent biological replicates. Data was presented as mean ± STDEV. P values were calculated by unpaired two‐tailed Student's t‐test. **P < 0.01.
Figure 3
Figure 3
Construction and sn‐multiomics analysis of alveolar organoids containing unstimulated or proinflammatory macrophages. a) UMAP of hPSC‐derived immuno‐alveolar organoids containing unstimulated (AVUM) or proinflammatory macrophages (AVPM). b) Dot plot displaying cell marker genes. c) Individual UMAP of snRNA‐seq and snATAC‐seq analysis of hPSC‐derived AVUM or AVPM organoids. d) Dot plot analysis of proinflammatory macrophage‐associated genes in macrophage cluster of hPSC‐derived AVUM or AVPM organoids. e) Dot plot analysis of SASP associate genes in AT2 cell cluster of hPSC‐derived AVUM or AVPM organoids. f) Dot plot analysis of senescence associate genes in AT2 cell cluster of hPSC‐derived AVUM or AVPM organoids. g,h) Immunostaining (g) and quantification (h) of the relative expression of p21 in of hPSC‐derived AVUM or AVPM organoids. The yellow arrows highlight the expression of p21 in HT2‐280+ AT2 cells. Scale bar= 50 µm. i,j) Immunostaining (i) and quantification (j) of the relative expression of γH2A.X in hPSC‐derived AVUM or AVPM organoids. The yellow arrows highlight the expression of γH2A.X in HT2‐280+ AT2 cells. Scale bar= 50 µm. N=3 independent biological replicates. Data was presented as mean ± STDEV. P values were calculated by unpaired two‐tailed Student's t test. **P < 0.01.
Figure 4
Figure 4
Proinflammatory macrophages cause lung cell senescence by the THBS1‐(ITGA3+ITGB1) pathway. a) Dot plot shows the upregulated signals from macrophages to AT2 cells in alveolar organoids containing unstimulated (AVUM) or proinflammatory macrophages (AVPM). b) Dot plot shows the upregulated signals from macrophages to AT2 cells in immuno‐alveolar organoids exposed to mock (AVM+M) versus SARS‐CoV‐2 (MOI=0.25, AVM+S). c,d) Immunostaining (c) and quantification (d) of the relative expression of p21 in hPSC‐derived alveolar organoids treated with control or 5 µg mL−1 THBS1 protein. The yellow arrows highlight the expression of p21 in HT2‐280+ AT2 cells. Scale bar= 50 µm. e,f) Immunostaining (e) and quantification (f) of the relative expression of γH2A.X in hPSC‐derived airway organoids treated with control or 5 µg mL−1 THBS1 protein. The yellow arrows highlight the expression of p21 in HT2‐280+ AT2 cells. Scale bar= 50 µm. g,h) Immunostaining (g) and quantification (h) of the relative expression of p21 in hPSC‐derived immuno‐alveolar organoids treated with control or 10 µg mL−1 THBS1 blocking antibody upon SARS‐CoV‐2 infection. The yellow arrows highlight the expression of p21 in HT2‐280+ AT2 cells. Scale bar= 50 µm. i,j) Immunostaining (i) and quantification (j) of the relative expression of γH2A.X in hPSC‐derived immuno‐alveolar organoids treated with control or 10 µg mL−1 THBS1 blocking antibody upon SARS‐CoV‐2 infection. The yellow arrows highlight the expression of γH2A.X in HT2‐280+ AT2 cells. Scale bar= 50 µm. N=3 independent biological replicates. Data was presented as mean ± STDEV. P values were calculated by unpaired two‐tailed Student's t test. *P < 0.05, **P < 0.01.
Figure 5
Figure 5
Senescence increases in lung cells of COVID‐19 explant samples. a) Dot plot analysis of SASP associate genes in AT2 cell cluster of non‐COVID (N=6), COVID‐E (N=6), COVID‐A (N=10) lung samples. b) Dot plot analysis of senescence associate genes in AT2 cell cluster of non‐COVID (N=6), COVID‐E (N=6), COVID‐A (N=10) lung samples. c,d) Representative image plots (c) and quantification (d) shows the expression of IGFBP6 in non‐COVID (N=6), COVID‐E (N=6), COVID‐A (N=10) lung samples. e,f) Immunostaining (e) and quantification (f) of the relative expression of p21 in non‐COVID (N=6), COVID‐E (N=6), COVID‐A (N=10) lung samples. The yellow arrows highlight the expression of p21 in HT2‐280+ AT2 cells. Scale bar= 50 µm. N=3 independent biological replicates. Data was presented as mean ± STDEV. P values were calculated by unpaired two‐tailed Student's t test. *P < 0.05.

References

    1. Upadhya S., Rehman J., Malik A. B., Chen S., Physiology (Bethesda) 2022, 37, 88. - PMC - PubMed
    1. Rendeiro A. F., Ravichandran H., Bram Y., Chandar V., Kim J., Meydan C., Park J., Foox J., Hether T., Warren S., Kim Y., Reeves J., Salvatore S., Mason C. E., Swanson E. C., Borczuk A. C., Elemento O., Schwartz R. E., Nature 2021, 593, 564. - PMC - PubMed
    1. Kulasinghe A., Tan C. W., Miggiolaro A. F. R. S., Monkman J., SadeghiRad H., Bhuva D. D., Junior J. S. M., Paula C. B. V., Nagashima S., Baena C. P., Eur. Respir. J. 2022, 59, 2101881.
    1. Cross A. R., de Andrea C. E., Villalba‐Esparza M., Landecho M. F., Cerundolo L., Weeratunga P., Etherington R. E., Denney L., Ogg G., Ho L. P., Roberts I. S., Hester J., Klenerman P., Melero I., Sansom S. N., Issa F., JCI Insight 2023, 8, 157837. - PMC - PubMed
    1. Yamanaka S., Cell Stem Cell 2020, 27, 523. - PubMed

Substances

LinkOut - more resources