

Expanded and activated marrow-infiltrating lymphocytes exhibit potent antimyeloma activity against autologous multiple myeloma cells
- PMID: 40712432
- PMCID: PMC12311938
- DOI: 10.1016/j.tranon.2025.102475
Expanded and activated marrow-infiltrating lymphocytes exhibit potent antimyeloma activity against autologous multiple myeloma cells
Abstract
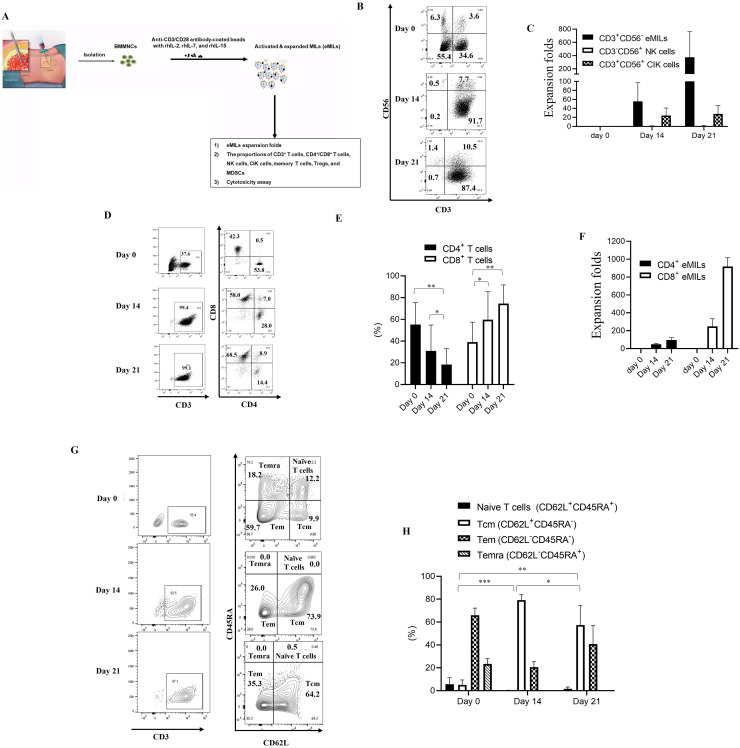
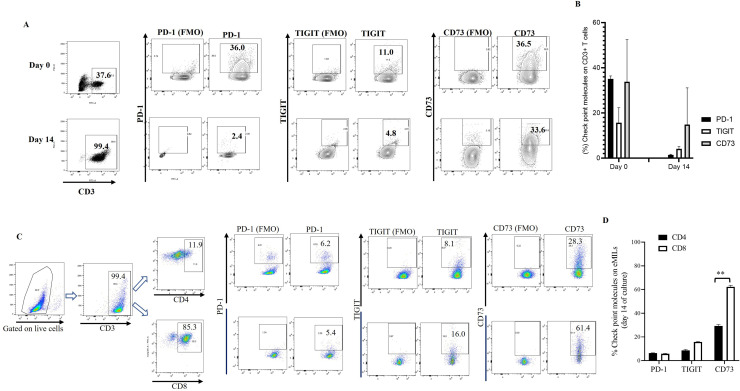
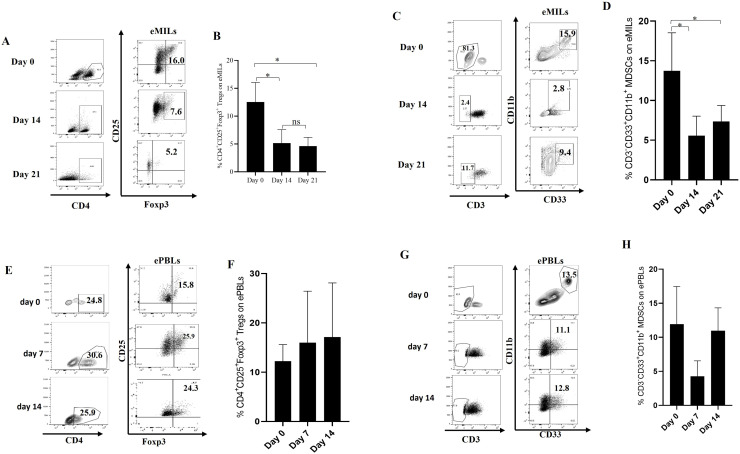
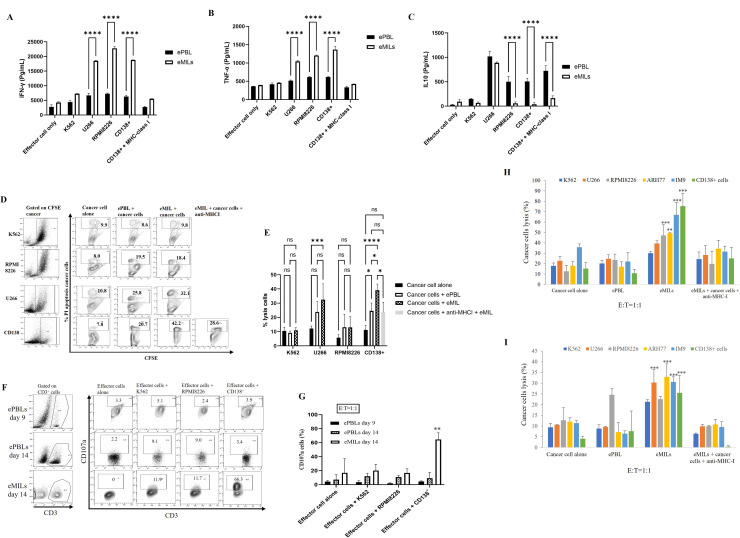
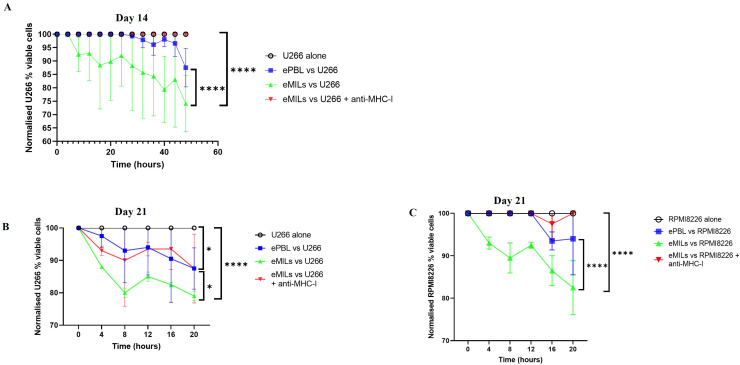
Adoptive immunotherapy represents a promising treatment for multiple myeloma (MM), relying on the availability of sustainable tumor-specific cytotoxic T cells. This study generated potent ex vivo expanded and activated marrow-infiltrating lymphocytes (eMILs) from MM patients and evaluated their immunologic characteristics and cytotoxic potential. MILs were expanded using anti-CD3/CD28 beads in the presence of IL-2, IL-7, and IL-15. The expansion rate, proportions of effector cells (including CD4+T cells, CD8+T cells, natural killer cells, and memory T cells), and the functional capacity of eMILs were assessed over 2 weeks of culture. Co-culturing MILs with anti-CD3/CD28 beads and cytokines resulted in substantial expansion and activation of MILs during the 14-day culture period. The eMILs displayed an increased proportion of CD8+T cells and a high prevalence of central memory T cells (Tcm; > 80 %), with minimal presence of myeloid-derived suppressor cells or regulatory T cells. Compared to expanded peripheral blood lymphocytes, eMILs demonstrated potent cytotoxicity against target MM cells, particularly CD138+ primary MM cells from autologous patients. These findings suggest that MILs derived from the bone marrow (BM) of MM patients can be expanded and activated to exhibit enhanced antigen specificity for CD138+ MM cells. Furthermore, eMILs may induce sustained cytotoxic effects due to their high proportion of Tcms. In conclusion, as a unique subset of T cells shaped by the BM microenvironment, MILs show promise as a novel immunotherapeutic approach for MM.
Keywords: Bone marrow; Immunotherapy; Marrow-infiltrating lymphocytes; Multiple myeloma; Treatment.
Copyright © 2025. Published by Elsevier Inc.
Conflict of interest statement
Declaration of competing interest The authors declare that they have no competing financial interests or personal relationships that could have influenced the work reported in this manuscript.
Figures
Similar articles
-
Prescription of Controlled Substances: Benefits and Risks.2025 Jul 6. In: StatPearls [Internet]. Treasure Island (FL): StatPearls Publishing; 2025 Jan–. 2025 Jul 6. In: StatPearls [Internet]. Treasure Island (FL): StatPearls Publishing; 2025 Jan–. PMID: 30726003 Free Books & Documents.
-
NK cells with adhesion defects and reduced cytotoxic functions are associated with a poor prognosis in multiple myeloma.Blood. 2024 Sep 19;144(12):1271-1283. doi: 10.1182/blood.2023023529. Blood. 2024. PMID: 38875515
-
Current Anti-Myeloma Chimeric Antigen Receptor-T Cells: Novel Targets and Methods.Balkan Med J. 2025 Jul 1;42(4):301-310. doi: 10.4274/balkanmedj.galenos.2025.2025-4-25. Balkan Med J. 2025. PMID: 40619794 Free PMC article. Review.
-
T-cell receptor/CD28-targeted immunotherapeutics selectively drive naive T-cell expansion to generate functional HIV-specific responses.J Virol. 2025 Aug 5:e0018825. doi: 10.1128/jvi.00188-25. Online ahead of print. J Virol. 2025. PMID: 40762498
-
¹⁸F-FDG PET/CT: a review of diagnostic and prognostic features in multiple myeloma and related disorders.Clin Exp Med. 2015 Feb;15(1):1-18. doi: 10.1007/s10238-014-0308-3. Epub 2014 Sep 14. Clin Exp Med. 2015. PMID: 25218739
References
-
- Clinic, M. (n.d.). Multiple myeloma. Mayo Clinic. Retrieved July 18, 2025, from https://www.mayoclinic.org/diseases-conditions/multiple-myeloma/symptoms....
-
- Cowan A.J., et al. Diagnosis and management of multiple myeloma: a review. JAMA. 2022;327(5):464–477. - PubMed
LinkOut - more resources
Full Text Sources
Research Materials
