. 2025 Aug 19;6(8):102250.
doi: 10.1016/j.xcrm.2025.102250. Epub 2025 Jul 24.

Synergically enhanced anti-tumor immunity of in vivo panCAR by circRNA vaccine boosting

Affiliations

Synergically enhanced anti-tumor immunity of in vivo panCAR by circRNA vaccine boosting

Yanyan Wang et al. Cell Rep Med. .

Abstract

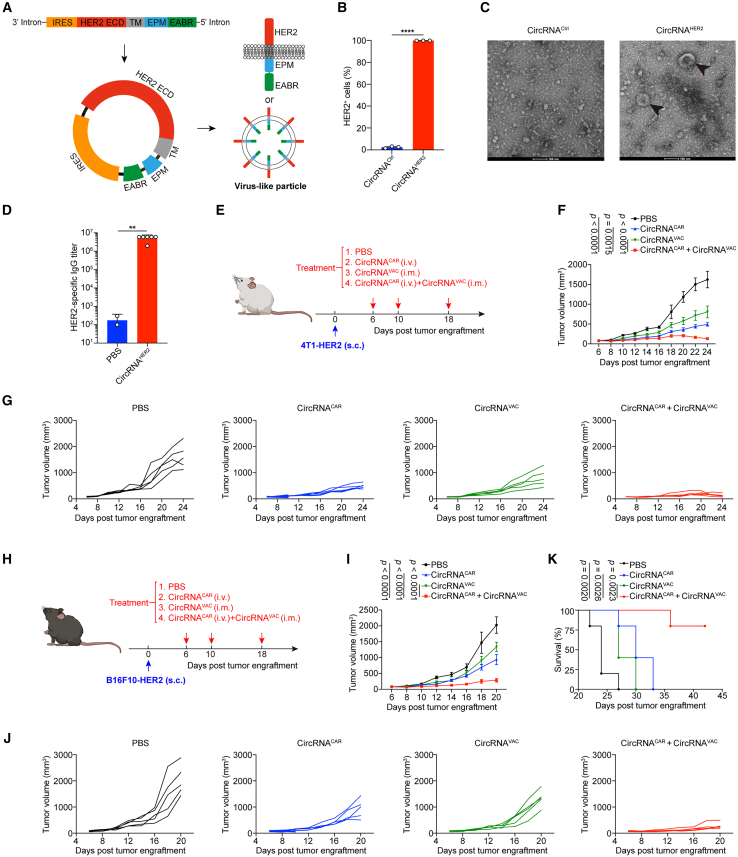
Chimeric antigen receptor (CAR) T cell therapy has shown promise in treating hematologic malignancies, but it still faces challenges, including high costs, a time-consuming manufacturing process, and the necessity of lymphodepletion. Here, we generate circular RNAs (circRNAs) encoding CAR proteins, referred to as circRNACAR, which mediates remarkable tumor killing in human primary T cells. We demonstrate that circRNACAR, delivered with immunocyte-tropic lipid nanoparticles (LNPs), can form in vivo panCAR cells (CAR-T, CAR-natural killer [NK], and CAR-macrophage), significantly inhibit tumor growth, and reshape the tumor microenvironment in mice. Importantly, combining in vivo panCAR with circRNA-based vaccines encoding the corresponding HER2 antigens exhibits synergistically enhanced anti-tumor immunity. Notably, circRNACAR can in return boost the level of vaccination-elicited HER2-specific antibodies, mediating effective killing of tumor cells by macrophages. In combination with vaccination, in vivo panCAR demonstrates a synergistic enhancement of anti-tumor immunity across various mouse models, thereby establishing a framework for the synergistic in vivo panCAR-VAC immunotherapy.

Keywords: RNA therapeutics; circRNA vaccine; in vivo CAR; off-the-shelf CAR; panCAR immunotherapy.


Conflict of interest statement

Declaration of interests Patents related to the data presented in this manuscript have been filed.

Figures

None
Graphical abstract
Figure 1
Figure 1
CircRNACAR efficiently expressed CAR proteins and mediated remarkable tumor killing (A) Schematic representation of circRNAAnti-HER2-CAR circularization via group I intron autocatalysis. (B and C) Detecting the expression of CAR proteins in HEK293T cells after circRNAAnti-HER2-CAR transfection via western blot (B) and flow cytometry (C). (D) Comparative analysis of CAR expression levels from circRNAAnti-HER2-CAR, 1mΨ-mRNAAnti-HER2-CAR, and unmodified mRNAAnti-HER2-CAR in HEK293T cells. (E–G) Optimization of circRNAAnti-HER2-CAR encoding CAR in Jurkat (E), THP-1 (F), and J774A.1 (G). (H) Detection of CAR expression in primary T cells using flow cytometry. (I–K) Cytotoxic effects of primary T cells transfected with circRNAAnti-HER2-CAR on SK-OV-3 (I), B16F10-HER2 (J), and 4T1-HER2 (K) tumor cells. (L–N) Cytotoxic effects of Jurkat cells transfected with circRNAAnti-HER2-CAR on SK-OV-3 (L), B16F10-HER2 (M), and 4T1-HER2 (N) tumor cells. (O–Q) Cytotoxic effects of THP-1 cells transfected with circRNAAnti-HER2-CAR on SK-OV-3 (O), B16F10-HER2 (P), and 4T1-HER2 (Q) tumor cells. In (C)–(Q), data were presented as mean ± SEM (n = 3). An unpaired two-sided Student’s t test was performed for comparison; ∗p < 0.05; ∗∗p < 0.01; ∗∗∗p < 0.001; ∗∗∗∗p < 0.0001; ns, not significant. See also Figure S1; Table S1.
Figure 2
Figure 2
Macrophages exhibited efficient tumor phagocytosis and pro-inflammatory polarization induced by circRNACAR (A and B) Phagocytosis of THP-1 cells transfected with circRNAAnti-HER2-CAR against SK-OV-3 (A) and MC38-HER2 (B) cells. (C) Phagocytosis of J774A.1 cells transfected with circRNAAnti-HER2-CAR against CT26-HER2 cells. (D and E) Effects of circRNAAnti-HER2-CAR on iNOS (D) and CD206 (E) expression in J774A.1. (F and G) Effects of circRNAAnti-HER2-CAR on iNOS (F) and CD206 (G) expression in THP-1 cells. (H) Volcano plot illustrating differentially expressed genes in THP-1 cells. (I) Heatmap depicting gene expression patterns in THP-1 cells (n = 2). (J) Bubble chart of relevant biological processes via Gene Ontology (GO) analysis (n = 2). Bubble size represents the number of genes. In (A)–(G), data were presented as mean ± SEM (n = 3). An unpaired two-sided Student’s t test was conducted for comparison; ∗p < 0.05; ∗∗p < 0.01; ∗∗∗p < 0.001; ∗∗∗∗p < 0.0001; ns, not significant. See also Figure S1.
Figure 3
Figure 3
Screening for immunocyte-tropic LNPs that efficiently delivered circRNAs into immune cells in mice (A) Schematic representation of the LNP-circRNA complex. (B and C) The size distribution (B) and zeta potential (C) of the LNP-circRNALuciferase complex. (D and E) Bioluminescence imaging in vivo (D) or ex vivo (E) of BALB/c mice intravenously injected with PBS or LNP-circRNALuciferase. (F and G) Bioluminescence imaging in vivo (F) or ex vivo (G) of BALB/c mice intravenously injected with PBS or SORT-circRNALuciferase. (H) Evaluation of targeting efficiency of SORT-circRNACre in the spleen of reporter mice. (I) Detection of anti-HER2-CAR expression at different time points in various immune cells of mouse spleen. In (H) and (I), data were presented as mean ± SEM, an unpaired two-sided Student’s t test was performed for comparison; ∗p < 0.05; ∗∗p < 0.01; ∗∗∗p < 0.001; ∗∗∗∗p < 0.0001; ns, not significant. See also Figure S2.
Figure 4
Figure 4
CircRNACAR efficiently inhibited tumor growth and improved survival time in mice (A) Schematic illustration of intravenous PBS, LNP-circRNACtrl, or SORT-circRNAAnti-HER2-CAR treatment in the CT26-HER2 tumor model. (B) Tumor growth curves for CT26-HER2 tumor-bearing mice treated as indicated in (A). (C) Schematic illustration of intratumoral PBS, LNP-circRNACtrl, or LNP-circRNAAnti-HER2-CAR treatment in the CT26-HER2 tumor model. (D and E) Tumor growth curves (D) and survival curves (E) of CT26-HER2 tumor-bearing mice treated as indicated in (C). (F) In vivo bioluminescence imaging of CT26-HER2 tumor-bearing mice treated as indicated in (C). (G) The quantified signal intensity of bioluminescence imaging in (F). (H) Schematic illustration of intratumoral PBS, LNP-circRNACtrl, or LNP-circRNAAnti-HER2-CAR treatment in the 4T1-HER2 tumor model. (I) Tumor growth curves of 4T1-HER2 tumor-bearing mice treated as indicated in (H). (J) Tumor growth curves of individual 4T1-HER2 tumor-bearing mice treated as indicated in (H). (K) Schematic illustration of intratumoral PBS, LNP-circRNACtrl, or LNP-circRNACAR treatment in the MC38-HER2 tumor model. (L and M) Tumor growth curves (L) and survival curves (M) of MC38-HER2 tumor-bearing mice treated as indicated in (K). In (B), (D), (I), and (L), data were represented as the mean ± SEM, the tumor growth curves were calculated by two-way ANOVA analysis (n = 6). In (E) and (M), data were represented as the mean ± SEM, the survival curves were calculated by Kaplan-Meier simple survival analysis (n = 6). In (G), data were represented as the mean ± SEM, an unpaired two-sided Student’s t test was conducted for comparison. ∗p < 0.05; ∗∗p < 0.01; ∗∗∗p < 0.001; ∗∗∗∗p < 0.0001. See also Figure S2.
Figure 5
Figure 5
In vivo panCAR reshaped the tumor microenvironment to a pro-inflammatory state (A) Changes in the proportion of immune cells of spleen via flow cytometry. CD8+ T cells, CD8+ Tem cells, CD8+ Tcm cells, or CD4+ T cells were gated from CD45+ cell population, and Treg cells were gated from CD4+ T cell population. (B) Flow cytometric analysis of changes in the proportion of infiltrating immune cells in tumors. CD8+ T cells, CD4+ T cells, or MHC II+ macrophages were gated from CD45+ cell population, and Treg cells were gated from CD4+ T cell population. (C and D) H&E staining (C) or IHC staining (D) of tumor tissue sections obtained from CT26-HER2 tumor-bearing mice after PBS, SORT-LNP-circRNACtrl, or SORT-LNP-circRNAAnti-HER2-CAR treatment. The integrated density of IHC staining was quantified using ImageJ. (E) Heatmap of gene expression patterns of immune cells extracted from tumor tissues (n = 2). (F) Bubble chart of relevant biological processes through GO analysis (n = 2). The size of the bubbles represented the number of genes. (G) Gene set enrichment analysis (GSEA) showing enriched pathways in immune cells extracted from tumor tissues (n = 2). In (A), (B), and (D), data were represented as the mean ± SEM; an unpaired two-sided Student’s t test was conducted for comparison; ∗p < 0.05; ∗∗p < 0.01; ∗∗∗p < 0.001; ∗∗∗∗p < 0.0001; ns, not significant. Each symbol represents an individual mouse. See also Figures S3 and S4.
Figure 6
Figure 6
CircRNA vaccine synergistically boosted the anti-tumor activity of in vivo panCAR (A) Schematic illustration of circRNAVAC design. EPM, the endocytosis prevention motif; EABR, the ESCRT- and ALIX-binding region domain. (B) Flow cytometric analysis detecting the translation of circRNAHER2 in HEK293T cells (n = 3). (C) Electron microscopy showing the vesicles secreted by HEK293T cells transfected with circRNAHER2-EPM-EABR. (D) Measurement of the endpoint titer of HER2-specific IgG with ELISA. (E) Schematic illustration of 4T1-HER2 tumor-bearing mice receiving PBS (intravenously), circRNACAR (intravenously), circRNAVAC (intramuscularly), or circRNACAR (intravenously) plus circRNAVAC (intramuscularly) combined therapy (n = 5). (F) Tumor growth curves of overall mice treated as indicated in (E). (G) Tumor growth curves of individual mouse treated as indicated in (E). (H) Schematic illustration of B16F10-HER2 tumor-bearing mice receiving PBS (intravenously), circRNACAR (intravenously), circRNAVAC (intramuscularly), or circRNACAR (intravenously) plus circRNAVAC (intramuscularly) combined therapy (n = 5). (I) Tumor growth curves of overall mice treated as indicated in (H). (J) Tumor growth curves of individual mouse treated as indicated in (H). (K) Survival curves of B16F10-HER2 tumor-bearing mice treated as indicated in (H). In (B), data were represented as the mean ± SEM; an unpaired two-sided Student’s t test was performed for comparison. In (D), data were represented as the geometric mean ± geometric SD; an unpaired two-sided Student’s t test was performed for comparison. In (F) and (I), data were represented as the mean ± SEM, and the tumor growth curves were calculated by two-way ANOVA analysis. In (K), the survival curves were calculated by Kaplan-Meier simple survival analysis. ∗p < 0.05; ∗∗p < 0.01; ∗∗∗p < 0.001; ∗∗∗∗p < 0.0001; ns, not significant. See also Figures S5−S7; Table S1.
Figure 7
Figure 7
In vivo panCAR enhanced the anti-tumor activity via antibody-mediated cellular cytotoxicity (A) Measurement of HER2-specific IgG, IgG1, IgG2A, IgG2B, or IgG2C-binding antibodies with ELISA (n = 5 or 6). (B and C) HER2-specific antibodies in (A) mediated cellular cytotoxicity against SK-OV-3 (B) and MC38-HER2 (C) tumor cells in J774A.1. (D and E) HER2-specific antibodies in (A) mediated cellular cytotoxicity against SK-OV-3 (D) and MC38-HER2 (E) tumor cells in RAW 264.7. (F) Tumor growth curves of overall CT26 tumor-bearing mice treated with PBS, in vivo panCAR-VAC, or in vivo panCAR-VAC plus anti-NK1.1 antibodies to deplete NK cells (n = 5). (G) Tumor growth curves of individual mouse treated as indicated in (F). (H) Survival curves of mice treated as indicated in (F). (I) Tumor growth curves of overall CT26 tumor-bearing mice treated with PBS, in vivo panCAR-VAC, or in vivo panCAR-VAC plus anti-CSF1R antibody to deplete macrophages (n = 5). (J) Tumor growth curves of individual mouse treated as indicated in (I). (K) Survival curves of mice treated as indicated in (I). (L) The potential mechanism diagram of synergistic in vivo panCAR-VAC immunotherapy. In (A), data are shown as the mean ± SEM; In (B)–(E), data were represented as the mean ± SEM; an unpaired two-sided Student’s t test was performed for comparison. In (F) and (I), tumor growth curves were calculated by two-way ANOVA analysis (n = 5). In (H) and (K), survival curves were calculated by Kaplan-Meier simple survival analysis (n = 5). ∗p < 0.05; ∗∗p < 0.01; ∗∗∗p < 0.001; ∗∗∗∗p < 0.0001; ns, not significant. See also Figure S7.

References

    1. Flugel C.L., Majzner R.G., Krenciute G., Dotti G., Riddell S.R., Wagner D.L., Abou-El-Enein M. Overcoming on-target, off-tumour toxicity of CAR T cell therapy for solid tumours. Nat. Rev. Clin. Oncol. 2023;20:49–62. doi: 10.1038/s41571-022-00704-3. - DOI - PMC - PubMed
    1. Rafiq S., Hackett C.S., Brentjens R.J. Engineering strategies to overcome the current roadblocks in CAR T cell therapy. Nat. Rev. Clin. Oncol. 2020;17:147–167. doi: 10.1038/s41571-019-0297-y. - DOI - PMC - PubMed
    1. Amini L., Silbert S.K., Maude S.L., Nastoupil L.J., Ramos C.A., Brentjens R.J., Sauter C.S., Shah N.N., Abou-El-Enein M. Preparing for CAR T cell therapy: patient selection, bridging therapies and lymphodepletion. Nat. Rev. Clin. Oncol. 2022;19:342–355. doi: 10.1038/s41571-022-00607-3. - DOI - PubMed
    1. Maalej K.M., Merhi M., Inchakalody V.P., Mestiri S., Alam M., Maccalli C., Cherif H., Uddin S., Steinhoff M., Marincola F.M., Dermime S. CAR-cell therapy in the era of solid tumor treatment: current challenges and emerging therapeutic advances. Mol. Cancer. 2023;22:20. doi: 10.1186/s12943-023-01723-z. - DOI - PMC - PubMed
    1. Chen Z., Hu Y., Mei H. Advances in CAR-Engineered Immune Cell Generation: Engineering Approaches and Sourcing Strategies. Adv. Sci. 2023;10 doi: 10.1002/advs.202303215. - DOI - PMC - PubMed

MeSH terms