. 2025 Jul 25;13(7):e011783.
doi: 10.1136/jitc-2025-011783.

hCCL19-expressing recombinant Newcastle disease virus boosts CAR T cell infiltration and efficacy in solid tumor

Affiliations

hCCL19-expressing recombinant Newcastle disease virus boosts CAR T cell infiltration and efficacy in solid tumor

Man Liu et al. J Immunother Cancer. .

Abstract

Background: Chimeric antigen receptor (CAR) T cell therapy has revolutionized the treatment of hematological malignancies; however, it faces significant challenges in treating solid tumors, including limited immune infiltration into tumor tissues and immunosuppressive tumor microenvironment. Oncolytic viruses (OVs), which selectively destroy cancer cells and trigger antitumor immune responses, offer a compelling solution to these challenges. Newcastle disease virus (NDV) is a natural OV that exhibits antitumor activity with minimal side effects in clinical studies. We hypothesized that combining NDV, engineered to express a chemokine, with tetracycline-inducible CAR T cells could synergistically enhance CAR T cell therapy efficacy against solid tumors.

Methods: We constructed a recombinant NDV expressing human CCL19 (rNDV19) and evaluated its therapeutic efficacy alongside doxycycline-inducible CAR T cells in an orthotopic lung cancer mouse model. Tumor burden, immune cell infiltration, and mouse survival were analyzed.

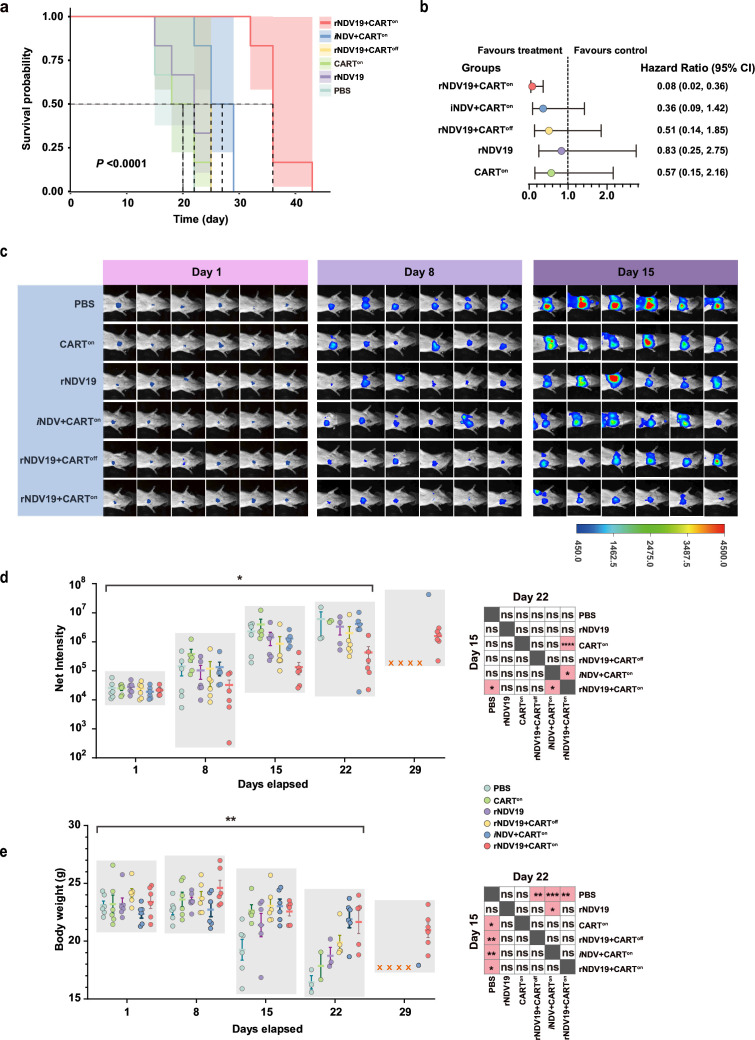
Results: rNDV19 retained potent oncolytic activity, significantly reducing tumor cell viability while achieving stable expression of human CCL19. rNDV19 triggered significant recruitment of CAR T cells into tumors and promoted their activity. Mechanistic analysis revealed that rNDV19 and CAR T cell combination therapy remodeled the tumor microenvironment. Transcriptomic profiling highlighted activation of critical immune pathways-including leukocyte chemotaxis, T cell differentiation, cytokine production, and immune response-activating signaling in combination therapy. These findings were further corroborated by upregulated expression of T cell activation markers like IL-2, TNF-α, IFN-γ, and cytotoxic effector molecules such as granzyme A and perforin. Therapeutically, the combination synergistically extended median survival time from 22 to 36 days, outperforming monotherapies.

Conclusions: The combination of rNDV19 and CAR T cells represents a promising strategy for overcoming the limitations of CAR T cell therapy for solid tumors. This approach enhances immune cell infiltration and activation, potentially converting "cold" tumors into "hot" tumors to improve therapeutic outcomes and offering a robust translational framework for solid tumor immunotherapy.

Keywords: Adoptive cell therapy - ACT; Oncolytic Viruses.


Conflict of interest statement

Competing interests: No, there are no competing interests.

Figures

Figure 1
Figure 1. Generation and characterization of recombinant Newcastle disease virus expressing human CCL19. (a) Schematic of the rNDV19 genome. The human CCL19 coding sequence (hCCL19) is inserted into the non-coding region between the hemagglutinin-neuraminidase (hn) and fusion protein genes (f). (b) Viral replication kinetics of rNDV19 versus iNDV. BHK-21 cells were infected at an MOI of 0.01, and culture supernatants were collected at 12 hours, 24 hours, 48 hours, and 72 hours postinfection (n=3). Viral titers were quantified by TCID50 assay. (c) Tumor-selective cytotoxicity of rNDV19 versus iNDV. NCI-H460 (human large cell lung carcinoma cells, n=4), BEAS-2B (immortalized human lung epithelial cells, n=4), along with PBMCs (n=3) from three healthy donors, were infected at an MOI of 0.01 for 72 hours. Cell viability was assessed using the CCK-8 assay. Cell viability (%) was calculated as [(ODtreatment−ODblank)/(ODcontrol−ODblank)] ×100. (d) Quantification of hCCL19 expression in rNDV19-infected NCI-H460 supernatants (n=3). Culture supernatants were collected at 24 hours, 48 hours, and 72 hours post-infection, and hCCL19 concentrations were measured using a Human CCL19/MIP-3β ELISA Kit. (e) Chemotaxis assay to evaluate hCCL19-mediated immune cell migration. UV-inactivated supernatants from NCI-H460 cells treated with PBS, iNDV, or rNDV19 (MOI=0.01, 72 hours postinfection) were added to the lower chambers of a Transwell system. PBMCs (1×10⁶ cells/well) were seeded in the upper chambers. Migrated cells in the lower chambers were quantified after 5 hours. The assay was repeated three times independently using single-donor PBMCs with biological triplicates (n=3 per experiment). (f) Flow cytometry analysis of CCR7+cell proportions in migrated cells. Migrated cells in the lower chamber of Transwell migration assays were stained with PE-conjugated anti-CCR7 antibody and analyzed by flow cytometry. Assays were performed with PBMCs from three healthy donors (n=3). Values are presented as mean±SD (b), or as individual data points (gray) with mean±SD (bars) (c, d, e, f). Data were analyzed by repeated-measure ANOVA (b), one-way ANOVA followed by Fisher’s LSD test (c, e), or two-way ANOVA followed by Fisher’s LSD test (f). *p<0.05, **p<0.01, ***p<0.001, ****p<0.0001, ns=not significant. Top curly bracket indicates multiple comparisons; overlines denote pairwise comparisons. rNDV19, recombinant Newcastle disease virus expressing human CCL19; iNDV, Newcastle disease virus Italien strain; MOI, multiplicity of infection; TCID50, 50% tissue culture infectious dose; PBMCs, peripheral blood mononuclear cell; PBS, phosphate buffered saline; UV, ultraviolet; PE, phycoerythrin; ANOVA, analysis of variance; GE, gene end; GS, gene start; LSD test, least significant difference test; n, biological replicates.
Figure 2
Figure 2. rNDV19 replicated in tumor and reduced tumor burden in synergy with CAR T cells. (a) Treatment regimen and sampling interval. Mice were stratified into four groups (PBS, CARTon, rNDV19+CARTon, and iNDV+CARTon). iNDV/rNDV19 was administered via intravenous injection on days 1 and 4: combination groups received either rNDV19 or iNDV, while PBS and CARTon received PBS. CAR T cells were administered on days 8, 11, and 15: treatment groups (CARTon, rNDV19+CARTon, iNDV+CARTon) received CAR T cells, and the PBS group received PBS. All mice in treatment groups were maintained on Dox (50 mg/kg) from 24 hours prior to the first CAR T cells infusion until the study endpoint. Tumor tissues, serum, and organs were collected for analysis at days 7, 10, and 16 (indicated by arrows). (b) iNDV/rNDV19 replication kinetics and exogenous hCCL19 expression in tumor tissues. The mRNA copy numbers of NDV np gene and hCCL19 gene were quantified by dPCR and normalized to the luciferase (luz) gene, which is specifically expressed in H460-Luc cells, providing standardized comparisons across samples (n≥3). (c) ELISA quantification of CCL19 expression (pg/mg tissue) in tumor tissues. On days 7, 10, and 16, tumor tissues were harvested and lysed, and hCCL19 concentration in lysate was measured (n=3). (d) Tumor region annotation in orthotopic lung cancer models. H&E-stained sections (left panels) were digitized using a Pannoramic MIDI slide scanner. Whole-slide images were analyzed with HALO digital pathology suite, with tumor regions (yellow) and non-neoplastic parenchyma (light blue) annotated (right panels). Scale bars: 1 mm. (e) Quantification of tumor burden (n=5). The relative tumor area, defined as the percentage of tumor cells relative to total cells (tumor cell count/total cell count×100%), was calculated for each tissue section using HALO digital pathology software. All values are presented as individual data points (gray) with mean±SD (bars) and analyzed by one-way ANOVA followed by Fisher’s LSD test. *p<0.05, **p<0.01, ***p<0.001, ****p<0.0001, ns=not significant. Top curly bracket indicates multiple comparisons; overlines denote pairwise comparisons; ANOVA, analysis of variance; LSD test, least significant difference test; n, biological replicates; PBS, phosphate buffered saline; rNDV19, recombinant Newcastle disease virus expressing human CCL19; iNDV, Newcastle disease virus Italien strain.
Figure 3
Figure 3. rNDV19 promoted infiltration of CAR T cells in vivo. (a) CAR T cells residency in tumor tissues assessed via CAR transcript quantification. The mRNA levels of CAR genes were quantified by digital PCR and normalized to the luz gene, which is specifically expressed in H460-Luc cells, enabling standardized cross-sample comparisons (n=5). (b) Flow cytometry analysis of tumor-infiltrating lymphocytes. CAR T cells were prelabeled with Dil dye and administered to mice. Tumor-bearing lung tissues were harvested on day 16, digested into single-cell suspensions, and subjected to flow cytometry to analyze the proportion of lymphocytes within the tumor tissue cellular composition (n=4). (c) IHC staining and infiltration analysis of CAR T cells in tumor tissues. hCD3 IHC staining (brown) shows hCD3+T cells infiltration in tumor tissues. Nuclei were counterstained with hematoxylin (blue) (left panel); infiltration analysis of hCD3+T cells in tumor tissues. Tumor margins (green lines) were manually annotated, and hCD3+cells/tumor cells were quantified using HALO software with pretrained models (right panel). (d) hCD3+T cell quantification in tumor tissues. In tumor tissues, hCD3+T cells and tumor cells were annotated and counted on whole-tissue sections using HALO software with pretrained models. The percentage of hCD3+cells within the tumor area was quantified (n=5). (e) Spatial distribution of tumor-infiltrating CAR T cells. Infiltration distances from hCD3+ T cells to the tumor margin were analyzed using the HALO spatial analysis module. Lower values indicate closer proximity to the tumor core, and negative values reflect intratumoral localization. Each data point represents the mean infiltration distance per tumor lesion in individual mice (n=5). (f) Proportional analysis of CD3+ T cell infiltration levels across treatment groups. hCD3+T cells were stratified into subgroups based on infiltration distance to the tumor margin (−300 μm to 100 µm). Data are presented as individual data points (gray) with mean±SD (bars) and analyzed using one-way ANOVA followed by Fisher’s LSD test (a, b, d, e), or χ2 test followed by pairwise χ2 tests (f). *p<0.05, **p<0.01, ***p<0.001, ****p<0.0001, ns=not significant. Top curly bracket indicates multiple comparisons; overlines denote pairwise comparisons. rNDV19, recombinant Newcastle disease virus expressing human CCL19; iNDV, Newcastle disease virus Italien strain; PBS, phosphate buffered saline; ANOVA, analysis of variance; IHC, immunohistochemical; LSD test, least significant difference test; n, biological replicates; .
Figure 4
Figure 4. Combination of rNDV19 and CAR T cells boosted transcriptomic characteristics of antitumor immune response. (a) Volcano plot showing differentially expressed genes (DEGs, FDR<0.05, |Log₂FC|>1) between treatment groups. On day 10, the number of DEGs for CARTon, iNDV+CARTon, and rNDV19+CARTon was 168, 120, and 359, respectively. On day 16, the number of DEGs for CARTon, iNDV+CARTon, and rNDV19+CARTon was 250, 234, and 586, respectively. Red points: upregulated genes; Green points: downregulated genes. (b) Venn diagrams (left) depict the overlap of DEGs between treatment groups. Day 10: 88.78% (87/98) of DEGs in the iNDV+CARTon group overlapped with CARTon, while 31.84% (114/358) overlapped with rNDV19+CARTon. Day 16: Overlap proportions were 78.21% (183/234) and 38.57% (226/586), respectively. Gene Ontology analysis (middle) of unique upregulated DEGs in rNDV19+CARTon revealed enrichment in immune-related biological processes. The top eight enriched GO terms are displayed (right). (c) Heatmap of tumor microenvironment composition by xCell analysis (http://xCell.ucsf.edu/). Enrichment scores for 64 immune and stromal cell subsets are shown, with color intensity scaled to adjusted immune scores (Benjamini-Hochberg FDR<0.05). DC, dendritic cell; rNDV19, recombinant Newcastle disease virus expressing human CCL19; iNDV, Newcastle disease virus Italien strain; FDR, false discovery rate; GO, Gene Ontology; BP, biological processes; PBS, phosphate buffered saline.
Figure 5
Figure 5. rNDV19 elevated cytokine and cytotoxic effector levels through combination with CAR T cell therapy. (a) Quantification of proinflammatory cytokine (human IL-2, IL-6, IFN-γ, and TNF-α) mRNA levels. The mRNA levels were quantified by dPCR and normalized to the luz gene, which is specifically expressed in H460-Luc cells, providing a standardized comparison across samples (n=5). (b) Cytometric bead array analysis of 13 human CD8+T cell activation-related proteins in tumor tissue on day 16. The heatmap visualizes Log2FC in protein concentrations of treatment groups relative to PBS control (treatment/PBS control), clustered via complete-linkage hierarchical clustering with Euclidean distance metric. The color gradient spans from −2.5 (cyan; downregulation) to +2.5 (red; upregulation). (c) Expression profiles of the 13 human CD8+T cell activation-related proteins in tumor tissue based on hierarchical clustering results (n=5). (d) Serum concentrations of human perforin, IL-6, and IFN-γ on Day 16. Cytometric bead array analysis of 13 human T cell-related proteins in serum was performed (n=5). Perforin, IL-6, and IFN-γ were detected in the samples, whereas the other 10 analytes (of 13 tested) showed concentrations below the limit of detection. Data are presented as individual data points (gray) with mean±SD (bars) and analyzed by one-way ANOVA followed by Fisher’s LSD test. *p<0.05, **p<0.01, ***p<0.001, ****p<0.0001, ns=not significant. Top curly bracket indicates multiple comparisons; overlines denote pairwise comparisons. rNDV19, recombinant Newcastle disease virus expressing human CCL19; iNDV, Newcastle disease virus Italien strain; PBS, phosphate buffered saline; Log2FC, Log2-transformed fold changes; ANOVA, analysis of variance; LSD test, least significant difference test; n, biological replicates.
Figure 6
Figure 6. Combination therapy of rNDV19 and CAR T cells prolonged survival in tumor-bearing mice. (a) Kaplan-Meier survival curves illustrating survival dynamics across treatment groups, with shaded regions indicating 95% CIs. Dashed lines represent median survival times (days). Statistical comparison was performed using the log-rank test. (b) Forest plot displaying HRs with 95% CIs for overall survival using the Cox proportional hazards model. The reference line at HR=1 indicates no therapeutic effect compared with PBS control. Circles represent point estimates of HRs; horizontal lines denote 95% CIs. (c) Longitudinal monitoring of orthotopic tumor burden by firefly luciferase bioluminescence. Pseudo-color images showed tumor bioluminescence intensities on days 1, 8, and 15 (n=6). Scale bar: bioluminescence intensity from 450 to 4500). (d) The bioluminescence intensity measured over time, demonstrating tumor growth. Red crosses indicate that all mice in the group reached the study endpoint (n=6). (e) Longitudinal monitoring of body weight changes across groups, serving as an indicator of systemic health (n=6). Data are presented as individual data points (gray) with mean±SD (bars) and analyzed by mixed-effects model with Geisser-Greenhouse correction, and Fisher’s LSD test for pairwise comparison. *p<0.05, **p<0.01, ***p<0.001, ****p<0.0001, ns=not significant. The top curly bracket indicates multiple comparisons. ANOVA, analysis of variance; LSD test, least significant difference test; n, biological replicates; rNDV19, recombinant Newcastle disease virus expressing human CCL19; iNDV, Newcastle disease virus Italien strain.

References

    1. Peng L, Sferruzza G, Yang L, et al. CAR-T and CAR-NK as cellular cancer immunotherapy for solid tumors. Cell Mol Immunol. 2024;21:1089–108. doi: 10.1038/s41423-024-01207-0. - DOI - PMC - PubMed
    1. Kirtane K, Elmariah H, Chung CH, et al. Adoptive cellular therapy in solid tumor malignancies: review of the literature and challenges ahead. J Immunother Cancer. 2021;9:e002723. doi: 10.1136/jitc-2021-002723. - DOI - PMC - PubMed
    1. FDA approves new car t-cell therapy for all. [15-Nov-2024]. https://www.aabb.org/news-resources/news/article/2024/11/12/fda-approves... Available. Accessed.
    1. Blud D, Rubio-Reyes P, Perret R, et al. Tuning CAR T-cell therapies for efficacy and reduced toxicity. Semin Hematol. 2024;61:333–44. doi: 10.1053/j.seminhematol.2024.07.003. - DOI - PubMed
    1. Uslu U, June CH. Beyond the blood: expanding CAR T cell therapy to solid tumors. Nat Biotechnol. 2025;43:506–15. doi: 10.1038/s41587-024-02446-2. - DOI - PubMed

Substances

LinkOut - more resources