Differential photosynthetic responses to drought stress in peanut varieties: insights from transcriptome profiling and JIP-Test analysis
- PMID: 40713488
- PMCID: PMC12291314
- DOI: 10.1186/s12870-025-06984-y
Differential photosynthetic responses to drought stress in peanut varieties: insights from transcriptome profiling and JIP-Test analysis
Abstract
Background: Drought stress poses a critical constraint to plant growth by impairing photosynthetic efficiency in crops.
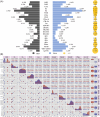
Results: Through transcriptome profiling of two peanut cultivars with contrasting drought tolerance, Fuhua18 (drought-sensitive, FH18) and Nonghua5 (drought-tolerant, NH5), we identified significant enrichment of differentially expressed genes in photosynthesis-related pathways. Notably, these genes were predominantly downregulated in FH18. Subsequent physiological analysis revealed cultivar-specific responses: Chlorophyll content decreased in FH18 but increased in NH5 after 24 h of drought treatment, accompanied by significant reductions in net photosynthetic rate (Pn) and water use efficiency (WUE) in both cultivars. The drought-induced physiological perturbations were further evidenced by elevated electrolyte leakage and activated antioxidant systems. To dissect photosynthetic apparatus dynamics, we implemented JIP-test analysis of chlorophyll fluorescence kinetics. Both cultivars exhibited substantial increases in Vj and Vi parameters at 24 h, while FH18 demonstrated a pronounced elevation in Vk during the O-J phase transition, suggesting severe impairment of the oxygen-evolving complex. Quantitative evaluation of photosynthetic performance indices revealed marked declines in PIabs and PItotal, indicating systemic damage to both PSI and PSII under drought stress. Comparative analysis identified 11 traits showing significant inter-cultivar variation, particularly in PSII reaction center parameters including PIabs, DI0/RC, RE0/RC, ABS/RC, and TR0/RC.
Conclusion: These findings provide mechanistic insights into cultivar-dependent photosynthetic responses to drought stress, offering potential biomarkers for breeding drought-resilient peanut varieties.
Keywords: Drought stress; JIP-test; PSII performance; Peanut; Photosynthesis.
© 2025. The Author(s).
Conflict of interest statement
Declarations. Ethics approval and consent to participate: The varieties in the current research are not threatened species. The authors declare that we comply with the IUCN Policy Statement on Research Involving Species at Risk of Extinction. Experimental research and field studies on plants comply with relevant institutional, national, and international guidelines and legislation. Consent for publication: Not applicable. Competing interests: The authors declare no competing interests.
Figures


Similar articles
-
Photosynthetic responses to light levels in drought-tolerant novel peanut (Arachis hypogaea L) genotypes.Sci Rep. 2025 Jul 11;15(1):25032. doi: 10.1038/s41598-025-10978-z. Sci Rep. 2025. PMID: 40646139 Free PMC article.
-
Physiological and molecular responses of bread wheat and its wild relative species to drought stress.Mol Biol Rep. 2025 Jun 27;52(1):645. doi: 10.1007/s11033-025-10742-6. Mol Biol Rep. 2025. PMID: 40576751
-
Metformin as a novel organic foliar bio-stimulant to enhance peanut (Arachis hypogaea L.) growth and yield under drought stress conditions.BMC Plant Biol. 2025 Jul 17;25(1):918. doi: 10.1186/s12870-025-06925-9. BMC Plant Biol. 2025. PMID: 40676513 Free PMC article.
-
Integrated Analysis of Physiological Responses and Transcriptome of Cotton Seedlings Under Drought Stress.Int J Mol Sci. 2025 Aug 13;26(16):7824. doi: 10.3390/ijms26167824. Int J Mol Sci. 2025. PMID: 40869143
-
A systematic review on the implications of concurrent heat and drought stress in modulating floral development in plants.Plant Sci. 2024 Dec;349:112248. doi: 10.1016/j.plantsci.2024.112248. Epub 2024 Sep 11. Plant Sci. 2024. PMID: 39265654
References
-
- Dietz K-J, Zörb C, Geilfus C-M. Drought and crop yield. Plant Biol. 2021;23:881–93. - PubMed
-
- Razi K, Muneer S. Drought stress-induced physiological mechanisms, signaling pathways and molecular response of chloroplasts in common vegetable crops. Crit Rev Biotechnol. 2021;41:669–91. - PubMed
-
- Didaran F, Kordrostami M, Ghasemi-Soloklui AA, Pashkovskiy P, Kreslavski V, Kuznetsov V, et al. The mechanisms of photoinhibition and repair in plants under high light conditions and interplay with abiotic stressors. J Photochem Photobiol B. 2024;259:113004. - PubMed
MeSH terms
Substances
Grants and funding
LinkOut - more resources
Full Text Sources
Research Materials
Miscellaneous

