Study on the dynamics of fruits color related genes and metabolites during the fruit development of Zanthoxylum bungeanum 'Hanyuan'
- PMID: 40713503
- PMCID: PMC12297842
- DOI: 10.1186/s12870-025-06962-4
Study on the dynamics of fruits color related genes and metabolites during the fruit development of Zanthoxylum bungeanum 'Hanyuan'
Abstract
Background: Anthocyanins play a crucial role in determining the coloration of plant fruits and are essential for enhancing their economic traits. However, studies on anthocyanin biosynthesis in Zanthoxylum bungeanum 'Hanyuan' fruit have yet to be reported.
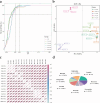
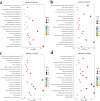
Results: In this study, the patterns of anthocyanin synthesis in fruit through phenotypic analysis and total anthocyanin measurements across 13 development stages were traced. The results indicated that the pericarp of Z. bungeanum 'Hanyuan' exhibited a gradual transition in color from light red to dark red between 64 d AF and 100 d AF, with the highest total anthocyanin content recorded at 64 d AF. Based on this conclusion, five key stages were selected for the transcriptome and anthocyanin-targeted metabolome analysis to further elucidate the molecular mechanisms underlying anthocyanin synthesis. Metabolomic analysis identified eight metabolites that influence the formation of red color in fruit: Cyanidin-3-O-rutinoside, cyanidin-3-O-xyloside, naringenin, peonidin-3-O-rutinoside, cyanidin-3-O-(6-O-malonyl-beta-D-glucoside), petunidin-3-O-sambubioside, petunidin-3-O-(6-O-p-coumaroyl)-glucoside, and delphinidin-3-O-(6-O-malonyl-beta-D-glucoside). These metabolites exhibited the highest concentrations at 64 d AF, 86 d AF, and 100 d AF. Transcriptome analysis, WGCNA analysis, and correlation analysis indicate that ZbFLS11 and ZbCYP98A32 positively regulate the biosynthesis of cyanidin-3-O-xyloside, petunidin-3-O-(6-O-p-coumaroyl) glucoside, and petunidin-3-O-sambubioside. Zb4CL1 exhibits a positive correlation with petunidin-3-O-(6-O-p-coumaroyl)-glucoside and naringenin. Additionally, the upregulation of five genes (ZbCHS1, ZbCHS2, ZbCHS3, ZbCHS4, and ZbCHS5), ZbC4H2, and ZbC4H3 expressions at 64 d AF and 86 d AF was associated with the accumulation of delphinidin-3-O-(6-O-malonyl-beta-D-glucoside) during the development stages of Z. bungeanum 'Hanyuan' fruit. Furthermore, it was found that MYB113 interact with the structural genes Zb4CL1, ZbCYP98A32, and ZbFLS11, thereby regulating the biosynthesis of petunidin-3-O-(6-O-p-coumaroyl)-glucoside. Additionally, bHLH6 exhibits a positive regulatory relationship with the five genes (ZbCHS1, ZbCHS2, ZbCHS3, ZbCHS4, and ZbCHS5), ZbC4H2, and ZbC4H3, which influence the biosynthesis of delphinidin-3-O-(6-O-malonyl-beta-D-glucoside).
Conclusion: In summary, the findings of this study elucidate the molecular mechanisms underlying color development in Z. bungeanum 'Hanyuan' fruit across various development stages. This research offers valuable insights for future investigations into the intricate molecular network governing anthocyanin biosynthesis in Z. bungeanum 'Hanyuan' fruit.
Keywords: Zanthoxylum bungeanum ‘Hanyuan’; Anthocyanin; Metabolomic; Transcription factors; Transcriptomic; Weighted gene co-expression network analysis.
© 2025. The Author(s).
Conflict of interest statement
Declarations. Ethics approval and consent to participate: Not applicable. Consent for publication: Not applicable. Competing interests: The authors declare no competing interests.
Figures


Similar articles
-
Anthocyanin and chlorophyll accumulation by targeted metabolomic and transcriptomic analysis involved in pigment accumulation during fruit maturation in Liriope spicata.J Plant Physiol. 2025 Aug;311:154529. doi: 10.1016/j.jplph.2025.154529. Epub 2025 May 24. J Plant Physiol. 2025. PMID: 40472438
-
Metabolome and transcriptome profiling reveals light-induced anthocyanin biosynthesis and anthocyanin-related key transcription factors in Yam (Dioscorea Alata L.).BMC Plant Biol. 2025 May 30;25(1):729. doi: 10.1186/s12870-025-06738-w. BMC Plant Biol. 2025. PMID: 40442608 Free PMC article.
-
Comparative Omics Analysis of Four Grape Varieties and Exploration of Their Anthocyanin Synthesis Mechanisms.Genes (Basel). 2025 Aug 13;16(8):955. doi: 10.3390/genes16080955. Genes (Basel). 2025. PMID: 40870003 Free PMC article.
-
Intravenous magnesium sulphate and sotalol for prevention of atrial fibrillation after coronary artery bypass surgery: a systematic review and economic evaluation.Health Technol Assess. 2008 Jun;12(28):iii-iv, ix-95. doi: 10.3310/hta12280. Health Technol Assess. 2008. PMID: 18547499
-
Home treatment for mental health problems: a systematic review.Health Technol Assess. 2001;5(15):1-139. doi: 10.3310/hta5150. Health Technol Assess. 2001. PMID: 11532236
References
-
- Wu Z, Wang W, Sun L, Wei A, Wang D. Accumulation and biosynthesis of hydroxyl-α-sanshool in varieties of Zanthoxylum bungeanum maxim. By HPLC-fingerprint and transcriptome analyses. Ind Crops Prod. 2020;145:111998.
-
- Li P, Ruan Z, Fei Z, Yan J, Tang G. Integrated transcriptome and metabolome analysis revealed that flavonoid biosynthesis May dominate the resistance of Zanthoxylum bungeanum against stem canker. J Agric Food Chem. 2021;69(22):6360–78. - PubMed
-
- Singh TP, Singh OM. Phytochemical and pharmacological profile of Zanthoxylum armatum DC. - an overview. Indian J Nat Prod Resour. 2011;2(3):275–85.
-
- Sharma V, Madaan R, Bala R, Goyal A, Sindhu RK. Pharmacodynamic and Pharmacokinetic interactions of herbs with prescribed drugs: a review. Plant Archives. 2021;21(Suppliment–1):185–98.
-
- Lei X, Cheng S, Peng H, Qin H, Zhu H, Xu M, Wang Q, Liu L, Zhang C, Zhou Q. Anti-inflammatory effect of zanthoxylum bungeanum-cake-separated moxibustion on rheumatoid arthritis rats. Afr J Trad Complement Altern Med. 2016;13(1):45.
MeSH terms
Substances
Grants and funding
- 2020YFD1000700/National Key Research and Development Program of China
- 2020YFD1000700/National Key Research and Development Program of China
- 2020YFD1000700/National Key Research and Development Program of China
- 2020YFD1000700/National Key Research and Development Program of China
- 2020YFD1000700/National Key Research and Development Program of China
- 2020YFD1000700/National Key Research and Development Program of China
- 2020YFD1000700/National Key Research and Development Program of China
- 2020YFD1000700/National Key Research and Development Program of China
- 2020YFD1000700/National Key Research and Development Program of China
- 2021YFYZ0032/Projects of Science and Technology Department of Sichuan Province
- 2021YFYZ0032/Projects of Science and Technology Department of Sichuan Province
- 2021YFYZ0032/Projects of Science and Technology Department of Sichuan Province
- 2021YFYZ0032/Projects of Science and Technology Department of Sichuan Province
- 2021YFYZ0032/Projects of Science and Technology Department of Sichuan Province
- 2021YFYZ0032/Projects of Science and Technology Department of Sichuan Province
- 2021YFYZ0032/Projects of Science and Technology Department of Sichuan Province
- 2021YFYZ0032/Projects of Science and Technology Department of Sichuan Province
- 2021YFYZ0032/Projects of Science and Technology Department of Sichuan Province
- SCCXTD-2024-23/Sichuan Chinese Prickly Ash Innovation Team Project of National Modern Agricultural Technology Systems
- SCCXTD-2024-23/Sichuan Chinese Prickly Ash Innovation Team Project of National Modern Agricultural Technology Systems
- SCCXTD-2024-23/Sichuan Chinese Prickly Ash Innovation Team Project of National Modern Agricultural Technology Systems
- SCCXTD-2024-23/Sichuan Chinese Prickly Ash Innovation Team Project of National Modern Agricultural Technology Systems
- SCCXTD-2024-23/Sichuan Chinese Prickly Ash Innovation Team Project of National Modern Agricultural Technology Systems
- SCCXTD-2024-23/Sichuan Chinese Prickly Ash Innovation Team Project of National Modern Agricultural Technology Systems
- SCCXTD-2024-23/Sichuan Chinese Prickly Ash Innovation Team Project of National Modern Agricultural Technology Systems
- SCCXTD-2024-23/Sichuan Chinese Prickly Ash Innovation Team Project of National Modern Agricultural Technology Systems
- SCCXTD-2024-23/Sichuan Chinese Prickly Ash Innovation Team Project of National Modern Agricultural Technology Systems
LinkOut - more resources
Full Text Sources

