

Spatial features of tumor-infiltrating lymphocytes in primary lesions of lung adenocarcinoma predict lymph node metastasis
- PMID: 40713757
- PMCID: PMC12297629
- DOI: 10.1186/s12967-025-06860-1
Spatial features of tumor-infiltrating lymphocytes in primary lesions of lung adenocarcinoma predict lymph node metastasis
Abstract
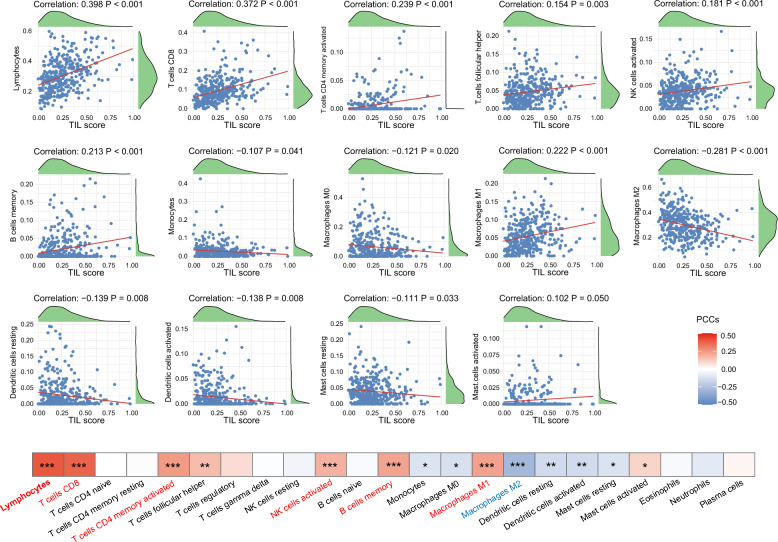
Background: Lymph node metastasis (LNM) is critical for staging, prognosis, and treatment decisions in lung adenocarcinoma (LUAD). While tumor-infiltrating lymphocytes (TILs) have demonstrated prognostic value, their role in LNM risk remains uninvestigated. This study evaluates the relationship between TIL features from primary tumor whole slide images (WSIs) and LNM in LUAD.
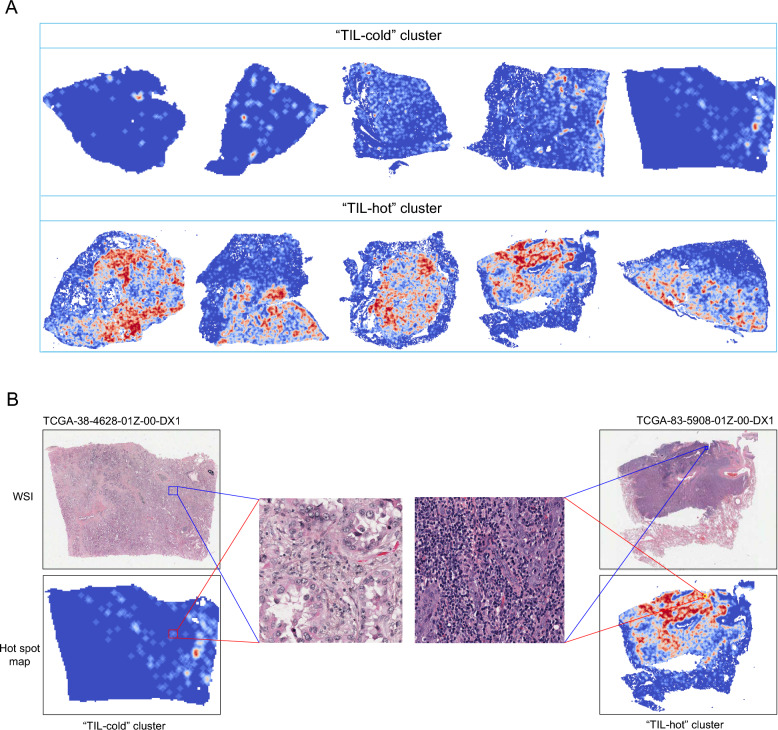
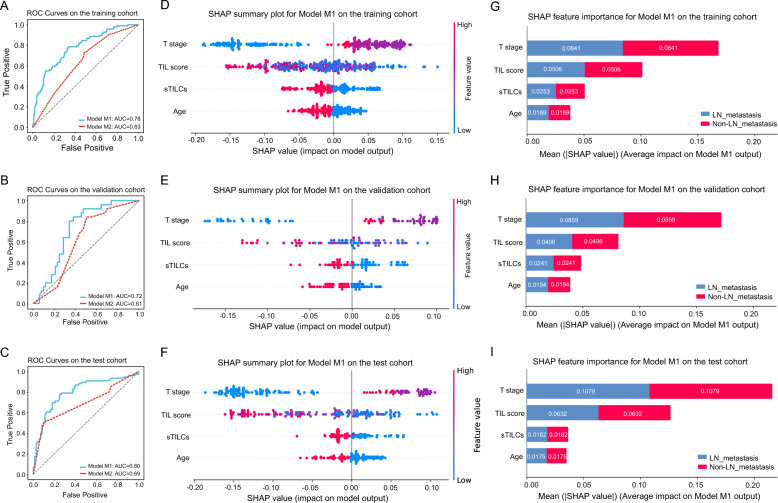
Methods: TILScout was utilized to derive patch-level TIL scores and generate global TIL maps from primary tumor WSIs. Hot spot analysis and deep learning-based feature extraction followed by K-means clustering were applied to identify and characterize spatial TIL clusters (sTILCs) from the global TIL maps. Random forest models incorporating clinical/pathological data with (M1) and without (M2) TIL features (TIL scores and sTILCs) were developed on a training cohort (N = 312) to predict LNM, and performance was compared across validation (N = 78) and independent test cohorts (N = 148).
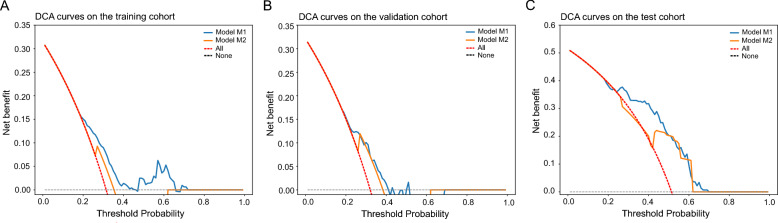
Results: Two sTILC types ("TIL-cold" cluster [sTILC1] and "TIL-hot" cluster [sTILC2]) were identified. Model M1 significantly improved LNM prediction over M2, with AUCs increasing from 0.63 to 0.78 (Z = 5.366, P < 0.001) and from 0.61 to 0.72 (Z = 1.999, P = 0.046) in the training and validation cohorts, and from 0.69 to 0.80 (Z = 3.030, P = 0.002) in the test cohort. Decision curve analysis indicated that M1 provided greater net benefit across a broad spectrum of threshold probabilities. Importantly, patients with lower TIL scores and/or classified as sTILC1 consistently had an increased risk of LNM.
Conclusions: Spatial TIL features in primary tumors are linked to LNM in LUAD, thereby enabling the identification of high-risk patients and guiding personalized treatment strategies.
Keywords: Lung adenocarcinoma; Lymph node metastasis; TILScout; Tumor-infiltrating lymphocytes; Whole slide images.
© 2025. The Author(s).
Conflict of interest statement
Declarations. Ethics approval and consent to participate: The retrospective study on the XY cohort received approval from the institutional committee of The Third Xiangya Hospital, Central South University, and informed consent was waived. Consent for publication: No applicable. Competing interests: The authors declare no conflict of interest.
Figures


Similar articles
-
The prognostic significance of desmoplastic reaction, tumor budding and tumor-infiltrating lymphocytes in esophageal squamous cell carcinomas.BMC Gastroenterol. 2025 Jul 1;25(1):476. doi: 10.1186/s12876-025-03984-y. BMC Gastroenterol. 2025. PMID: 40597640 Free PMC article.
-
Comparison of Two Modern Survival Prediction Tools, SORG-MLA and METSSS, in Patients With Symptomatic Long-bone Metastases Who Underwent Local Treatment With Surgery Followed by Radiotherapy and With Radiotherapy Alone.Clin Orthop Relat Res. 2024 Dec 1;482(12):2193-2208. doi: 10.1097/CORR.0000000000003185. Epub 2024 Jul 23. Clin Orthop Relat Res. 2024. PMID: 39051924
-
Are Current Survival Prediction Tools Useful When Treating Subsequent Skeletal-related Events From Bone Metastases?Clin Orthop Relat Res. 2024 Sep 1;482(9):1710-1721. doi: 10.1097/CORR.0000000000003030. Epub 2024 Mar 22. Clin Orthop Relat Res. 2024. PMID: 38517402
-
Cost-effectiveness of using prognostic information to select women with breast cancer for adjuvant systemic therapy.Health Technol Assess. 2006 Sep;10(34):iii-iv, ix-xi, 1-204. doi: 10.3310/hta10340. Health Technol Assess. 2006. PMID: 16959170
-
PET-CT for assessing mediastinal lymph node involvement in patients with suspected resectable non-small cell lung cancer.Cochrane Database Syst Rev. 2014 Nov 13;2014(11):CD009519. doi: 10.1002/14651858.CD009519.pub2. Cochrane Database Syst Rev. 2014. PMID: 25393718 Free PMC article.
References
-
- Bray F, Laversanne M, Sung H, Ferlay J, Siegel RL, Soerjomataram I, et al. Global cancer statistics 2022: GLOBOCAN estimates of incidence and mortality worldwide for 36 cancers in 185 countries. CA Cancer J Clin. 2024;74(3):229–63. - PubMed
-
- Zhang Y, Vaccarella S, Morgan E, Li M, Etxeberria J, Chokunonga E, et al. Global variations in lung cancer incidence by histological subtype in 2020: a population-based study. Lancet Oncol. 2023;24(11):1206–18. - PubMed
-
- Koike T, Tsuchiya R, Goya T, Sohara Y, Miyaoka E. Prognostic factors in 3315 completely resected cases of clinical stage I non-small cell lung cancer in Japan. J Thorac Oncol. 2007;2(5):408–13. - PubMed
-
- Li H, Hu H, Wang R, Li Y, Shen L, Sun Y, et al. Lung adenocarcinoma: are skip N2 metastases different from non-skip? J Thorac Cardiovasc Surg. 2015;150(4):790–5. - PubMed
-
- Osarogiagbon RU, Van Schil P, Giroux DJ, Lim E, Putora PM, Lievens Y, et al. The international association for the study of lung cancer lung cancer staging project: overview of challenges and opportunities in revising the nodal classification of lung cancer. J Thorac Oncol. 2023;18(4):410–8. - PMC - PubMed
MeSH terms
Grants and funding
LinkOut - more resources
Full Text Sources
Medical
