

Steroid dynamics in myalgic encephalomyelitis / chronic fatigue syndrome: a case-control study using ultra performance supercritical fluid chromatography tandem mass spectrometry
- PMID: 40713801
- PMCID: PMC12291238
- DOI: 10.1186/s12967-025-06841-4
Steroid dynamics in myalgic encephalomyelitis / chronic fatigue syndrome: a case-control study using ultra performance supercritical fluid chromatography tandem mass spectrometry
Abstract
Background: Myalgic encephalomyelitis / chronic fatigue syndrome (ME/CFS) is a multisystem disorder characterised by unrelenting fatigue, post-exertional malaise, and dysfunction across immune, nervous, metabolism, and endocrine systems. Given the broad role of steroid hormones in regulating these systems, this study investigated differences in the steroid metabolome and network dynamics between ME/CFS patients and matched controls.
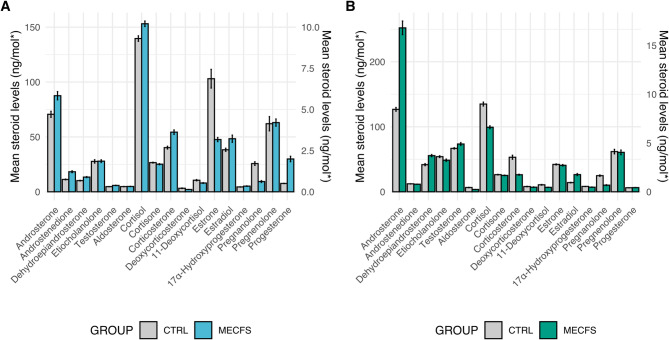
Methods: Blood plasma steroid levels were quantified using Ultra-Performance Supercritical Fluid Chromatography- Tandem Mass Spectrometry (UPSFC-MS/MS) in ME/CFS patients (n = 24) and age and gender matched controls (n = 24). Group comparisons of absolute steroid concentrations were performed using Mann-Whitney U tests. Partial Spearman correlation networks were evaluated to examine direct associations between steroids within each group, and centrality metrics were used to evaluate structural differences. Steroid-steroid ratios were analysed to reflect biochemical relationships. Multivariate analysis with Orthogonal Partial Least Squares Discriminant Analysis (OPLS-DA) was also conducted.
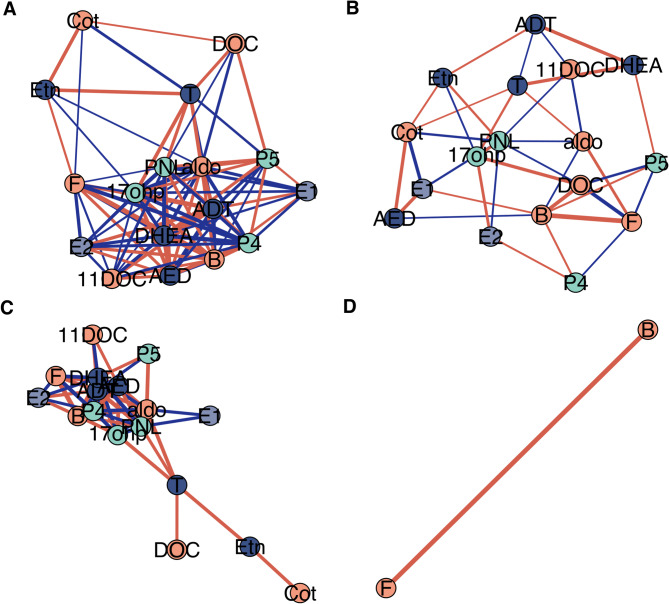
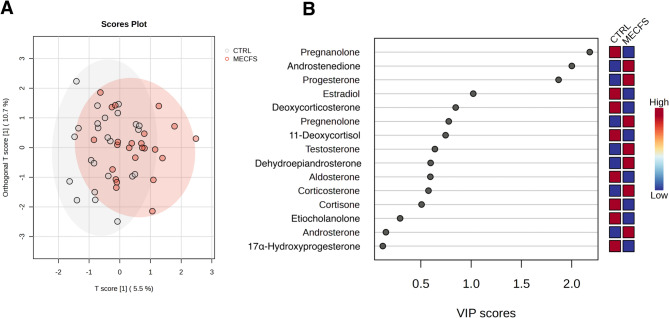
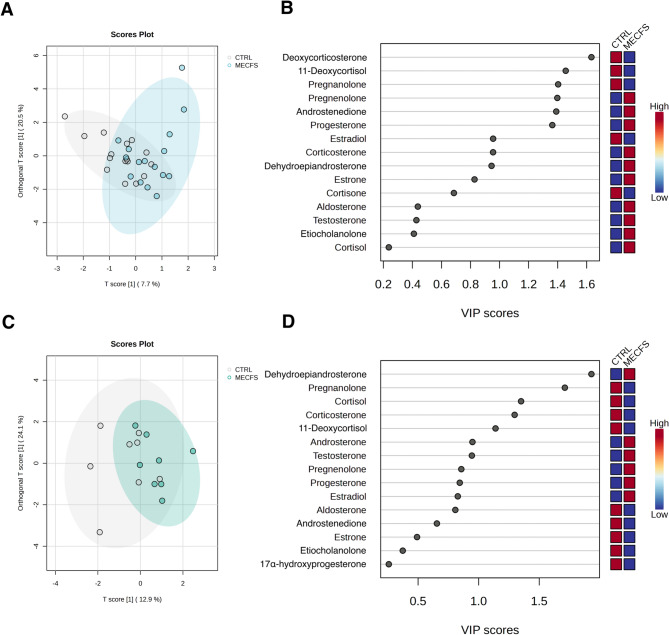
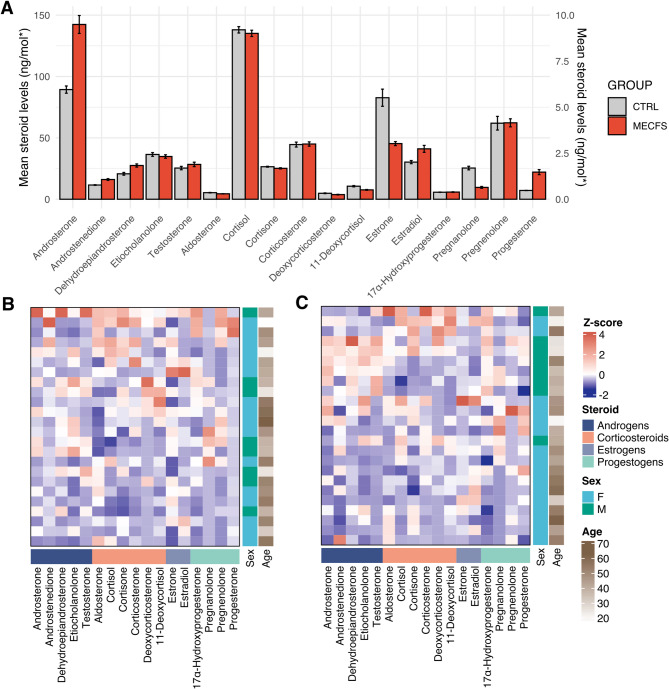
Results: No significant group differences in absolute steroid concentrations were observed following FDR correction. However, network analysis revealed a marked reduction in direct steroid-steroid relationships in ME/CFS, with controls exhibiting 52 significant partial correlations, while the ME/CFS group retained only one (cortisol - corticosterone). Centrality analysis further revealed a shift in network structure, with cortisone emerging as highly central in ME/CFS (degree = 7, betweenness = 16.7), despite being peripheral in controls, and progesterone showing reduced integration in ME/CFS (degree = 3 vs. 12, eigenvector = 0.40 vs. 0.93). Steroid-steroid ratio analysis revealed a higher cortisol-to-pregnanolone ratio and a lower pregnanolone-to-progesterone ratio in ME/CFS, although these findings did not remain significant after FDR correction. OPLS-DA indicated a modest relationship between steroid levels and group classification (R²Y = 22.8%), but negative Q² values suggested poor predictive power.
Conclusions: Despite no significant differences in absolute steroid levels, network analysis revealed profound disruptions in steroid-steroid relationships in ME/CFS compared to controls, suggesting disrupted steroid homeostasis. Collectively the results suggest dysregulation of HPA axis function and progestogen pathways, as demonstrated by altered partial correlations, centrality profiles, and steroid ratios. These findings illustrate the importance of hormone network dynamics in ME/CFS pathophysiology and underscores the need for more research into steroid metabolism.
Keywords: Chronic illness; Homeostasis; Hormone metabolism; ME/CFS; Network analysis; Neuroendocrine dysfunction; Partial correlations; Steroidomics; Ultra-performance supercritical fluid chromatography tandem mass spectrometry (UPSFC-MS/MS).
© 2025. The Author(s).
Conflict of interest statement
Declarations. Ethics approval, consent to participate and consent for publication: All study procedures were approved by the Regional Ethics Committee in Göteborg (approval number: 2016:966–15). Participants were diagnosed at the Gottfries Clinic in Göteborg, and all methods were conducted in accordance with relevant guidelines and regulations, including the Declaration of Helsinki. Written informed consent was obtained from all participants. Competing interests: The authors declare that they have no competing interests. Open Medicine Foundation, Open Medicine Foundation Australia, The Judith Jane Mason & Harold Stannett Williams Memorial Foundation (the Mason Foundation), is acknowledged for the support of the study.
Figures
References
-
- Bested AC, Marshall LM. Review of myalgic encephalomyelitis/chronic fatigue syndrome: an evidence-based approach to diagnosis and management by clinicians. Rev Environ Health. 2015;30(4):223–49. - PubMed
-
- Organization.(WHO) WH. ICD-11 for mortality and morbidity statistics:. Accessed Oct 2024.
MeSH terms
Substances
LinkOut - more resources
Full Text Sources
Medical
