. 2025 Jul 26;23(1):540.
doi: 10.1186/s12951-025-03612-7.

Extracellular vesicles from ovarian cancer cells induce senescent lipid-laden macrophages to facilitate omental metastasis

Affiliations

Extracellular vesicles from ovarian cancer cells induce senescent lipid-laden macrophages to facilitate omental metastasis

Guoqing Li et al. J Nanobiotechnology. .

Abstract

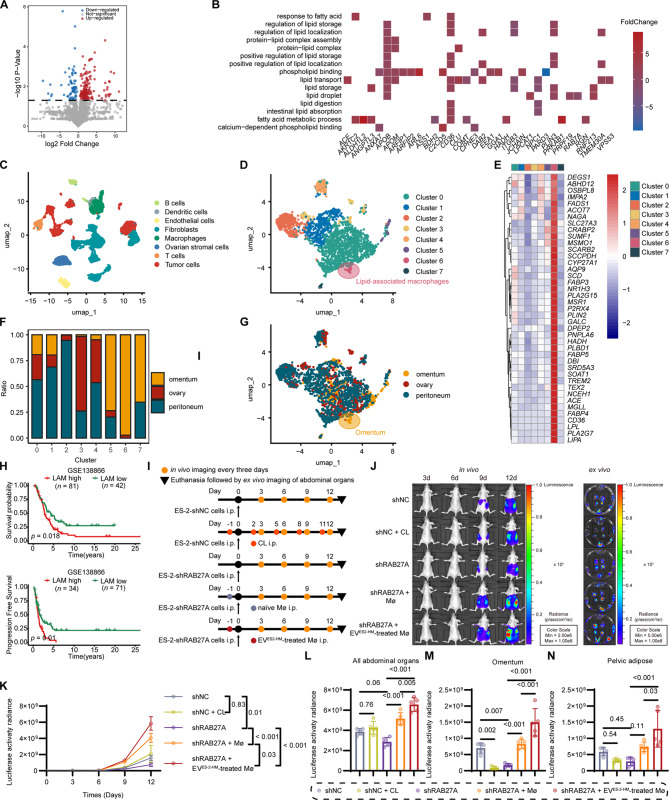
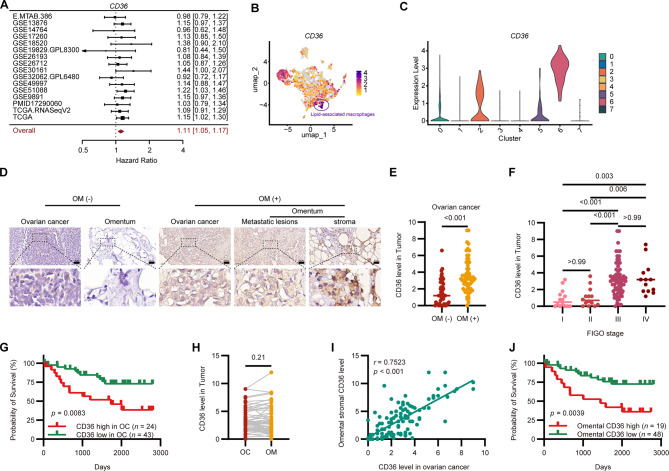
Background: Ovarian cancer exhibits striking metastatic tropism for the omentum, where lipid-laden macrophages are key mediators that fuel disease progression. However, the mechanisms governing their formation and pro-metastatic functions remain poorly understood. As extracellular vesicles (EVs) have as critical regulators of tumor-stroma crosstalk in metastatic niches, we sought to define how ovarian cancer-derived EVs orchestrate macrophages and adipocytes, and their impact on omental metastasis, aiming to explore potential therapeutic interventions.

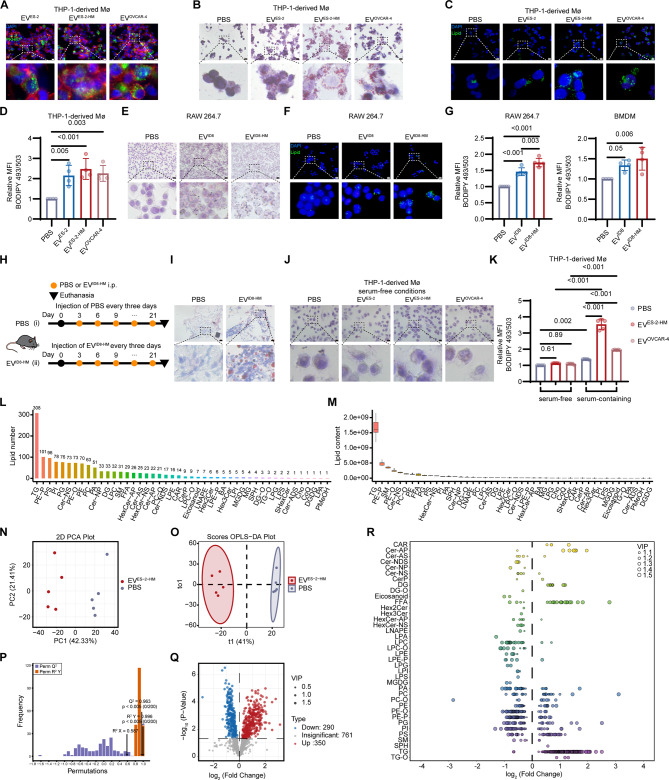
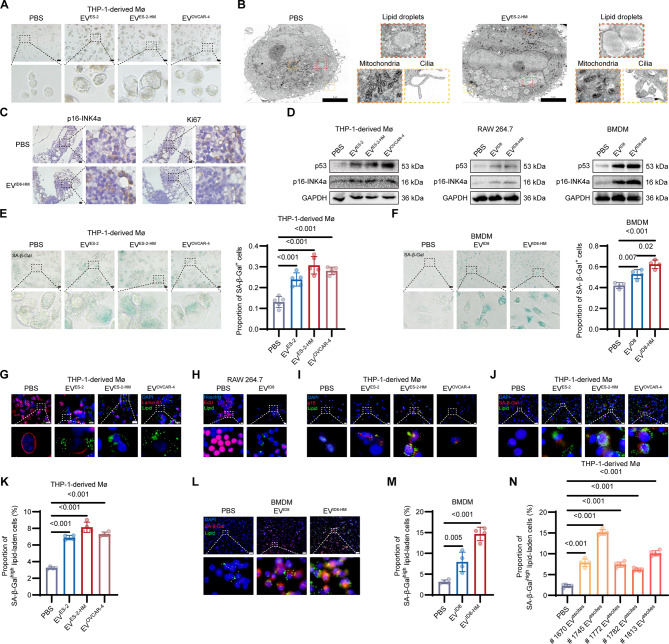
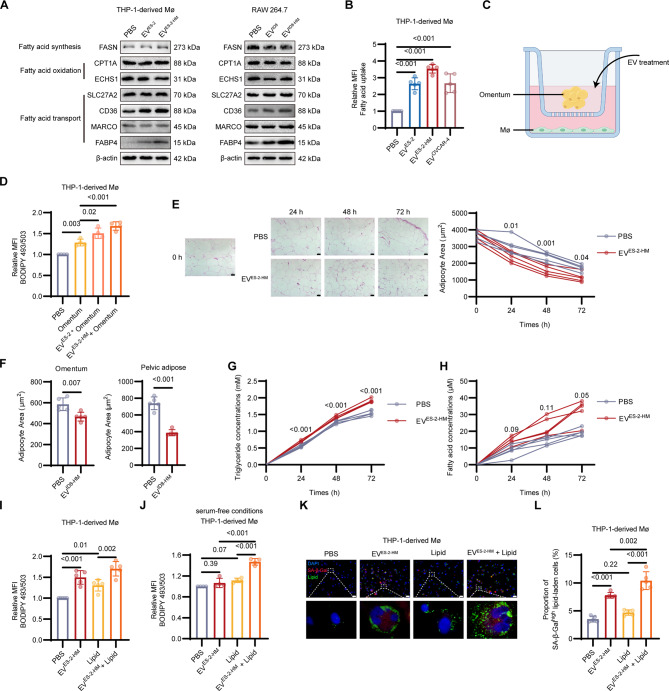
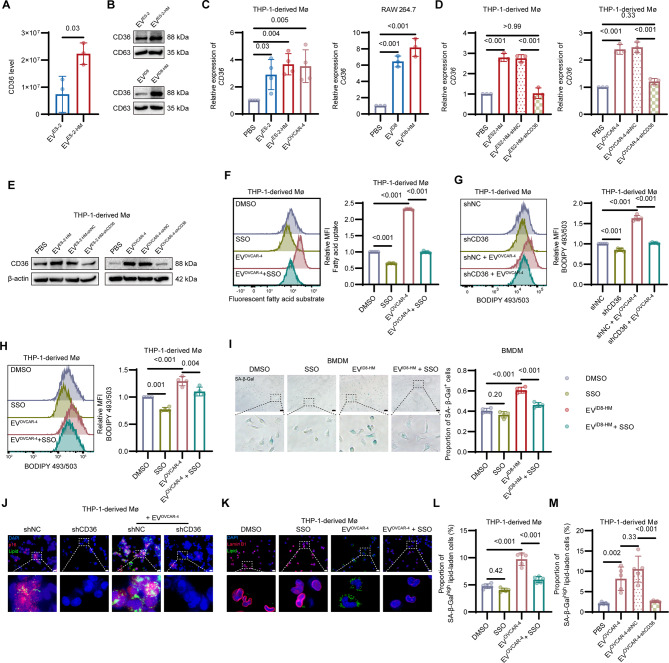
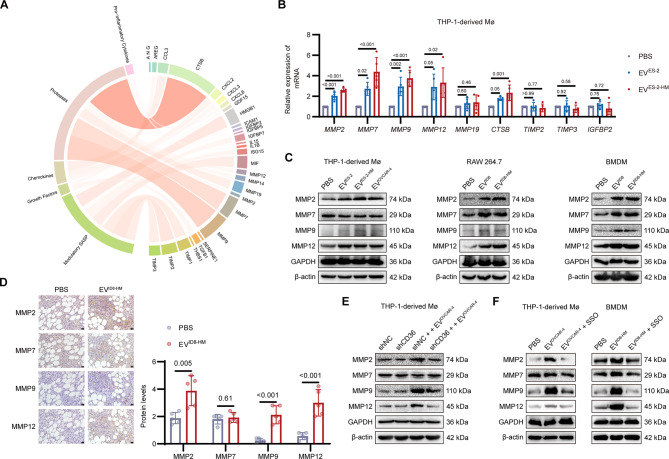
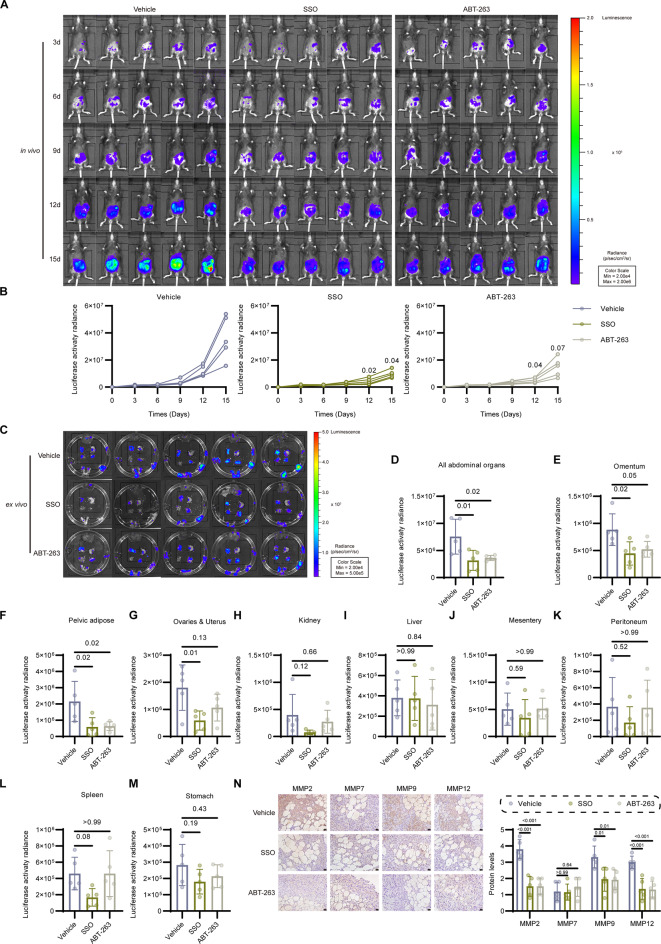
Results: Single-cell transcriptomics of ovarian cancer revealed a distinct lipid-laden macrophage population in omentum, whose abundance correlated with metastatic burden and poor survival. Proteomics revealed that EVs from highly metastatic ovarian cancer cells were enriched in lipid metabolism regulators. In vivo experiments demonstrated that these tumor-derived vesicles mediated macrophage reprogramming, driving the acquisition of a pro-metastatic phenotype. Quantitative lipidomic profiling and lipid staining approaches confirmed the progressive lipid-laden in EV-treated macrophages. Using a patient-derived omentum-macrophage co-culture system, we demonstrated that tumor-derived EVs stimulate lipid release from omental adipocytes, which macrophages subsequently internalize through CD36-dependent uptake to drive lipid accumulation. This metabolic reprogramming culminated in cellular senescence, as evidenced by classical biomarkers including SA-β-galactosidase activity, elevated p16-INK4A and p53 levels, and the development of a matrix metalloproteinase-enriched senescence-associated secretory phenotype. Immunohistochemistry of clinical specimens demonstrated overexpression of CD36 correlated with omental metastasis and poor survival in ovarian cancer. In vivo experiments demonstrated that CD36 inhibition and senolytic therapy attenuated omental metastasis.

Conclusions: This study unveils an EV-driven mechanism of adipose tropism in ovarian cancer metastasis, where EVs promote the formation of senescent lipid-laden macrophages via CD36-mediated lipid uptake, remodeling the metastatic niche. Targeting CD36 and senescent cells offers a promising therapeutic strategy against omental metastasis.


Conflict of interest statement

Declarations. Ethics approval and consent to participate: All human specimens were obtained following the Declaration of Helsinki, and all participants provided informed written consent. The procedures were conducted following ethical guidelines and obtained approval from the Medical Ethics Committee, Union Hospital, Tongji Medical College, Huazhong University of Science and Technology. Animals were handled according to the recommendation of the Regulations for the Administration of Affairs Concerning Experimental Animals of China. The procedures were approved by the Laboratory Animal Ethics Committee of Wuhan Youdu Biotechnology Ltd. Consent for publication: Not applicable. Competing interests: The authors declare no competing interests.

Figures

Fig. 1
Fig. 1
Extracellular vesicles and macrophages synergistically promote ovarian cancer metastasis. (A) Volcano plot showing the differential proteins in extracellular vesicles from ES-2-HM cells (EVES−2−HM) compared to ES-2 cells (EVES−2), identified by LC-MS/MS-based proteomic analysis. n = 3. (B) Heatmap illustrating the enrichment of lipid-related biological terms identified through GO enrichment analysis of differential proteins in EVES−2−HM compared to EVES−2 from EV proteomics, along with their corresponding protein abundances. (C) UMAP plot showing eight major cell types identified in ovarian cancer scRNA-seq data published by Olbrecht et al., comprising 18,403 cells from primary ovarian tumors, peritoneal metastases, and omental metastases of seven treatment-naïve patients. Each dot corresponds to a single cell, and colors represent distinct cell populations. (D) UMAP plot showing eight macrophage subpopulations identified through dimensionality reduction and clustering in ovarian cancer scRNA-seq data. Each dot represents a macrophage, with different colors denoting distinct subpopulations. Cluster 6, highlighted as lipid metabolism-activated, is defined as lipid-associated macrophages. (E) Heatmap showing the RNA expression levels of lipid-related molecules in eight macrophage subpopulations enriched in lipid-associated macrophages from ovarian cancer scRNA-seq data (F) Bar plot showing the percentage distribution of eight macrophage subpopulations in ovarian cancer scRNA-seq data across ovarian, omental, and peritoneal lesions. (G) UMAP plot showing the spatial distribution of macrophages in ovarian cancer scRNA-seq data, colored by anatomical location, including ovarian, omental, and peritoneal lesions. Cluster 6, representing lipid-associated macrophages, is highlighted for its enrichment in the omentum. (H) Kaplan-Meier survival curves for overall survival (top) and progression-free survival (bottom) in ovarian cancer patients with high and low abundance of lipid-associated macrophages (measured by gene set variation analysis) in the omentum. Patient stratification was performed using an optimal cutoff value determined by the surv_cutpoint algorithm, with clinical outcome data obtained from the GSE138866 dataset. Statistical significance was determined using the log-rank test. (I) Schematic diagram illustrating the experimental design, in which BALB/c nude mice were subjected to no treatment, periodic intraperitoneal injections of clodronate liposomes (CL), or a single intraperitoneal injection of THP-1-derived macrophages (Mø), followed by intraperitoneal injection of luciferase-labeled ES-2-shNC or ES-2-shRAB27A cells. Bioluminescence signals emitted by tumor cells were dynamically monitored, and after euthanasia, bioluminescence signals from all peritoneal organs were measured. n = 5. (J) Left: Representative dynamic bioluminescence images showing the bioluminescence signals emitted by the mice on days 3, 6, 9, and 12 after xenograft tumor implantation. The luminescence intensity represents the tumor burden in the mice. Right: Representative dynamic bioluminescence images showing ex vivo bioluminescence imaging of the abdominal organs after euthanasia. The images display the bioluminescence signals from various organs, including the omentum, pelvic adipose tissue, ovaries and uterus, kidneys, liver, mesentery, peritoneum, spleen, and stomach. (K) Line graph showing the bioluminescence signal intensity of the above mice at different time points. n = 5. (L) Bar plot showing the bioluminescence signal intensity of all abdominal organs in the above mice. n = 5. (MN) Bar plots showing the bioluminescence signal intensity of the omentum (M) and pelvic fat tissue (N) in the above mice. n = 5
Fig. 2
Fig. 2
Tumor-derived extracellular vesicles enhance lipid content in macrophages. (A) Representative immunofluorescence images showing macrophage uptake of extracellular vesicles (EVs) derived from ovarian cancer cells, including ES-2 (EVES−2), ES-2-HM (EVES−2−HM), and OVCAR-4 (EVOVCAR−4). EVs are labeled in green, macrophage cytoskeletons are stained in red, and nuclei are stained in blue. Scale bar: 10 μm. (B) Representative Oil Red O staining images showing lipid accumulation in THP-1-derived macrophages following incubation with tumor-derived EVs or PBS in serum-containing medium. Lipid droplets are stained red. Scale bar: 20 μm. (C) Representative BODIPY 493/503 staining images showing lipid accumulation in THP-1-derived macrophages after incubation with tumor-derived EVs or PBS in serum-containing medium. Lipid droplets are stained in green. Scale bar: 20 μm. (D) Bar plot summarizing the statistical results of flow cytometry analysis of lipid content in THP-1-derived macrophages following incubation with tumor-derived EVs or PBS in serum-containing medium. Lipid content was measured by BODIPY 493/503 staining, with the mean fluorescence intensity (MFI) reflecting lipid accumulation in macrophages. n = 4. (E) Representative Oil Red O staining images showing lipid accumulation in RAW 264.7 cells after incubation with EVs derived from ID8 (EVID8), ID8-HM (EVID8−HM) or PBS in serum-containing medium. Lipid droplets are stained red. Scale bar: 20 μm. (F) Representative BODIPY 493/503 staining images showing lipid accumulation in RAW 264.7 cells after incubation with tumor-derived EVs or PBS in serum-containing medium. Lipid droplets are stained in green. Scale bar: 20 μm. (G) Bar plots showing the statistical results of flow cytometry analysis assessing lipid content in RAW 264.7 cells (left, n = 5) and bone marrow-derived macrophages (BMDM, right, n = 4) after incubation with tumor-derived EVs or PBS in serum-containing medium. (H) Schematic diagram showing C57BL/6 N mice receiving intraperitoneal injections of PBS or EVID8−HM every 3 days for 3 weeks. After euthanasia, the omental tissues were harvested, flash-frozen, and formalin-fixed for paraffin embedding. n = 5. (I) Representative Oil Red O staining showing lipid content in the milky spots of the omentum from mice subjected to intraperitoneal injection of PBS or EVID8−HM twice a week for 3 consecutive weeks. Scale bar: 20 μm. (J) Representative Oil red O staining images showing lipid accumulation in THP-1-derived macrophages under serum-free conditions after treatment with tumor-derived EVs or PBS. Lipid droplets appear red. Scale bar: 20 μm. (K) Bar plot showing the statistical results of flow cytometry analysis of lipid content in THP-1-derived macrophages under serum-free or complete medium conditions after incubation with tumor-derived EVs or PBS. n = 5. (L) Bar plot showing the distribution of 46 distinct lipid classes identified by LC-MS/MS-based lipidomics in THP-1-derived macrophages after incubation with EVES−2−HM or PBS. n = 5. The graph displays the number of different lipid classes categorized by lipid type. (M) Bar plot showing the lipid content of 46 distinct lipid classes identified by lipidomics in THP-1-derived macrophages after incubation with EVES−2−HM or PBS. The graph illustrates the relative abundance of each lipid class. (N) Principal Component Analysis (PCA) of lipidomics data from THP-1-derived macrophages following incubation with PBS or EVES−2−HM. Each dot represents an individual sample. n = 5. (O) Orthogonal Partial Least Squares Discriminant Analysis (OPLS-DA) of lipidomics data from THP-1-derived macrophages after incubation with PBS or EVES−2−HM. Each dot represents an individual sample. n = 5. (P) Permutation test plot validating the OPLS-DA model. The x-axis represents the accuracy of the models, and the y-axis indicates the frequency of accuracy values for 200 permutation tests. The arrow highlights the accuracy of the original OPLS-DA model. (Q) Volcano plot showing differentially abundant lipids in THP-1-derived macrophages after incubation with EVES−2−HM compared to PBS. Variable importance in projection (VIP) scores, obtained from the OPLS-DA model, reflect the contribution of variables to the model’s fit and classification ability. A higher VIP score indicates greater importance in distinguishing between the groups. n = 5. (R) Scatter plot showing the relative abundance differences of 46 distinct lipid subclasses in THP-1-derived macrophages after incubation with EVES−2−HM compared to PBS
Fig. 3
Fig. 3
Tumor-derived extracellular vesicles induce senescent lipid-laden macrophages. EVs, EVES−2, EVES−2−HM, EVOVCAR−4, EVID8, EVID8−HM, and MFI are defined in Fig. 2. (A) Representative images showing the morphological changes of THP-1-derived macrophages after incubation with tumor-derived EVs or PBS. Scale bar: 50 μm. (B) Representative images of transmission electron microscopy showing the morphological changes of THP-1-derived macrophages after incubation with EVES−2−HM or PBS. Scale bar: 5 μm.(C) Representative immunohistochemistry images showing p16-INK4a and Ki67 levels in the milky spots of the omentum from mice subjected to intraperitoneal injection of PBS or EVID8−HM twice a week for 3 consecutive weeks. Scale bar: 20 μm. (D) Representative immunoblot showing the levels of cell cycle proteins associated with cellular senescence in THP-1-derived macrophages (left), RAW 264.7 cells (middle), and BMDMs (right) after incubation with tumor-derived EVs or PBS. (E) Representative image (left) and bar plot (right) showing the number of SA-β-Gal positive cells in THP-1-derived macrophages after incubation with tumor-derived EVs or PBS. Scale bar: 20 μm. n = 5. (F) Representative image (left) and bar plot (right) showing the number of SA-β-Gal positive cells in BMDM after incubation with tumor-derived EVs or PBS. Scale bar: 50 μm. n = 4. (G) Representative immunofluorescence images showing lipid and Lamin B1 levels in THP-1-derived macrophages after incubation with tumor-derived EVs or PBS, along with their co-localization. Lipids are stained in green, and Lamin B1 is stained in red. Scale bar: 20 μm. (H) Representative fluorescence images showing lipid and EdU staining in RAW 264.7 cells after incubation with tumor-derived EVs or PBS, along with their co-localization. Lipids are stained in green, and EdU is stained in red. Scale bar: 20 μm. (I) Representative immunofluorescence images showing lipid and p16-INK4a levels in THP-1-derived macrophages after incubation with tumor-derived EVs or PBS, along with their co-localization. Lipids are stained in green, and p16-INK4a is stained in red. Scale bar: 20 μm. (J) Representative fluorescence images showing lipid and SA-β-Gal activity in THP-1-derived macrophages after incubation with tumor-derived EVs or PBS, along with their co-localization. Lipids are stained in green, and SA-β-Gal is stained in red. Scale bar: 50 μm. (K) Bar plot summarizing the flow cytometry analysis of the number of SA-β-Gal high-activity, lipid-rich macrophages (senescent lipid-laden macrophages) in THP-1-derived macrophages after incubation with tumor-derived EVs or PBS. n = 4. (L) Representative fluorescence images showing lipid and SA-β-Gal activity in BMDM after incubation with tumor-derived EVs or PBS, along with their co-localization. Lipids are stained in green, and SA-β-Gal is stained in red. Scale bar: 50 μm. (M) Bar plot summarizing the flow cytometry analysis of the number of senescent lipid-laden macrophages in BMDMs after incubation with tumor-derived EVs or PBS. n = 4. (N) Bar plot summarizing the flow cytometry analysis of the number of senescent lipid-laden macrophages in THP-1-derived macrophages after incubation with ovarian cancer patient-derived ascites-derived EVs (EVascites) or PBS. n = 5
Fig. 4
Fig. 4
Tumor extracellular vesicles enhance macrophage uptake of omentum-released lipids to induce senescent lipid-laden macrophages. EVs, EVES−2, EVES−2−HM, EVOVCAR−4, EVID8, EVID8−HM, and MFI are defined in Fig. 2. (A) Representative immunoblot showing the levels of key lipid metabolism proteins in THP-1-derived macrophages (left) and RAW 264.7 cells (right) after incubation with tumor-derived EVs or PBS. The proteins include fatty acid synthesis protein FASN, fatty acid oxidation proteins CPT1A and ECHS1, and fatty acid transport proteins SLC27A2, CD36, MARCO, and FABP4. (B) Bar chart summarizing the statistical results of flow cytometry analysis of fatty acid uptake capacity in THP-1-derived macrophages after incubation with tumor-derived EVs or PBS. n = 5. (C) Schematic diagram illustrating the indirect co-culture of patient-derived omental tissue and macrophages in a Transwell system. (D) Bar plot summarizing the statistical results of flow cytometry analysis of lipid content in THP-1-derived macrophages following indirect coculture with patient-derived omentum or PBS, with or without tumor-derived EVs. n = 4. (E) Representative H&E staining images (left) and line graph (right) showing the statistical results of adipocyte size in patient-derived omentum at 24, 48, and 72 h after incubation with PBS or EVES−2−HM. Scale bar: 50 μm. n = 5. (F) Bar plots showing the statistical results of adipocyte size in mouse omentum (left) and pelvic adipose tissues (right) after intraperitoneal injection of PBS or EVID8−HM twice a week for 3 weeks, as assessed by H&E staining. n = 5. (G) Line graph showing the statistical results of triglyceride concentration released from patient-derived omentum after incubation with PBS or EVES−2−HM in serum-free medium for 24, 48, and 72 h. n = 5. (H) Line graph showing the statistical results of free fatty acid concentration released from patient-derived omentum after incubation with PBS or EVES−2−HM in serum-free medium for 24, 48, and 72 h. n = 5. (I) Bar plots showing the statistical results of flow cytometry analysis assessing lipid content in THP-1-derived macrophages after coincubating with omentum-derived lipids or PBS, with or without tumor-derived EVs, in a complete medium. n = 5. (J) Bar plots showing the statistical results of flow cytometry analysis assessing lipid content in THP-1-derived macrophages after coincubating with omentum-derived lipids or PBS, with or without tumor-derived EVs, in serum-free medium. n = 4. (K) Representative fluorescence images showing lipid content and SA-β-Gal activity in THP-1-derived macrophages after incubation with omentum-derived lipids or PBS (with or without tumor-derived EVs), along with their co-localization. Scale bar: 50 μm. (L) Bar plot summarizing the flow cytometry analysis of the number of senescent lipid-laden macrophages in THP-1-derived macrophages after incubation with omentum-derived lipids or PBS, with or without tumor-derived EVs. n = 5
Fig. 5
Fig. 5
CD36 levels in ovarian cancer and omentum correlate with omental metastasis and poor prognosis. (A) Forest plot showing the meta-analysis of the effect of CD36 on ovarian cancer survival. (B) UMAP plot showing the expression of CD36 in macrophages from ovarian cancer scRNA-seq data. Cluster 6, representing lipid-associated macrophages, is highlighted to indicate high CD36 expression. (C) Violin plot showing the differential expression of CD36 across eight macrophage subpopulations in ovarian cancer scRNA-seq data. (D) Representative images of CD36 immunohistochemistry staining in ovarian cancer and omentum in omental metastasis (OM) negative and positive cases. Scale bar: 50 μm. (E) Scatter plot showing the difference in CD36 levels between ovarian cancer with omental metastasis positive (n = 63) and negative (n = 52) cases. (F) Scatter plot showing the difference in CD36 levels in ovarian cancer cases at different FIGO stages. (G) Kaplan-Meier survival curve showing overall survival in ovarian cancer patients with high (n = 24) and low (n = 43) CD36 levels, stratified by the optimal cutoff determined using the surv_cutpoint function. Statistical significance was assessed using the log-rank test. (H) Scatter plot showing the difference in CD36 levels between paired ovarian cancer and omental metastatic lesions in omental metastasis cases. n = 63. (I) Scatter plot and correlation analysis showing the relationship between CD36 levels in ovarian cancer and CD36 levels in the omental stroma. n = 115. (J) Kaplan-Meier survival curve showing overall survival in ovarian cancer patients with high (n = 19) and low (n = 48) omental stromal CD36 levels, stratified by the optimal cutoff determined using the surv_cutpoint function. Statistical significance was assessed using the log-rank test
Fig. 6
Fig. 6
Tumor-derived extracellular vesicles induce SnLLM formation via CD36. EVs, EVES−2, EVES−2−HM, EVOVCAR−4, EVID8, EVID8−HM, and MFI are defined in Fig. 2. (A) Bar plot summarizing the CD36 levels measured in EV proteomics for EVES−2 and EVES−2−HM. n = 3. (B) Representative immunoblot showing CD36 levels in EVES−2, EVES−2−HM, EVID8, and EVID8−HM. (C) Bar plots summarizing the expression of CD36 in THP-1-derived macrophages (left, n = 4) and Cd36 in RAW 264.7 cells (right, n = 3) after incubation with tumor-derived EVs or PBS, as measured by qRT-PCR. (D) Bar plots summarizing the expression of CD36 and Cd36 in THP-1-derived macrophages (left) and RAW 264.7 cells (right), respectively, after co-incubation with tumor-derived EVs, EVs from tumor cells with CD36 knockdown (shCD36), or PBS. n = 3. (E) Representative immunoblot showing CD36 protein levels in THP-1-derived macrophages after co-incubation with tumor-derived EVs, EVs from tumor cells with CD36 knockdown (shCD36), or PBS. (F) Representative flow cytometry ridge plot (left) and bar plot (right) showing the fatty acid uptake capacity in THP-1-derived macrophages after incubation with tumor-derived EVs, with or without sulfosuccinimidyl oleate sodium (SSO) treatment. n = 5. (G) Representative flow cytometry ridge plot (left) and bar plot (right) showing the lipid content in CD36 knockdown THP-1-derived macrophages after incubation with tumor-derived EVs. n = 5. (H) Representative flow cytometry ridge plot (left) and bar plot (right) showing the lipid content in THP-1-derived macrophages after incubation with tumor-derived EVs, with or without SSO treatment. n = 4. (I) Representative images (left) and bar plot (right) showing the number of SA-β-Gal positive cells in BMDM after incubation with tumor-derived EVs, with or without SSO treatment. Scale bar: 50 μm. n = 4. (J) Representative immunofluorescence images showing lipid and p16-INK4a levels in CD36 knockdown THP-1-derived macrophages after incubation with tumor-derived EVs, along with their co-localization. Lipids are stained green, and p16-INK4a is stained red. Scale bar: 20 μm. (K) Representative immunofluorescence images showing lipid and Lamin B1 levels in THP-1-derived macrophages after incubation with tumor-derived EVs, with or without SSO treatment, along with their co-localization. Lipids are stained green, and Lamin B1 is stained red. Scale bar: 20 μm. (L) Bar plot summarizing the flow cytometry analysis of the number of senescent lipid-laden macrophages in THP-1-derived macrophages after incubation with tumor-derived EVs, with or without SSO treatment. n = 5. (M) Bar plot summarizing the flow cytometry analysis of the number of senescent lipid-laden macrophages after co-incubation of THP-1-derived macrophages with tumor-derived EVs, CD36-knockdown tumor cell-derived EVs (shCD36), or PBS. n = 5
Fig. 7
Fig. 7
Tumor-derived extracellular vesicles enhance matrix-degrading SASP in macrophages. EVs, EVES−2, EVES−2−HM, EVOVCAR−4, EVID8, and EVID8−HM, are defined in Fig. 2. (A) Chord diagram showing the expression pattern of SASPs in lipid-associated macrophages from ovarian cancer scRNA-seq data. The color intensity represents the gene expression. (B) Bar plot showing the expression of various extracellular matrix-degrading SASPs in THP-1-derived macrophages after incubation with tumor-derived EVs or PBS, as measured by qRT-PCR. n = 5. (C) Representative immunoblot showing the protein levels of MMP2, MMP7, MMP9, and MMP12 in THP-1-derived macrophages (left), RAW 264.7 cells (middle), and BMDM (right) after incubation with tumor-derived EVs or PBS. (D) Representative immunohistochemical images (left) and bar plot quantifications (right) showing the levels of MMP2, MMP7, MMP9, and MMP12 in the omentum of mice after intraperitoneal injection of PBS or EVID8−HM twice a week for 3 consecutive weeks. Scale bar: 20 μm. n = 5. (E) Representative immunoblot showing the protein levels of MMP2, MMP7, MMP9, and MMP12 in CD36 knockdown THP-1-derived macrophages after incubation with tumor-derived EVs. (F) Representative immunoblot showing the protein levels of MMP2, MMP7, MMP9, and MMP12 in THP-1-derived macrophages (left) and BMDM (right) after incubation with tumor-derived EVs or PBS, with or without SSO treatment
Fig. 8
Fig. 8
CD36 blockade and ABT-263 senolytics suppress omental metastasis in ovarian cancer. (A) Dynamic bioluminescent imaging of C57BL/6 N mice injected intraperitoneally with luciferase-labeled ID8-HM cells, followed by continuous treatment with Vehicle, SSO, or ABT-263. Bioluminescence signals emitted over a specified period were monitored to assess tumor growth and spread in vivo under different treatment conditions. n = 5. (B) Line graphs showing the bioluminescence signal intensity over time in mice above mentioned. n = 5. (C) Ex vivo bioluminescent imaging of abdominal organs from the above mice at the observation endpoint after euthanasia. The images show the bioluminescence signals in various organs, including the omentum, pelvic adipose tissues, ovaries & uterus, kidney, liver, mesentery, peritoneum, spleen, and stomach. (D) Bar plot showing the bioluminescence signal intensity in all abdominal organs from the above mice after treatment with Vehicle, SSO, or ABT-263. n = 5. (E-M) Bar plots showing the bioluminescence signal intensity in omentum (E), pelvic adipose tissues (F), ovaries & uterus (G), kidney (H), liver (I), mesentery (J), peritoneum (K), spleen (L), and stomach (M) from above mice after treatment with Vehicle, SSO, or ABT-263. n = 5. (N) Representative immunohistochemical images (left) and bar plot quantifications (right) showing the levels of MMP2, MMP7, MMP9, and MMP12 in the omentum of the above mice after treatment with Vehicle, SSO, or ABT-263. Scale bar: 20 μm. n = 5

Similar articles

References

    1. Kuroki L, Guntupalli SR. Treatment of epithelial ovarian cancer. BMJ. 2020;371:m3773. - PubMed
    1. Schoutrop E, Moyano-Galceran L, Lheureux S, Mattsson J, Lehti K, Dahlstrand H, Magalhaes I. Molecular, cellular and systemic aspects of epithelial ovarian cancer and its tumor microenvironment. Semin Cancer Biol. 2022;86:207–23. - PubMed
    1. Pang L, Zhou F, Chen P. Lipid-Laden macrophages recycle Myelin to feed glioblastoma. Cancer Res. 2024;84:3712–4. - PMC - PubMed
    1. Timperi E, Gueguen P, Molgora M, Magagna I, Kieffer Y, Lopez-Lastra S, Sirven P, Baudrin LG, Baulande S, Nicolas A, et al. Lipid-Associated macrophages are induced by Cancer-Associated fibroblasts and mediate immune suppression in breast Cancer. Cancer Res. 2022;82:3291–306. - PubMed
    1. Papavassiliou KA, Papavassiliou AG. Hungry for fat: metabolic crosstalk with lipid-rich CAFs fuels pancreatic cancer. Cell Metab. 2024;36:1172–4. - PubMed