. 2025 Jul 26;22(1):193.
doi: 10.1186/s12974-025-03525-0.

Dual-targeting CSF1R signaling attenuates neurotoxic myeloid activation and preserves photoreceptors in retinitis pigmentosa

Affiliations

Dual-targeting CSF1R signaling attenuates neurotoxic myeloid activation and preserves photoreceptors in retinitis pigmentosa

Jiangmei Wu et al. J Neuroinflammation. .

Abstract

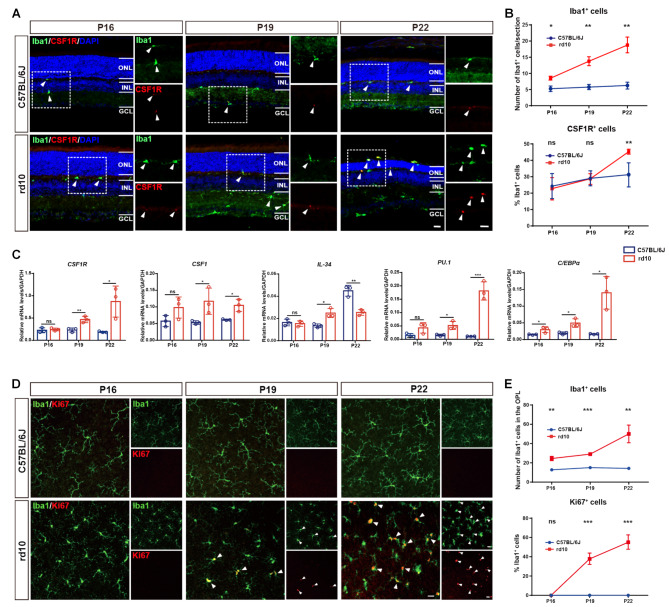
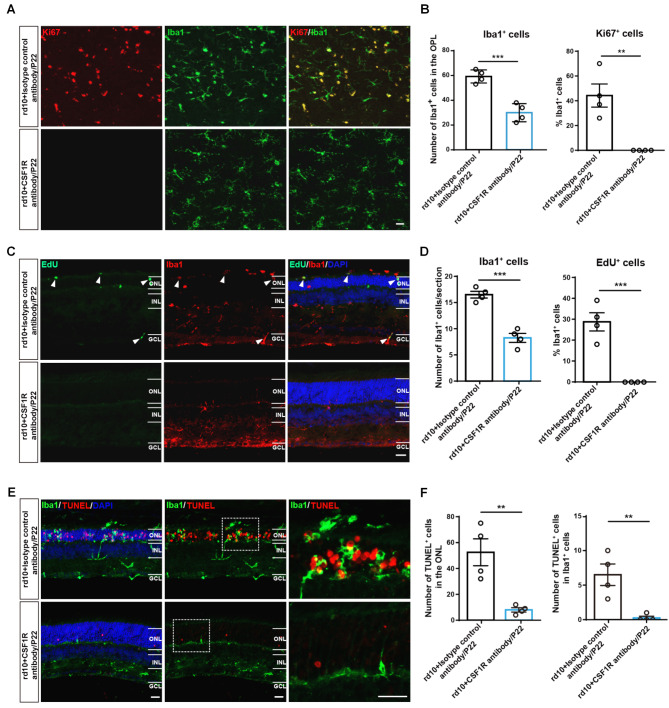
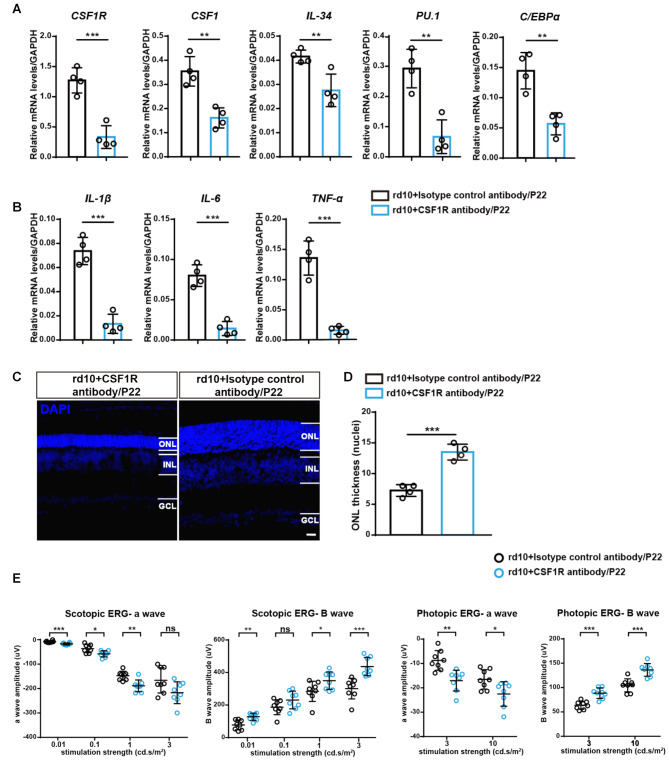
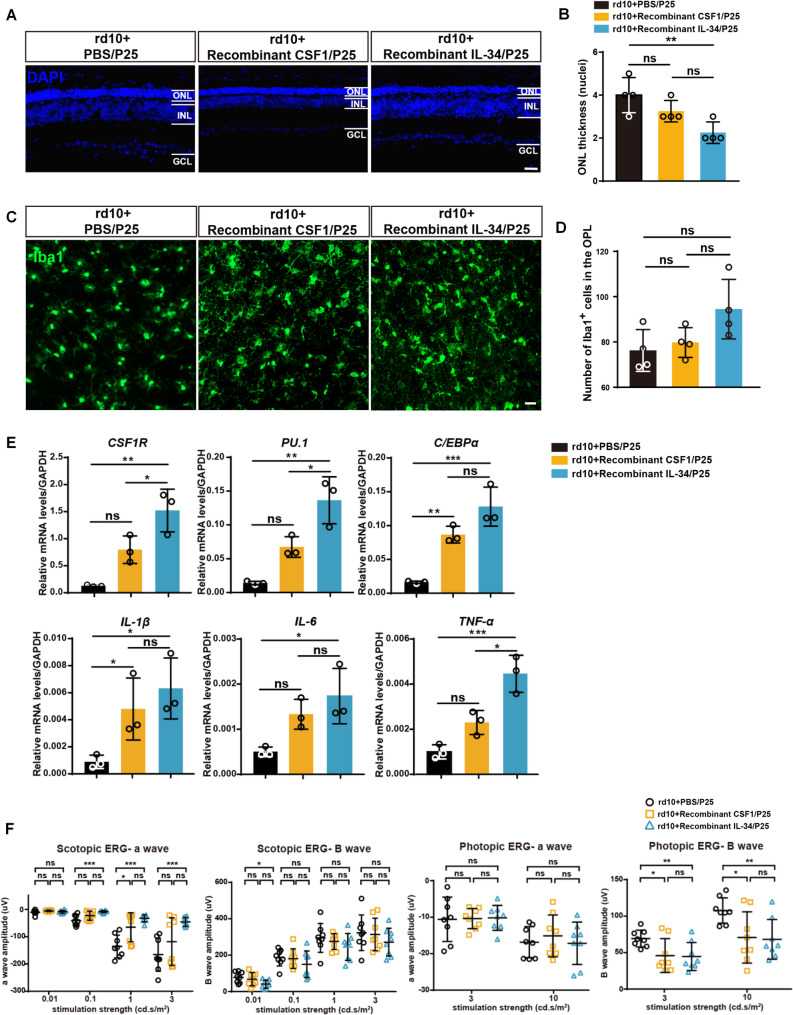
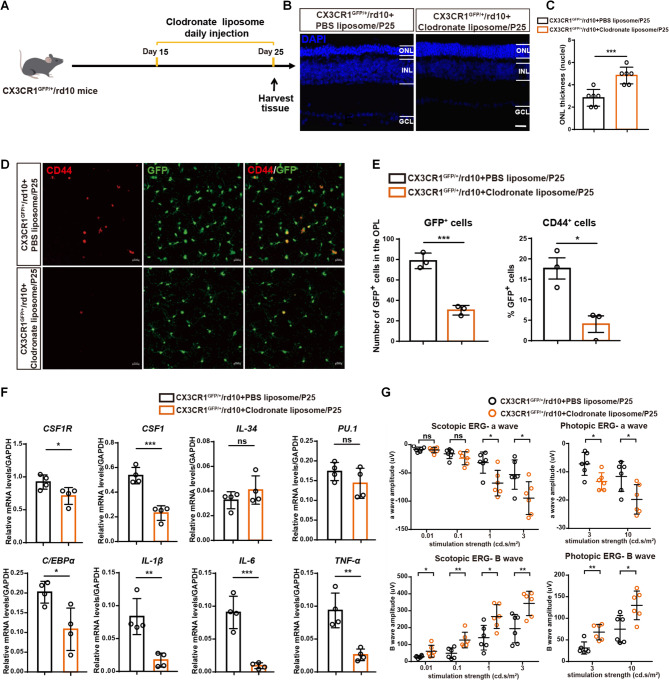
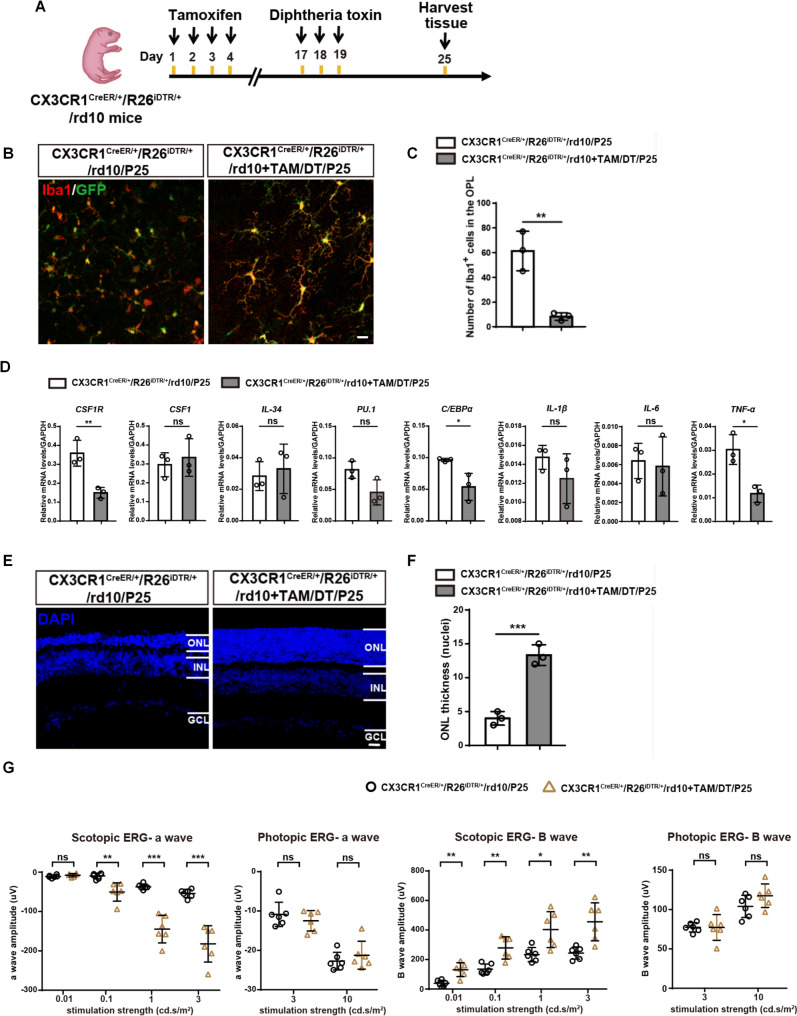
Retinitis pigmentosa (RP), a group of inherited retinal diseases characterized by progressive photoreceptor degeneration, features prominent microglial activation and monocyte-derived macrophage infiltration. While colony-stimulating factor 1 receptor (CSF1R) shows diverse roles in regulating microglial survival and behaviors in various neurodegenerative diseases, its functional significance in RP pathogenesis remains unclear. In this study, we observed upregulated CSF1R signaling specifically within disease-associated myeloid cells in the rd10 mouse model of RP. Targeted intervention via intravitreal CSF1R neutralizing antibodies and systemic PLX5622 administration achieved reduced myeloid proliferation and pro-inflammatory cytokine production and greater photoreceptor survival. Notably, CSF1R potentiation using recombinant IL-34 or CSF1 exacerbated neuroinflammation and accelerated photoreceptor degeneration. Mechanistic investigations revealed that infiltrating monocyte depletion by clodronate liposomes significantly reduced macrophage infiltration and preserved visual function. Using CX3CR1CreER/+/R26iDTR/+/rd10 mouse model, we observed that diphtheria toxin-mediated microglia ablation preserved retinal function. Overall, our findings demonstrate the prominent role of CSF1R in neurotoxic myeloid activation in the context of RP. Our results provide preclinical proof-of-concept that dual targeting of retinal and peripheral CSF1R pathways may offer a mutation-agnostic therapeutic strategy for inherited retinal degenerations.

Keywords: CSF1R; Macrophages; Microglia; Neuroinflammation; Photoreceptor degeneration; Proliferation.


Conflict of interest statement

Declarations. Ethics approval and consent to participate: All experimental procedures were approved by the Animal Subjects Ethics Sub-committee (ASESC) of Hong Kong Polytechnic University and conducted in accordance with the Association for Research in Vision and Ophthalmology (ARVO) statement for the use of animals. Consent for publication: Not applicable. Competing interests: The authors declare no competing interests.

Figures

Fig. 1
Fig. 1
Activation of CSF1R signaling coincides with proliferation of myeloid cells in rd10 mice. (A) Representative confocal images showing Iba1 (green) and CSF1R (red) on the retinal sections of P16, P19, and P22 rd10 and C57BL/6J mice (central region of superior retina, approximately 200 μm away from the optic nerve head). Cell nuclei are stained with DAPI (blue). White arrows indicate CSF1R+ Iba1+ cells. ONL: outer nuclear layer, INL: inner nuclear layer, GCL: ganglion cell layer. Scale bar, 20 μm. (B) Quantification of Iba1+ cells (n = 3 mice/group, C57BL/6J versus rd10, P16, p = 0.0229; P19, p = 0.0026; P22, p = 0.0036). Quantification of the percentage of CSF1R+ cells in Iba1+ cells (n = 3 mice/group, C57BL/6J versus rd10, P16, p = 0.7784; P19, p = 0.9313; P22, p = 0.009). (C) qPCR analysis of CSF1R signaling gene expression in rd10 and C57BL/6J retinas at P16, P19, and P22. (n = 3 mice/group, CSF1R, P16, p = 0.6426; P19, p = 0.0085; P22, p = 0.0275. CSF1, P16, p = 0.1204; P19, p = 0.0492; P22, p = 0.0148. IL-34, P16, p = 0.6661; P19, p = 0.0109; P22, p = 0.0036. PU.1, P16, p = 0.0773; P19, p = 0.0165; P22, p = 0.001. C/EBPα, P16, p = 0.0452; P19, p = 0.0169; P22, p = 0.0119). (D) Representative confocal images showing Iba1 (green) and Ki67 (red) on the retinal flat mounts of rd10 and C57BL/6J mice. The images were stacked images of myeloid cells located in the outer plexiform layer (OPL). White arrowheads indicate Ki67+Iba1+ cells. Scale bar, 20 μm. (E) Quantification of Iba1+ cells (n = 3 mice/group, C57BL/6J versus rd10, P16, p = 0.0021; P19, p < 0.0001; P22, p = 0.0081). Quantification of the percentage of Ki67+ cells in Iba1+ cells (n = 3 mice/group, C57BL/6J versus rd10, P16, p undefined; P19, p < 0.0001; P22, p < 0.0001). Data are presented as mean ± SD and analyzed using unpaired Student’s t-test for each time point (B, C, E). *p < 0.05, **p < 0.01, ***p < 0.001, ns: no significant difference
Fig. 2
Fig. 2
CSF1R neutralizing antibody attenuates myeloid cell proliferation in rd10 mice. (A) Representative confocal images showing Iba1 (green) and Ki67 (red) on the retinal flat mounts of P22 rd10 mice following the intravitreal injection of a CSF1R antibody or isotype control antibody. The images were stacked images of myeloid cells located in the outer plexiform layer (OPL). Scale bar, 20 μm. (B) Quantification of Iba1+ cells (n = 4 mice/group, p = 0.0006). Quantification of the percentage of Ki67+ cells in Iba1+ cells (n = 4 mice/group, p = 0.0032). (C) Representative confocal images of retinal sections from the central retina showing Iba1 (red) and EdU (green) on the retinal sections of P22 rd10 mice receiving CSF1R antibody or isotype control antibody. Cell nuclei were stained with DAPI (blue). White arrowheads indicate EdU+Iba1+ cells. ONL: outer nuclear layer, INL: inner nuclear layer, GCL: ganglion cell layer. Scale bar, 20 μm. (D) Quantification of Iba1+ cells (n = 4 mice/group, p = 0.0003). Quantification of the percentage of EdU+ cells in Iba1+ cells (n = 4 mice/group, p = 0.0006). (E) Representative confocal images of retinal sections from the central retina showing Iba1 (green) and TUNEL (red) on the retinal sections of rd10 mice receiving CSF1R antibody or isotype control antibody. Scale bar, 20 μm. (F) Quantification of TUNEL+ cells (n = 4 mice/group, p = 0.0055). Quantification of double-positive TUNEL+ Iba1+ cells (n = 4 mice/group, p = 0.0074). Data are presented as mean ± SD and analyzed using unpaired Student’s t-test (B, D, F). **p < 0.01, ***p < 0.001
Fig. 3
Fig. 3
CSF1R neutralizing antibody ameliorates neuroinflammation and photoreceptor degeneration in rd10 mice. (A) qPCR analysis of CSF1R signaling (CSF1R, p = 0.0005; CSF1, p = 0.002; IL-34, p = 0.0083; PU.1, p = 0.0018; C/EBPα, p = 0.0024) and (B) pro-inflammatory response (IL-1β, p = 0.0001; IL-6, p = 0.0002; TNF-α, p = 0.0002) gene expression in rd10 mice treated with CSF1R antibody or isotype control antibody (n = 4 mice/group). (C) Representative confocal images of retinal sections from the central retina showing cell nuclei (DAPI, blue) in retinal sections of rd10 mice treated with CSF1R antibody or isotype control antibody. ONL: outer nuclear layer, INL: inner nuclear layer, GCL: ganglion cell layer. Scale bar, 20 μm. (D) Quantification of the number of nuclear rows in the ONL, representing photoreceptor survival between two groups (n = 4 mice/group, p = 0.0002). (E) Bar plots showing average a-wave and B-wave amplitudes in scotopic or photopic electroretinogram (ERG) responses of rd10 mice treated with CSF1R antibody or isotype control antibody (n = 8 mice/group. Scotopic a-wave, 0.01 cd.s/m², p = 0.0005; 0.1 cd.s/m², p = 0.0113; 1 cd.s/m², p = 0.0017; 3 cd.s/m², p = 0.054. Scotopic B-wave, 0.01 cd.s/m², p = 0.0019; 0.1 cd.s/m², p = 0.1011; 1 cd.s/m², p = 0.0395; 3 cd.s/m², p = 0.0005. Photopic a-wave, 3 cd.s/m², p = 0.0013; 10 cd.s/m², p = 0.0195. Photopic B-wave, 3 cd.s/m², p = 0.0001; 10 cd.s/m², p = 0.0003). Data are presented as mean ± SD and analyzed using unpaired Student’s t-test (A, B, D, E). *p < 0.05, **p < 0.01, ***p < 0.001, ns: no significant difference
Fig. 4
Fig. 4
Recombinant CSF1 and IL-34 deteriorates neuroinflammation and photoreceptor function in rd10 mice. (A) Representative confocal images of retinal sections from the central retina showing cell nuclei (DAPI, blue) in retinal sections of rd10 mice treated with an intravitreal injection of recombinant CSF1, IL-34, or PBS. ONL: outer nuclear layer, INL: inner nuclear layer, GCL: ganglion cell layer. Scale bar, 20 μm. (B) Quantification of the number of nuclear rows in the ONL, representing photoreceptor survival among three groups (n = 4 mice/group, F(2, 9) = 7.929, p = 0.0103; rd10 + PBS versus rd10 + Re CSF1, p = 0.2569; rd10 + PBS versus rd10 + Re IL-34, p = 0.0082; rd10 + Re CSF1 versus rd10 + Re IL-34, p = 0.1124). (C-D) Representative confocal images and quantification of Iba1-positive myeloid cells (green) located in the outer plexiform layer (OPL) on the retinal flat mounts of rd10 mice treated with recombinant CSF1, IL-34, or PBS. Scale bar, 20 μm. (n = 4 mice/group, F(2, 9) = 3.75, p = 0.0654; rd10 + PBS versus rd10 + Re CSF1, p = 0.8755; rd10 + PBS versus rd10 + Re IL-34, p = 0.0695; rd10 + Re CSF1 versus rd10 + Re IL-34, p = 0.1479). (E) qPCR analysis of CSF1R signaling (CSF1R, PU.1, C/EBPα) and pro-inflammatory response (IL-1β, IL-6, TNF-α) gene expression in rd10 mice treated with recombinant CSF1, IL-34, or PBS (n = 3 mice/group). CSF1R (F(2, 6) = 19.81, p = 0.0023; rd10 + PBS versus rd10 + Re CSF1, p = 0.0532; rd10 + PBS versus rd10 + Re IL-34, p = 0.0018; rd10 + Re CSF1 versus rd10 + Re IL-34, p = 0.0389). PU.1 (F(2, 6) = 23.41, p = 0.0015; rd10 + PBS versus rd10 + Re CSF1, p = 0.0564; rd10 + PBS versus rd10 + Re IL-34, p = 0.0012; rd10 + Re CSF1 versus rd10 + Re IL-34, p = 0.0197). C/EBPα (F(2, 6) = 29.07, p = 0.0008; rd10 + PBS versus rd10 + Re CSF1, p = 0.0076; rd10 + PBS versus rd10 + Re IL-34, p = 0.0007; rd10 + Re CSF1 versus rd10 + Re IL-34, p = 0.0702). IL-1β (F(2, 6) = 8.618, p = 0.0172; rd10 + PBS versus rd10 + Re CSF1, p = 0.0429; rd10 + PBS versus rd10 + Re IL-34, p = 0.0188; rd10 + Re CSF1 versus rd10 + Re IL-34, p = 0.772). IL-6 (F(2, 6) = 7.153, p = 0.0258; rd10 + PBS versus rd10 + Re CSF1, p = 0.102; rd10 + PBS versus rd10 + Re IL-34, p = 0.0233; rd10 + Re CSF1 versus rd10 + Re IL-34, p = 0.4916). TNF-α (F(2, 6) = 25.95, p = 0.0011; rd10 + PBS versus rd10 + Re CSF1, p = 0.0818; rd10 + PBS versus rd10 + Re IL-34, p = 0.0009, rd10 + Re CSF1 versus rd10 + Re IL-34, p = 0.0102). (F) Bar plots showing average a-wave and B-wave amplitudes in scotopic or photopic electroretinogram (ERG) responses of rd10 mice treated with recombinant CSF1, IL-34, or PBS (n = 8 mice/group) (For the statistical values, please refer to supplementary file 3). Data are presented as mean ± SD and analyzed using One way ANOVA with Tukey’s post hoc test (B, D, E, F). *p < 0.05, **p < 0.01, ***p < 0.001, ns: no significant difference
Fig. 5
Fig. 5
Infiltrating monocyte depletion via clodronate liposome inhibits pro-inflammatory response and protects photoreceptor functions during RP. (A) Scheme of clodronate liposome (CL) administration and time points for observation. (B) Representative confocal images of retinal sections from the central retina showing cell nuclei (DAPI, blue) in retinal sections of CX3CR1GFP/+/rd10 mice treated with daily intraperitoneal injection of clodronate liposome or PBS liposome. ONL: outer nuclear layer, INL: inner nuclear layer, GCL: ganglion cell layer. Scale bar, 20 μm. (C) Quantification of the number of nuclear rows in the ONL, representing photoreceptor survival between two groups (n = 6 mice/group, p = 0.001). (D) Representative confocal images showing GFP (green) and CD44 (red) on the retinal flat mounts of CX3CR1GFP/+/rd10 mice treated with clodronate liposome or PBS liposome. The images were stacked images of myeloid cells located in the outer plexiform layer (OPL). Scale bar, 20 μm. (E) Quantification of GFP+ cells (n = 3 mice/group, p = 0.0007). Quantification of the percentage of CD44+ cells in GFP+ cells (n = 3 mice/group, p = 0.0144). (F) qPCR analysis of CSF1R signaling (CSF1R, p = 0.0453; CSF1, p = 0.0005; IL-34, p = 0.2607; PU.1, p = 0.2323; C/EBPα, p = 0.0209) and pro-inflammatory response (IL-1β, p = 0.0041; IL-6, p = 0.0006; TNF-α, p = 0.0028) gene expression in CX3CR1GFP/+/rd10 mice treated with clodronate liposome or PBS liposome (n = 4 mice/group). (G) Bar plots showing average a-wave and B-wave amplitudes in scotopic or photopic electroretinogram (ERG) responses of CX3CR1GFP/+/rd10 mice treated with clodronate liposome or PBS liposome (n = 6 mice/group, scotopic a-wave, 0.01 cd.s/m², p = 0.738; 0.1 cd.s/m², p = 0.2096; 1 cd.s/m², p = 0.0129; 3 cd.s/m², p = 0.0257. Scotopic B-wave, 0.01 cd.s/m², p = 0.0479; 0.1 cd.s/m², p = 0.0067; 1 cd.s/m², p = 0.0128; 3 cd.s/m², p = 0.008. Photopic a-wave, 3 cd.s/m², p = 0.0139; 10 cd.s/m², p = 0.0231. Photopic B-wave, 3 cd.s/m², p = 0.0027; 10 cd.s/m², p = 0.0149). Data are presented as mean ± SD and analyzed using unpaired Student’s t-test (C, E, F, G). *p < 0.05, **p < 0.01, ***p < 0.001, ns: no significant difference
Fig. 6
Fig. 6
Resident microglia deletion protects photoreceptors and retinal functions during RP. (A) Scheme of tamoxifen (TAM) and diphtheria toxin (DT) administration in CX3CR1CreER/+/R26iDTR/+/rd10 mice to deplete resident microglia and time points for observation. (B) Representative confocal images showing GFP (green) and Iba1 (red) on the retinal flat mounts of TAM/DT-treated or untreated CX3CR1CreER/+/R26iDTR/+/rd10 mice. The images were stacked images located in the outer plexiform layer (OPL). Scale bar, 20 μm. (C) Quantification of Iba1+ cells in the OPL (n = 3 mice/group, p = 0.0049). (D) qPCR analysis of CSF1R signaling (CSF1R, p = 0.0082; CSF1, p = 0.6057; IL-34, p = 0.6802; PU.1, p = 0.0608; C/EBPα, p = 0.0267) and pro-inflammatory response (IL-1β, p = 0.2504; IL-6, p = 0.7938; TNF-α, p = 0.0113) gene expression in TAM/DT-treated or untreated CX3CR1CreER/+/R26iDTR/+/rd10 mice (n = 3 mice/group). (E) Representative confocal images of retinal sections from the central retina showing cell nuclei (DAPI, blue) in retinal sections of TAM/DT-treated or untreated CX3CR1CreER/+/R26iDTR/+/rd10 mice. ONL: outer nuclear layer, INL: inner nuclear layer, GCL: ganglion cell layer. Scale bar, 20 μm. (F) Quantification of the number of nuclear rows in the ONL, representing photoreceptor survival (n = 3 mice/group, p = 0.0009). (G) Bar plots showing average a- and B-wave amplitudes in scotopic or photopic electroretinogram (ERG) responses of TAM/DT-treated or untreated CX3CR1CreER/+/R26iDTR/+/rd10 mice (n = 6 mice/group, scotopic a-wave, 0.01 cd.s/m², p = 0.1844; 0.1 cd.s/m², p = 0.0023; 1 cd.s/m², p < 0.0001; 3 cd.s/m², p < 0.0001. Scotopic B-wave, 0.01 cd.s/m², p = 0.0013; 0.1 cd.s/m², p = 0.0017; 1 cd.s/m², p = 0.0102; 3 cd.s/m², p = 0.0032. Photopic a-wave, 3 cd.s/m², p = 0.3452; 10 cd.s/m², p = 0.4025. Photopic B-wave, 3 cd.s/m², p = 0.9885; 10 cd.s/m², p = 0.14). Data are presented as mean ± SD and analyzed using unpaired Student’s t-test (C, D, F, G). *p < 0.05, **p < 0.01, ***p < 0.001, ns: no significant difference

Similar articles

References

    1. Dias MF, Joo K, Kemp JA, Fialho SL, da Silva Cunha A Jr., Woo SJ, et al. Molecular genetics and emerging therapies for retinitis pigmentosa: basic research and clinical perspectives. Prog Retin Eye Res. 2018;63:107–31. 10.1016/j.preteyeres.2017.10.004. - PubMed
    1. Hartong DT, Berson EL, Dryja TP, Retinitis pigmentosa. Lancet. 2006;368(9549):1795–809. 10.1016/S0140-6736(06)69740-7. - PubMed
    1. Ferrari S, Di Iorio E, Barbaro V, Ponzin D, Sorrentino FS, Parmeggiani F. Retinitis pigmentosa: genes and disease mechanisms. Curr Genomics. 2011;12(4):238–49. 10.2174/138920211795860107. - PMC - PubMed
    1. Sahni JN, Angi M, Irigoyen C, Semeraro F, Romano MR, Parmeggiani F. Therapeutic challenges to retinitis pigmentosa: from neuroprotection to gene therapy. Curr Genomics. 2011;12(4):276–84. 10.2174/138920211795860062. - PMC - PubMed
    1. Daiger SP, Bowne SJ, Sullivan LS. Perspective on genes and mutations causing retinitis pigmentosa. Arch Ophthalmol. 2007;125(2):151–8. 10.1001/archopht.125.2.151. - PMC - PubMed

MeSH terms

Substances

LinkOut - more resources