. 2025 Jul 26;18(1):48.
doi: 10.1186/s13072-025-00609-2.

Histone H4 lysine 20 methylation marks genes dynamically regulated during erythroid maturation

Affiliations

Histone H4 lysine 20 methylation marks genes dynamically regulated during erythroid maturation

Kristin Murphy et al. Epigenetics Chromatin. .

Abstract

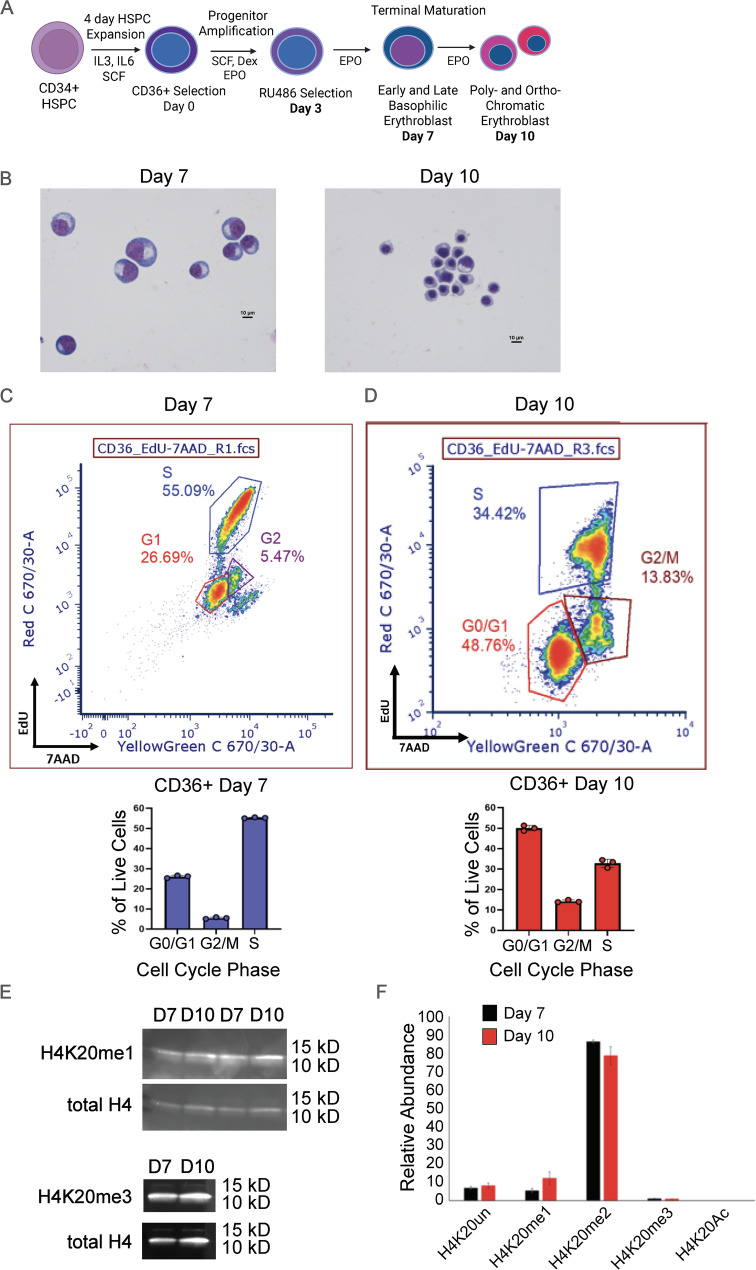
Background: Methylation of H4K20 has been implicated in the regulation of gene expression but also plays essential roles in numerous cellular functions, making studies of its effects on transcription challenging. To gain insights into the role of H4K20 methylation in regulating gene expression, we studied H4K20me1 and H4K20me3 in the context of the well-characterized erythroid differentiation of human hematopoietic stem and progenitor cells.

Results: H4K20me1 enrichment over the gene body was strongly correlated with expression changes. During erythroid differentiation, there was a dramatic decline in the level of RNA Polymerase II (Pol II); H4K20me1 was lost where Pol II was lost, and gained at genes where Pol II occupancy was maintained and transcripts were upregulated. We did identify a small subset of highly expressed genes, including beta-globin, that had a dramatic loss of H4K20me1 during erythroid differentiation, despite a substantial gain of Pol II. The histone demethylase PHF8 was present at these genes, as well as at the transcription start site of many active genes. In contrast to H4K20me1 over gene bodies correlating with transcription, enrichment at the transcription start site occurred at genes with low levels of Pol II occupancy and RNA expression throughout erythroid differentiation. The majority of H4K20me3 was present over intergenic regions, consistent with its well-established role as a repressor of repetitive elements. Intriguingly, H4K20me3 was also present at the transcription start site of genes with H4K20me1 over the gene body. At these genes, H4K20me3 levels were highly correlated with chromatin accessibility at the transcription start site, and an elevated Pol II pausing index. There was a dramatic loss of H4K20me3 occupancy in genic, but not intergenic, regions during erythroid differentiation.

Conclusions: There are dynamic changes in H4K20 methylation during cellular differentiation that correlate strongly with Pol II occupancy and activity. These changes occurred in genic regions, with H4K20me3 at the transcription start site correlated with Pol II pausing, and H4K20me1 gene body levels tightly linked with transcriptional changes. Together, these data provide important insights into the role of H4K20 methylation in the regulation of gene expression during cellular differentiation.

Keywords: Differentiation; Erythropoiesis; H4K20me1; H4K20me3; Histone methylation.


Conflict of interest statement

Declarations. Competing interests: The authors declare no competing interests.

Figures

Fig. 1
Fig. 1
Figure 1. Global changes in H4K20 methylation during erythroid maturation. (A) Overview of semi-synchronous culture system, modified from Gautier 2016.31 (B) Cell morphology demonstrated by cytospin on days 7 and 10 in culture. (C-D) Cell cycle analyses determined by EdU incorporation at day 7 (C) and day 10 (D). Example flow cytometry plot (left) and percent of cells in each phase of the cell cycle (right). Data represent 3 independent replicates. (E)Western blot of H4K20 mono and tri methyl levels during the indicated culture days. (F) H4K20 modification status at day 7 and day 10 of culture as determined by mass spectrometry. Data from Murphy 2021.32 Data represent 2 independent replicates. Error bars represent standard error of the mean.
Fig. 2
Fig. 2
H4K20me1 is enriched over the body of active genes, and is highly correlated with RNA Polymerase II occupancy and RNA expression. (A) Genomic annotation of H4K20me1 peaks (total = 73,978) in day 7 erythroblasts using Homer annotatePeaks.pl, with associated log2 ratio of observed fraction of peaks assigned to each annotation compared to fraction of the annotated genome assigned to each annotation. (B) Heat map showing H4K20me1, KMT5A, chromatin accessibility (ATAC-seq), H3K36me3, H3K4me1, H3K4me3, serine 5 phosphorylated RNA Polymerase II (Ser5 Pol II), and serine 2 phosphorylated RNA Polymerase II (Ser2 Pol II) occupancy over genes sorted by H4K20me1 levels on day 7. (C) Day 7 Pearson correlation heatmap for average normalized scores of H4K20me1, H3K36me3, H3K4me3, H3K4me1, chromatin accessibility (ATAC), Ser5 Pol II, Ser2 Pol II, and RNA (RNA-seq) over promoters (TSS +/- 500 bp), gene bodies (TSS to TES), or merged exons for RNA (metagene) as indicated. (D) H4K20me1, Ser5 Pol II, Ser2 Pol II, H3K36me3, and chromatin accessibility plotted over genes divided into deciles based on ranked H4K20me1 levels (TSS to TES). (E) RNA and H4K20me1 plotted over genes divided into deciles based on ranked RNA levels (merged exons). (F) Boxplot showing day 7 average levels of H4K20me1 over promoters (TSS +/- 500 bp) or gene bodies (TSS to TES) for expressed genes (54,947), expressed genes with pausing index (PI) > 4 (23,747), and expressed genes with PI < 4 (31,200). P value represents Welch Two Sample t-test. *** indicates significantly increased, p value < 2.2e-16, &&& indicates significantly decreased, p value < 2.2e-16. (G) Gene tracks showing examples of H4K20me1, Ser5 Pol II, and Ser2 Pol II enrichment at day 7 over ANK1 and FLI1 genes, y axis represents RPKM, genome scale bar as indicated
Fig. 3
Fig. 3
H4K20me3 is enriched at the TSS of active genes and is correlated with chromatin accessibility. (A) Genomic annotation of H4K20me3 peaks (total = 35,609) in day 7, using Homer annotatePeaks.pl with associated log2 ratio of observed fraction of peaks assigned to each annotation compared to fraction of the annotated genome assigned to each annotation. (B) Heat map showing H4K20me3, chromatin accessibility (ATAC-seq), H3K36me3, H3K4me3, H3K4me1, serine 5 phosphorylated RNA Polymerase II (Ser5 Pol II), and serine 2 phosphorylated RNA Polymerase II (Ser2 Pol II) occupancy over genes sorted by H4K20me3 levels on day 7. (C) Day 7 Pearson correlation heatmap for average normalized scores of H4K20me3, H3K36me3, H3K4me3, H3K4me1, chromatin accessibility (ATAC), Ser5 Pol II, Ser2 Pol II, and RNA (RNA-seq) over promoters (TSS +/- 500 bp), gene bodies (TSS to TES), or merged exons for RNA (metagene) as indicated. (D) H4K20me3 over genes (centered over TSS) divided into deciles based on ranked RNA levels (merged exons). (E) Boxplot showing day 7 average levels of H4K20me3 over promoters (TSS +/- 500 bp) or gene bodies (TSS to TES) for expressed genes (54,947), expressed genes with pausing index (PI) > 4 (23,747), and expressed genes with PI < 4 (31,200). P value represents Welch Two Sample t-test. &&& indicates significantly decreased, p value < 2.2e-16. (F) Gene tracks showing example of H4K20me3, H4K20me1, Ser5 Pol II, and Ser2 Pol II enrichment at day 7 over the RPS19 gene, y axis represents RPKM, genome scale bar as indicated
Fig. 4
Fig. 4
Loss of H4K20me1 is associated with loss of Pol II. (A) Volcano plot of differential H4K20me1 peaks during maturation, day 10 vs. day 7. (B-C) Genomic annotation of differentially increased (9,212) and decreased (11,158) H4K20me1 peaks. (D) Volcano plot of differential H4K20me1 over gene bodies (TSS to TES) during maturation, day 10 vs. day 7. (E-F) Heat map and (G-H) profile plot of serine 5 phosphorylated RNA Polymerase II (Ser5 Pol II) and RNA (merged exons) over genes that differentially gain and lose gene body H4K20me1 during maturation. (I) Boxplot showing average levels of Ser5 Pol II (TSS to TES) at day 7 (blue) and day 10 (red) over genes that gain and lose gene body H4K20me1 during maturation. (J) Gene tracks showing examples of H4K20me1, Ser5 Pol II, and Ser2 Pol II enrichment at day 7 (blue) and day 10 (red) over RPS19 and ANK1 genes, y axis represents RPKM, genome scale bar as indicated. (K) Heat map and (L) profile plot of H4K20me1 over differentially upregulated and downregulated genes, day 10 vs. day 7. (M-N) Gene ontology and pathway analysis for genes that differentially gain (M) or lose (N) H4K20me1 over gene bodies. (O) Volcano plot of differential PHF8 peaks during maturation, day 10 vs. day 7. (P) Genomic annotation of differentially decreased PHF8 peaks. (Q) Heat map and (R) profile plot of H4K20me1 over peaks that differentially lose PHF8, day 10 vs. day 7
Fig. 5
Fig. 5
H4K20me3 is associated with dynamically regulated genes with a high pausing index. (A) Volcano plot of differential H4K20me3 peaks during maturation from day 7 to day 10. (B-C) Genomic annotation of differentially increased (1,108) and decreased (7,128) H4K20me3 peaks. (D) Volcano plot of differential H4K20me3 over promoters (TSS +/- 500 bp) during maturation from day 7 to day 10. (E-F) Heat map and (G-H) profile plot of serine 5 phosphorylated RNA Polymerase II (Ser5 Pol II) and RNA (merged exons) over genes that gain and lose promoter H4K20me3 during maturation. (I) Boxplot showing average levels of Ser5 Pol II (TSS to TES) over genes that gain and lose promoter H4K20me3 during maturation. (J) Gene tracks showing example of H4K20me3, H4K20me1, Ser5 Pol II, and Ser2 Pol II enrichment at day 7 (blue) and day 10 (red) over the ANK1 gene, y axis represents RPKM, genome scale bar as indicated. (K-L) Gene ontology and pathway analysis for genes that differentially gain (K) or lose (L) H4K20me3 over promoters
Fig. 6
Fig. 6
H4K20me1 and H4K20me3 are mutually exclusive in maturing erythroid cells, with few regions of progressive methylation. (A) Heatmap showing H4K20me1 and H4K20me3 occupancy over union H4K20me1/H4K20me3 peaks (sorted by H4K20me1 levels) at day 7 of maturation. (B) Venn diagram showing direct overlap in day 7 H4K20me1 and H4K20me3 peaks (C) Heatmap showing H4K20me1, H4K20me3, and serine 5 phosphorylated RNA Polymerase II (Ser5 Pol II) occupancy over genes sorted by average RNA (exons merged). (D-E) H4K20me1 and H4K20me3 heatmaps over genes with differentially increased and decreased H4K20me1 (D) or H4K20me3 (E). (F-G) Profile plots showing H4K20me1 (top) and H4K20me3 (bottom) over same regions as (D-E). (H) Venn diagram showing overlap in genes associated with decreased H4K20me1 peaks and increased H4K20me3 (I) Gene ontology and pathway analysis for shared set of genes (220) from (H) associated with decreased H4K20me1 peaks and increased H4K20me3. (J) Gene tracks showing example of PHF8, H4K20me3, H4K20me1, and Ser2 Pol II enrichment at day 7 (blue) and day 10 (red) over the beta-globin locus including locus control region, HBB boxed in red
Fig. 7
Fig. 7
Proposed model depicting the relationship of H4K20 methylation and gene expression

Similar articles

References

    1. Edwards CR, Dang W, Berger SL. Histone H4 lysine 20 of Saccharomyces cerevisiae is monomethylated and functions in subtelomeric Silencing. Biochemistry Dec. 2011;6(48):10473–83. 10.1021/bi201120q - PMC - PubMed
    1. Abbas T, Shibata E, Park J, Jha S, Karnani N, Dutta A. CRL4(Cdt2) regulates cell proliferation and histone gene expression by targeting PR-Set7/Set8 for degradation. Mol Cell Oct. 2010;8(1):9–21. 10.1016/j.molcel.2010.09.014 - PMC - PubMed
    1. Centore RC, Havens CG, Manning AL, et al. CRL4(Cdt2)-mediated destruction of the histone methyltransferase Set8 prevents premature chromatin compaction in S phase. Mol Cell Oct. 2010;8(1):22–33. 10.1016/j.molcel.2010.09.015 - PMC - PubMed
    1. Beck DB, Burton A, Oda H, Ziegler-Birling C, Torres-Padilla ME, Reinberg D. The role of PR-Set7 in replication licensing depends on Suv4-20 h. Genes Dev Dec. 2012;1(23):2580–9. 10.1101/gad.195636.112 - PMC - PubMed
    1. Tardat M, Murr R, Herceg Z, Sardet C, Julien E. PR-Set7-dependent lysine methylation ensures genome replication and stability through S phase. J Cell Biol Dec. 2007;31(7):1413–26. 10.1083/jcb.200706179 - PMC - PubMed

LinkOut - more resources