

Magnetite drives microbial community restructuring and stimulates aceticlastic methanogenesis of type II Methanosarcina in mangrove sediments
- PMID: 40713905
- PMCID: PMC12297640
- DOI: 10.1186/s40168-025-02157-z
Magnetite drives microbial community restructuring and stimulates aceticlastic methanogenesis of type II Methanosarcina in mangrove sediments
Abstract
Background: Mangrove wetlands are critical hotspots of methane emissions, yet the role of naturally occurring minerals in shaping their microbial communities and methanogenic processes is poorly understood. Magnetite, a common iron mineral in soils and sediments, has been reported to enhance aceticlastic methanogenesis and facilitate syntrophic methanogenesis. In this study, we integrated multi-omic profiling with cultivation-based approaches to investigate the impact of magnetite on methanogenesis of microbial consortia derived from mangrove sediments, using lactate as a substrate.
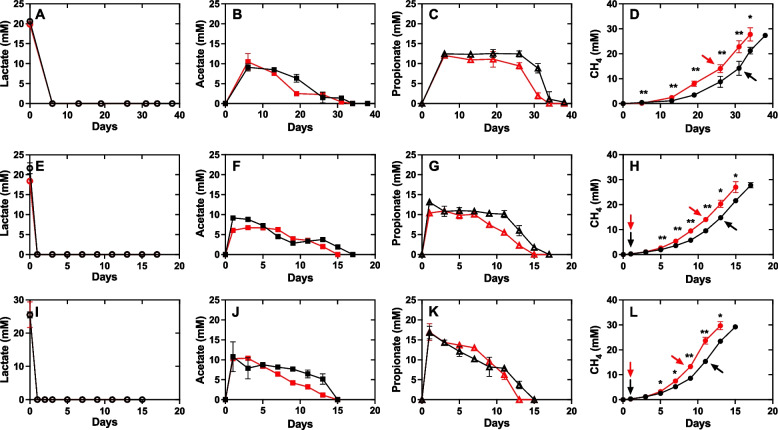
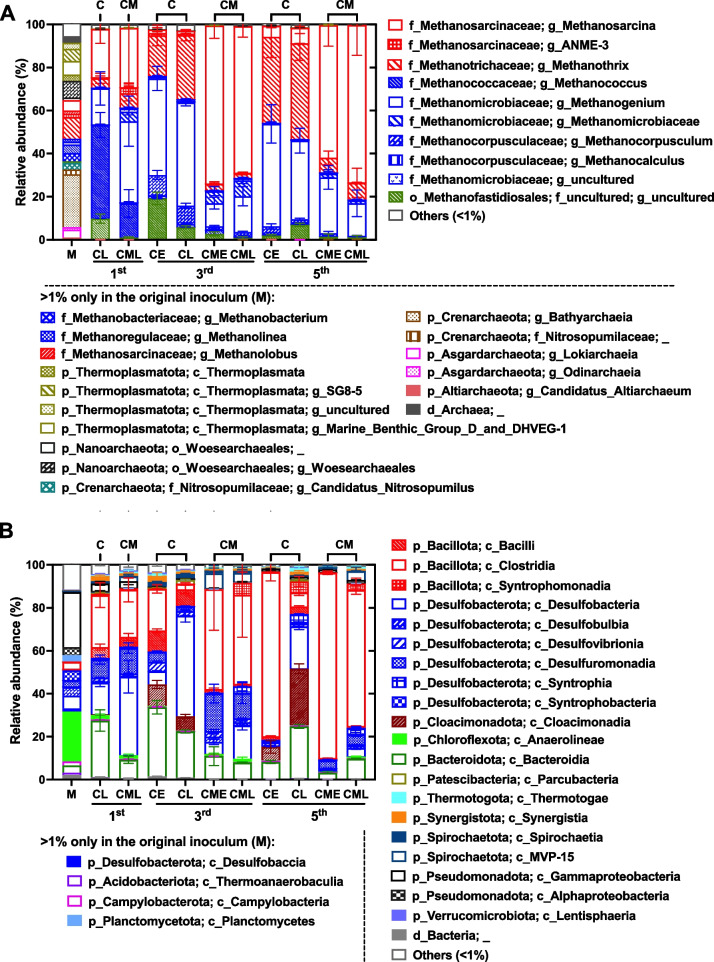
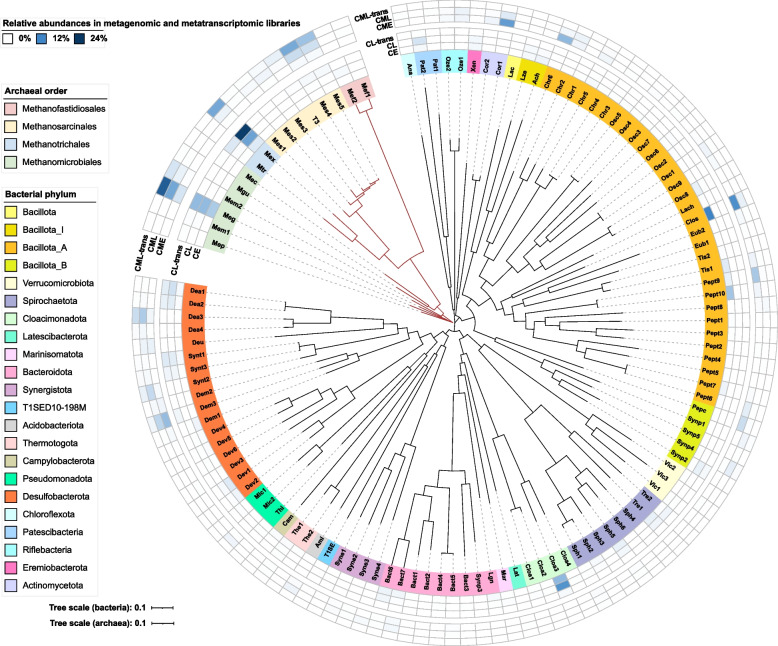
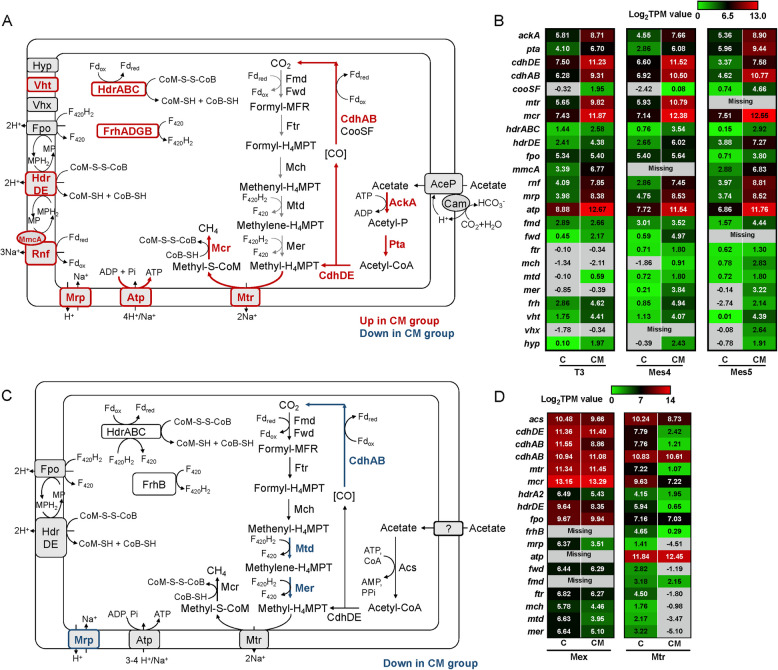
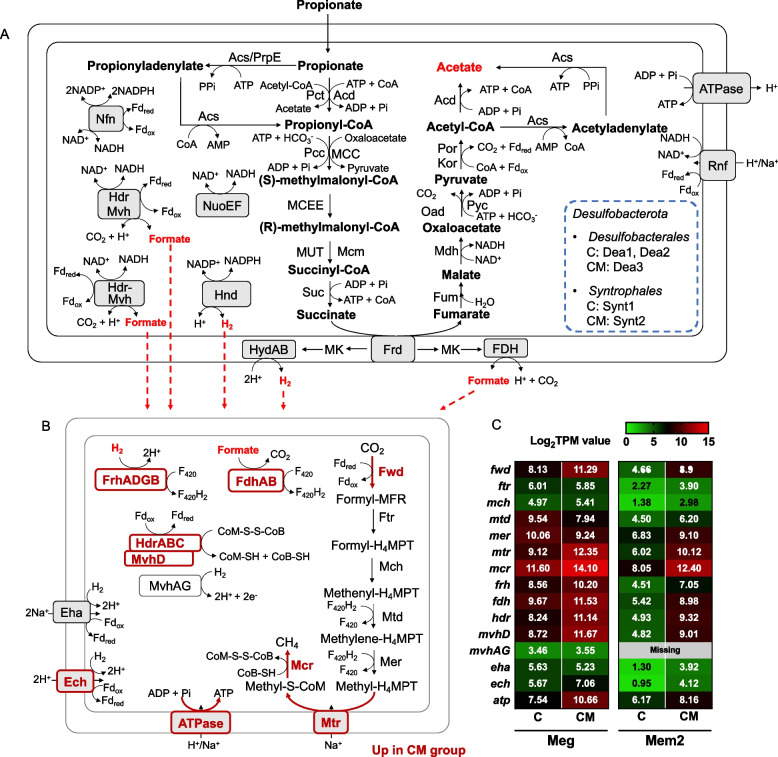
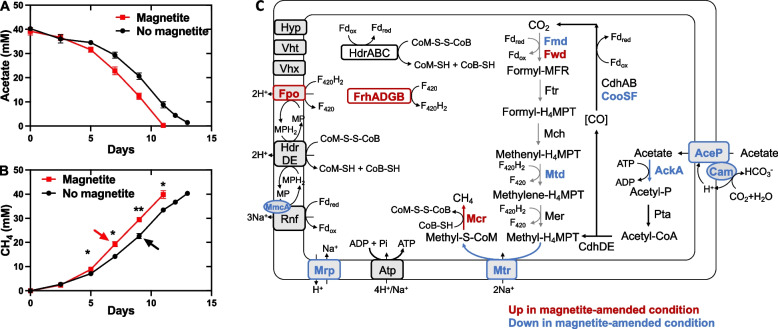
Results: Across five serial transfers, mangrove microbial consortia converted lactate to propionate and acetate, which were subsequently degraded into methane. Magnetite addition significantly stimulated methane production, leading to notable changes in community structure, particularly for aceticlastic methanogens, with Methanosarcina predominating in the magnetite-amended cultures and Methanothrix in controls. Four Methanosarcina strains T3, T4, T13, and MeOH were subsequently isolated from magnetite-amended cultures. Combined analyses of metagenome-assembled genomes and the genomes of these isolates revealed that the enriched Methanosarcina in magnetite-amended cultures belonged to type II deficient in hydrogenotrophic methanogenesis pathway. Metatranscriptomic analyses suggested that magnetite addition stimulated aceticlastic methanogenesis of type II Methanosarcina and hydrogenotrophic methanogenesis of Methanomicrobiales in the consortia. Furthermore, pure culture experiments confirmed that magnetite stimulated aceticlastic methanogenesis by Methanosarcina sp. T3, although its gene expression patterns differed from those observed in the microbial consortia. Additionally, Methanofastidiosales, an uncultured archaeal lineage possessing H2-dependent methylotrophic methanogenesis, was detected in all transfers.
Conclusions: Our findings demonstrate that magnetite alters methanogenic consortia in mangrove sediments, selectively stimulating aceticlastic methanogenesis of type II Methanosarcina and modulating hydrogenotrophic activity in Methanomicrobiales. By integrating multi-omics analyses with pure culture validation, we demonstrate, for the first time, that magnetite directly enhances the aceticlastic methanogenesis of type II non-hydrogenotrophic Methanosarcina. This study provides new insights into the influence of magnetite on complex microbial consortia, offers a deeper understanding of the physiology of type II non-hydrogenotrophic Methanosarcina, and advances knowledge of mineral-mediated regulation of methanogenic networks in anoxic environments. Video Abstract.
Keywords: Methanosarcina; Aceticlastic methanogenesis; Hydrogenotrophic methanogenesis; Magnetite; Mangrove sediments; Metagenome; Metatranscriptome; Methane.
© 2025. The Author(s).
Conflict of interest statement
Declarations. Ethics approval and consent to participate: Not applicable. Consent for publication: Not applicable. Competing interests: The authors declare no competing interests.
Figures
Similar articles
-
Magnetite production and transformation in the methanogenic consortia from coastal riverine sediments.J Microbiol. 2017 Nov;55(11):862-870. doi: 10.1007/s12275-017-7104-1. Epub 2017 Oct 27. J Microbiol. 2017. PMID: 29076069
-
Environment selected microbial function rather than taxonomic species in a plateau saline-alkaline wetland.Appl Environ Microbiol. 2025 Jul 23;91(7):e0220624. doi: 10.1128/aem.02206-24. Epub 2025 Jul 3. Appl Environ Microbiol. 2025. PMID: 40607849 Free PMC article.
-
In situ addition of layered double hydroxides promotes sulfate-dependent anaerobic methane oxidation and microbial community shifts in freshwater-influenced mangroves sediments.Water Res. 2025 Sep 1;283:123851. doi: 10.1016/j.watres.2025.123851. Epub 2025 May 17. Water Res. 2025. PMID: 40398057
-
Health professionals' experience of teamwork education in acute hospital settings: a systematic review of qualitative literature.JBI Database System Rev Implement Rep. 2016 Apr;14(4):96-137. doi: 10.11124/JBISRIR-2016-1843. JBI Database System Rev Implement Rep. 2016. PMID: 27532314
-
Incentives for preventing smoking in children and adolescents.Cochrane Database Syst Rev. 2017 Jun 6;6(6):CD008645. doi: 10.1002/14651858.CD008645.pub3. Cochrane Database Syst Rev. 2017. PMID: 28585288 Free PMC article.
References
-
- Laboratory NGM. The NOAA Annual Greenhouse Gas Index (AGGI). 2024. https://gml.noaa.gov/aggi/aggi.html. Accessed Summer 2024.
-
- EPA U. Overview of greenhouse gases. 2025. https://www.epa.gov/ghgemissions/global-greenhouse-gas-emissions-data. Accessed 16 Jan 2025.
-
- Nisbet EG, Dlugokencky EJ, Manning MR, Lowry D, Fisher RE, France JL, et al. Rising atmospheric methane: 2007–2014 growth and isotopic shift. Global Biogeochem Cycles. 2016;30(9):1356–70.
-
- Schaefer H, Fletcher SEM, Veidt C, Lassey KR, Brailsford GW, Bromley TM, et al. A 21st-century shift from fossil-fuel to biogenic methane emissions indicated by 13CH4. Science. 2016;352(6281):80–4. - PubMed
-
- Rosentreter JA, Borges AV, Deemer BR, Holgerson MA, Liu S, Song C, et al. Half of global methane emissions come from highly variable aquatic ecosystem sources. Nat Geosci. 2021;14(4):225–30.
MeSH terms
Substances
Grants and funding
- 42207144/National Natural Science Foundation of China
- 32225003, 32393971, and 32393970/National Natural Science Foundation of China
- 2024A1515010843/Guangdong Basic and Applied Basic Research Foundation
- 2023B0303000017/Guangdong Major Project of Basic and Applied Basic Research
- KCXFZ20240903092800002/Shenzhen Science and Technology Program
LinkOut - more resources
Full Text Sources
