. 2025 Aug 19;6(8):102254.
doi: 10.1016/j.xcrm.2025.102254. Epub 2025 Jul 25.

Imeglimin suppresses glucagon secretion and induces a loss of α cell identity

Affiliations

Imeglimin suppresses glucagon secretion and induces a loss of α cell identity

Takahiro Tsuno et al. Cell Rep Med. .

Abstract

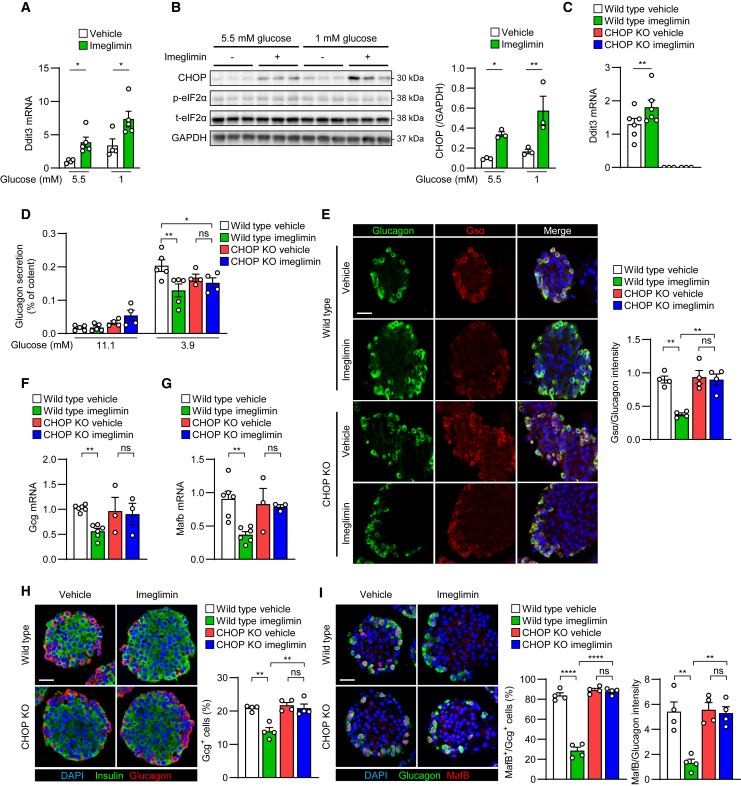
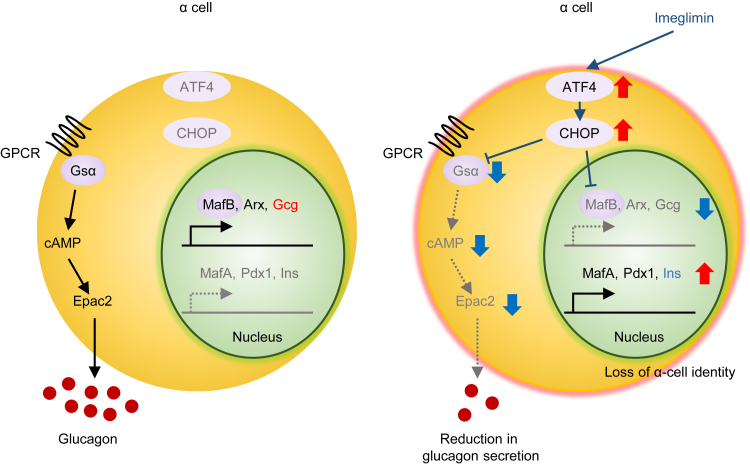
Dysregulated α cell function contributes to the development of diabetes. In this study, we find that treatment with imeglimin, an antidiabetic drug, prevents glucagon release and induces a loss of α cell identity through direct action on α cells. Mechanistically, imeglimin reduces Gsα expression to inhibit the exchange protein directly activated by cyclic adenosine monophosphate 2 (EPAC2)-mediated secretion of glucagon induced by low glucose, gastric inhibitory polypeptide (GIP), or adrenaline in an insulin-independent manner. Imeglimin also attenuates α cell Ca2+ oscillations. MafB expression is downregulated by imeglimin to induce α cell dedifferentiation. In addition, imeglimin upregulates C/EBP homologous protein (CHOP) expression, which partly contributes to the reduction in Gsα and MafB expression to reduce glucagon secretion and induce α cell reprogramming without altering protein translation. These pleiotropic effects of imeglimin on glucagon secretion and α cell identity can be recapitulated in mouse models of diabetes in vivo. These data suggest that the imeglimin-mediated regulation of α cell plasticity, particularly via glucagon suppression, may contribute to glucose homeostasis.

Keywords: C/EBP homologous protein; G protein-coupled receptor signaling; Gsα; MafB; dedifferentiation; diabetes; glucagon; human islets; imeglimin; α cells.


Conflict of interest statement

Declaration of interests The authors declare no competing interests.

Figures

None
Graphical abstract
Figure 1
Figure 1
Effects of imeglimin on glucagon secretion in islets and α cell-specific gene expression revealed by scRNA-seq (A) Left: glucagon secretion from perifused mouse islets in response to changes in glucose concentration. Perifusion was performed following a 30-min pre-incubation with 1 mM imeglimin or DMSO (vehicle). Right: quantification of glucagon secretion as the area under the curve (AUC) under the indicated glucose conditions (n = 3 per group). (B) UMAP plot of the gene expression profiles from 15,199 mouse islet cells treated with 1 mM imeglimin or DMSO (vehicle) under 3.9 mM glucose conditions for 24 h. (C) Feature plots showing the expression levels of Ins1, Gcg, Sst, and Ppy in islet cells under 3.9 mM glucose conditions. (D) UMAP plot of the gene expression profiles from 2,504 α cells, based on the threshold of glucagon gene expression under 3.9 mM glucose conditions. (E and F) Dot plots of the genes involved in enriched pathways among the differentially expressed genes (DEGs) in α cells treated with imeglimin. Pathways include endocrine system development, regulation of secretion by cell, G protein signaling pathway (E), cytoplasmic translation, and response to unfolded protein (F). (G) Gene set enrichment analysis (GSEA) of Gene Ontology terms enriched in imeglimin-treated α cells compared with vehicle-treated α cells under 3.9 mM glucose conditions. NES, normalized enrichment score. (H) Representative scatterplots of fluorescence-activated cells from Gcg-Cre; ROSA26-td-Tomato mouse islets treated with 1 mM imeglimin or DMSO (vehicle) for 24 h. (I) Relative mRNA expression levels of the indicated genes in sorted mouse α cells normalized to Tbp (n = 5 per group). Gene expression in imeglimin-treated α cells was normalized to gene expression in the corresponding vehicle-treated α cells. The data in (A) and (I) are presented as the means ± SEMs. p values were calculated using two-tailed Student’s t test. ∗∗p < 0.01, ∗∗∗p < 0.001. ns, not significant. See also Figure S1.
Figure 2
Figure 2
Inhibitory effects of imeglimin on glucagon secretion (A–G) Islets were treated with 1 mM imeglimin or DMSO (vehicle) under 3.9 mM glucose conditions for 24 h. (A) Fold change in glucagon secretion in human islets under 3.9 mM glucose conditions relative to that under 11.1 mM glucose conditions (n = 7 donors). (B) Glucagon secretion in mouse islets under 11.1 mM glucose conditions with or without 10 nM GIP or 5 μM adrenaline (n = 5 per group). (C) Left: representative immunofluorescence images of mouse islets stained for glucagon and Gsα. Gsα was detected using a knockout-validated monoclonal antibody. Right: quantification of Gsα signal intensity in glucagon-positive cells (n = 5 per group). Scale bar: 50 μm. (D) Left: schematic diagram of pharmacological interventions targeting α cell signaling pathways that modulate glucagon secretion. IR, insulin receptor. Right: glucagon secretion from mouse islets under 11.1 or 3.9 mM glucose conditions with or without 10 μM NF449, 20 μM H89, 10 μM ESI-05, or 200 nM OSI-906 (n = 5 per group). (E) Glucagon secretion from mouse islets under 11.1 or 3.9 mM glucose conditions in the presence or absence of 500 nM melittin (n = 3 per group). (F) Glucagon secretion in mouse islets under 11.1 or 3.9 mM glucose conditions. Islets were infected with adenoviruses encoding sh-Scramble or sh-Gnas for 48 h prior to imeglimin treatment (n = 4 per group). (G) Glucagon secretion in mouse islets under 11.1 or 3.9 mM glucose conditions with or without 10 μM forskolin (n = 5 per group). All the data are presented as the means ± SEMs. p values were calculated using two-tailed Student’s t test or two-way ANOVA. ∗∗p < 0.01, ∗∗∗p < 0.001, ∗∗∗∗p < 0.0001. ns, not significant. See also Figures S2 and S3.
Figure 3
Figure 3
Effects of imeglimin on cytosolic Ca2+ oscillation in α cells (A and B) Islets were treated with 1 mM imeglimin or DMSO (vehicle) under 3.9 mM glucose conditions for 24 h. (A) Upper left: schematic illustration of the Gcg-Cre; ROSA26-CAG-GCaMP6-mCherry mouse model. α cells express GCaMP6 and mCherry, whereas non-α cells do not express either. GCaMP6 fluorescence is enhanced with increasing intracellular Ca2+ concentration ([Ca2+]i). Upper right: peak interval of intracellular Ca2+ oscillations under 11.1 or 3.9 mM glucose in α cells (n = 10 per group) and the proportion of responsive α cells (n = 5 per group). Lower: representative fluorescence images of Gcg-Cre; ROSA26-CAG-GCaMP6-mCherry mouse islets, showing GCaMP6/mCherry intensity at basal and peak time points, and representative GCaMP6/mCherry fluorescence traces from three representative α cells per group indicated in Figure S2K. Scale bar: 50 μM. (B) Left: signal intensity of GCaMP6/mCherry in α cells from each group. Right: peak interval of intracellular Ca2+ oscillation under 3.9 or 11.1 mM glucose conditions in α cells (n = 10 per group) and the proportion of responsive α cells (n = 5 per group). All the data are presented as the means ± SEMs. p values were calculated using two-tailed Student’s t test or two-way ANOVA. ∗p < 0.05, ∗∗p < 0.01. ns, not significant. See also Figures S2 and S3.
Figure 4
Figure 4
Effects of imeglimin on glucagon expression, the α cell ratio, and α cell transdifferentiation in islets (A and E–K) Islets were treated with 1 mM imeglimin or DMSO (vehicle) under 3.9 (A, E, F, and I–K) or 5.5 mM (G and H) glucose conditions for 24 h. (A) Left: representative immunofluorescence images of mouse islets stained for glucagon and MafB. Right: proportion of MafB- and glucagon-positive cells and MafB signal intensity (n = 5 per group). Scale bar: 50 μm. (B) Relative mRNA expression levels of Gcg normalized to Tbp in mouse islets after treatment with 1 mM imeglimin or DMSO (vehicle) under 3.9 mM glucose conditions for the indicated durations (2 h: n = 4; other groups: n = 5). (C) Relative mRNA expression levels of Gcg normalized to Tbp in mouse islets after treatment with 1 mM imeglimin or DMSO (vehicle) under the indicated glucose concentrations for 24 h (n = 5 per group). (D) Relative mRNA expression levels of GCG normalized to GAPDH in human islets after treatment with 1 mM imeglimin or DMSO (vehicle) under the indicated glucose concentrations for 24 h (n = 11 donors). (E) Left: representative immunofluorescence images of mouse islets stained for insulin and glucagon. Right: proportion of glucagon-positive cells (n = 5 per group). Scale bar: 50 μm. (F) Left: representative immunofluorescence images of Western diet-fed mouse islets stained for insulin and glucagon. Right: proportion of glucagon-positive cells (n = 3 per group). Scale bar: 50 μm. (G) Left: representative immunofluorescence images of human islets stained for insulin and glucagon. Right: proportion of glucagon-positive cells (n = 4 donors). Scale bar: 50 μm. (H) Left: representative immunofluorescence images of hPSC-derived glucagon-producing cells stained for insulin and glucagon. Right: quantification of glucagon signal intensity (n = 3 per group). Scale bar: 50 μm. (I) Left: representative immunofluorescence images of mouse islets. Right: proportion of insulin- and glucagon-double-positive cells among glucagon-positive cells (n = 5 per group). The arrowheads indicate insulin- and glucagon-double-positive cells. Scale bar: 50 μm. (J) Left: schemes showing the construction of the Gcg-Cre; ROSA26-mT/mG mice. Gcg/α-lineage cells were labeled with membrane-targeted EGFP, and non-α cell-derived cells expressed membrane-targeted td-Tomato. Center: representative immunofluorescence images of Gcg-Cre; ROSA26-mT/mG mouse islets stained for insulin. Right: proportion of insulin- and membrane-targeted EGFP-positive cells (n = 5 per group). The arrowheads indicate cells positive for both insulin and membrane-bound EGFP. Scale bar: 25 μm. (K) Upper: representative images of scWest chips from single-cell western blot analysis of mouse islet cells. Lower: insulin signal intensity of insulin- and glucagon-double-positive cells (vehicle: n = 111 cells; imeglimin: n = 187 cells). The data in (A)–(C), (E), (F), and (H)–(J) are presented as the means ± SEMs. The data in (D) and (G) are shown as paired dot plots for each donor or batch. The data in (K) are presented as violin plots with lines indicating quartiles. p values were calculated using two-tailed Student’s t test. ∗p < 0.05, ∗∗p < 0.01, ∗∗∗p < 0.001, ∗∗∗∗p < 0.0001. See also Figures S3 and S4.
Figure 5
Figure 5
Induction of CHOP expression in α cells by imeglimin and the effects of CHOP deficiency (A and B) αTC1-6 cells were treated with 1 mM imeglimin or DMSO (vehicle) for 24 h. (A) Relative Ddit3 mRNA expression levels normalized to Tbp (vehicle: n = 4; imeglimin: n = 5). (B) Left: western blot analysis of the indicated proteins. Right: quantification of the intensity of the signals by densitometry (n = 3 per group). (C–I) Islets from CHOP-knockout mice or wild-type (WT) mice were treated with 1 mM imeglimin or DMSO (vehicle) under 3.9 mM glucose conditions for 1 h (D) or 24 h (C), (E–I). (C) Relative Ddit3 mRNA expression levels normalized to Tbp (WT: n = 6; CHOP-KO: n = 3). (D) Glucagon secretion from islets (WT: n = 5; CHOP-KO: n = 4). (E) Left: representative immunofluorescence images of islets stained for glucagon and Gsα. Right: Gsα signal intensity in glucagon-positive cells (n = 4 per group). Scale bar: 25 μm. (F and G) Relative mRNA expression levels of Gcg (F) and Mafb (G) normalized to Tbp in islets (WT: n = 6; CHOP-KO: n = 3). (H) Left: representative immunofluorescence images of islets stained for insulin and glucagon. Right: proportion of glucagon-positive cells (n = 4 per group). Scale bar: 25 μm. (I) Left: representative immunofluorescence images of islets stained for glucagon and MafB. Right: proportion of MafB- and glucagon-positive cells and MafB signal intensity (n = 4 per group). Scale bar: 25 μm. All the data are presented as the means ± SEMs. p values were calculated using two-tailed Student’s t test, two-way ANOVA, or one-way ANOVA. ∗p < 0.05, ∗∗p < 0.01, ∗∗∗∗p < 0.0001. ns, not significant. See also Figures S5 and S6.
Figure 6
Figure 6
Effects of imeglimin administration on α cells in db/db and Akita mice (A–C) Serum insulin levels (A), serum glucagon levels (B), and the serum glucagon/insulin ratio (C) in db/db mice treated with or without imeglimin and in db/+ control mice (n = 6 per group). (D) Left: representative immunofluorescence images of pancreas sections from the indicated mice stained for insulin and glucagon. Right: proportion of glucagon-positive cells among insulin-positive cells (n = 4 per group). Scale bar: 50 μm. (E) Left: representative immunofluorescence images of pancreas sections from the indicated mice stained for glucagon and CHOP. Right: proportion of glucagon- and CHOP-positive cells relative to glucagon-positive cells (n = 4 per group). Scale bar: 50 μm. (F–H) Serum insulin levels (F), serum glucagon levels (G), and the serum glucagon/insulin ratio (H) in Akita mice treated with or without imeglimin or in wild-type (WT) mice (WT: n = 3; other groups: n = 4). (I) Left: representative immunofluorescence images of pancreas sections from the indicated mice stained for insulin and glucagon. Right: proportion of glucagon-positive cells relative to insulin-positive cells (WT: n = 3; other groups: n = 4). Scale bar: 50 μm. (J) Left: representative immunofluorescence images of pancreas sections from the indicated mice stained for glucagon and CHOP. Right: proportion of glucagon- and CHOP-positive cells among glucagon-positive cells (WT: n = 3; other groups: n = 4). Scale bar: 50 μm. All the data are presented as the means ± SEMs. p values were calculated using one-way ANOVA. ∗p < 0.05, ∗∗p < 0.01, ∗∗∗p < 0.001, ∗∗∗∗p < 0.0001. See also Figure S7.
Figure 7
Figure 7
Proposed model of the effects of imeglimin on pancreatic α cells Schematic illustration of the regulatory effects of imeglimin on glucagon secretion and α cell transdifferentiation. Imeglimin increases the expression of ATF4 and CHOP in α cells, which suppresses glucagon secretion through a reduction in Gsα, cAMP, and Epac2 signaling. Concurrently, CHOP downregulates MafB expression, leading to decreased expression of Arx and glucagon, and upregulation of MafA, Pdx1, and insulin. These molecular changes collectively promote the transdifferentiation of α cells into β-like cells.

References

    1. Perry R.J., Cardone R.L., Petersen M.C., Zhang D., Fouqueray P., Hallakou-Bozec S., Bolze S., Shulman G.I., Petersen K.F., Kibbey R.G. Imeglimin lowers glucose primarily by amplifying glucose-stimulated insulin secretion in high-fat-fed rodents. Am. J. Physiol. Endocrinol. Metab. 2016;311:E461–E470. doi: 10.1152/ajpendo.00009.2016. - DOI - PMC - PubMed
    1. Hallakou-Bozec S., Kergoat M., Fouqueray P., Bolze S., Moller D.E. Imeglimin amplifies glucose-stimulated insulin release from diabetic islets via a distinct mechanism of action. PLoS One. 2021;16 doi: 10.1371/journal.pone.0241651. - DOI - PMC - PubMed
    1. Li J., Inoue R., Togashi Y., Okuyama T., Satoh A., Kyohara M., Nishiyama K., Tsuno T., Miyashita D., Kin T., et al. Imeglimin Ameliorates beta-Cell Apoptosis by Modulating the Endoplasmic Reticulum Homeostasis Pathway. Diabetes. 2022;71:424–439. doi: 10.2337/db21-0123. - DOI - PubMed
    1. Nishiyama K., Ono M., Tsuno T., Inoue R., Fukunaka A., Okuyama T., Kyohara M., Togashi Y., Fukushima S., Atsumi T., et al. Protective Effects of Imeglimin and Metformin Combination Therapy on beta-Cells in db/db Male Mice. Endocrinology. 2023;164 doi: 10.1210/endocr/bqad095. - DOI - PubMed
    1. Vial G., Chauvin M.A., Bendridi N., Durand A., Meugnier E., Madec A.M., Bernoud-Hubac N., Pais de Barros J.P., Fontaine É., Acquaviva C., et al. Imeglimin normalizes glucose tolerance and insulin sensitivity and improves mitochondrial function in liver of a high-fat, high-sucrose diet mice model. Diabetes. 2015;64:2254–2264. doi: 10.2337/db14-1220. - DOI - PubMed