. 2025 Sep:120:107470.
doi: 10.1016/j.ultsonch.2025.107470. Epub 2025 Jul 18.

Theoretical modeling and experimental validation of laser-generated focused ultrasound and micro-cavitation dynamics

Affiliations

Theoretical modeling and experimental validation of laser-generated focused ultrasound and micro-cavitation dynamics

Min Gyu Joo et al. Ultrason Sonochem. 2025 Sep.

Abstract

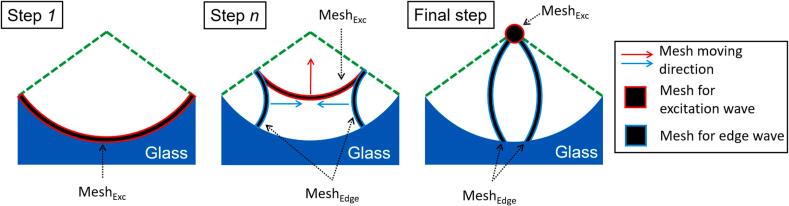
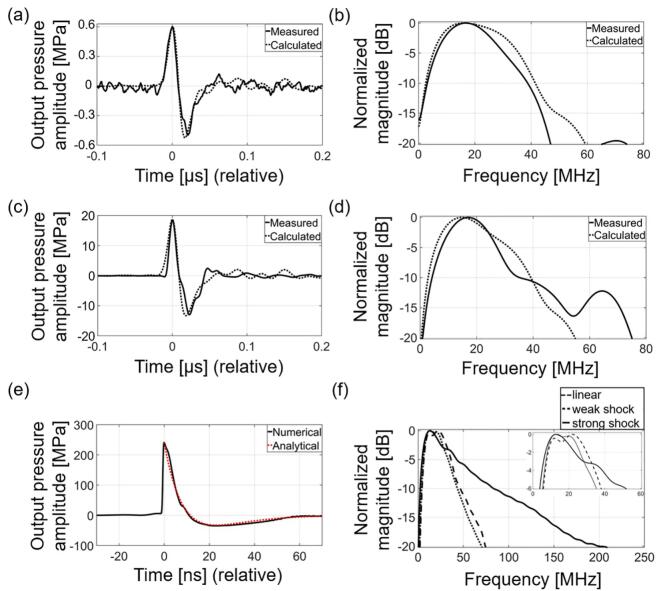
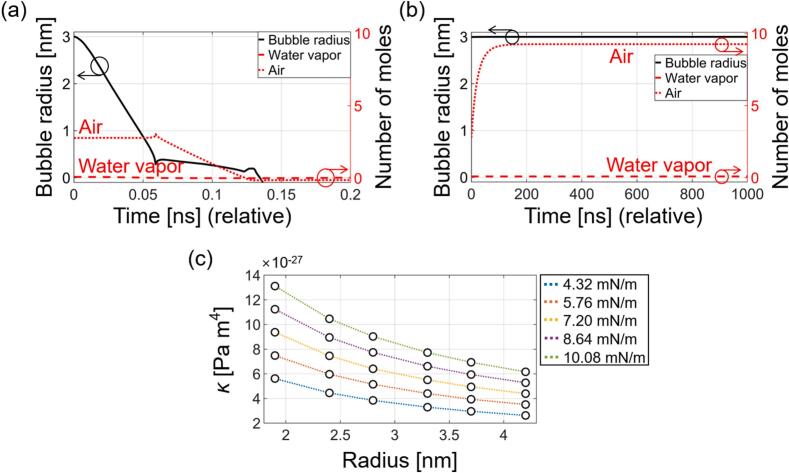
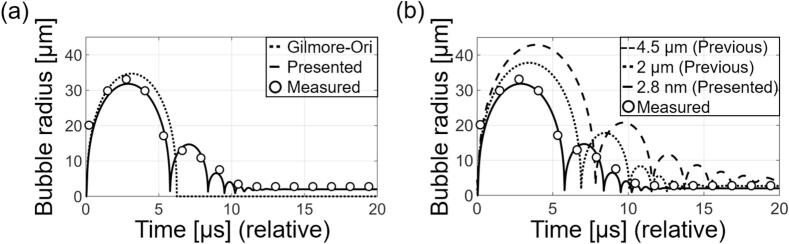
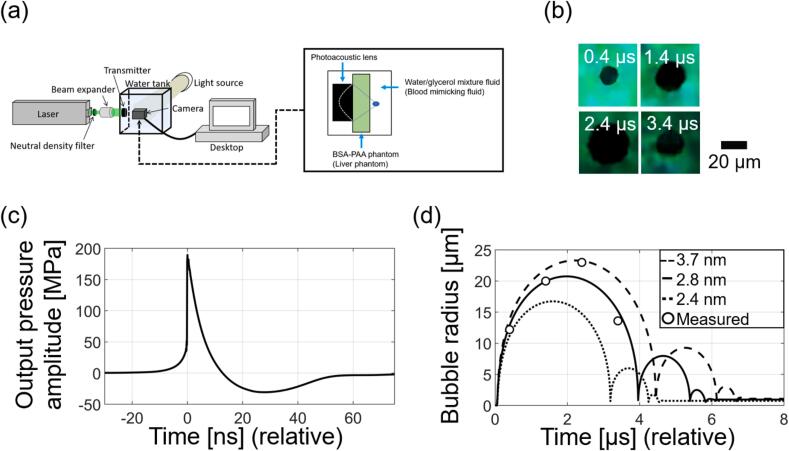
This study presents a fully coupled numerical simulation method for modeling the behavior of laser-generated focused ultrasound (LGFU) in complex structures, including in vivo environments. Using finite element method (FEM) simulations, we achieve peak pressures of 241 MPa and 34.7 MPa in the positive and negative phases, respectively, of the LGFU waveform. The use of adaptive mesh refinement (AMR) enables us to perform tight mesh simulations with a size of 0.06 μm and calculate ultrafast rise time (0.8 ns) of the LGFU wavefront. We also propose an improved LGFU-induced bubble model that can simulate nano-sized seed bubbles, which is achieved by combining the Gilmore equation with heat and mass transfer and modified Young-Laplace (MY-L) equations. We demonstrate the effectiveness of the model by validating it against experimental results in water, where we achieve a 29.6 % improvement in maximum bubble size and a 34.5 % improvement in bubble lifetime compared to the previous model. Furthermore, we apply the model to a tissue mimicking phantom and obtain results that are consistent with experimental observations. Our proposed simulation method provides a powerful tool for investigating LGFU-induced bubble behavior in complex structures, which could have important applications in fields such as biomedical engineering. © 2017 Elsevier Inc. All rights reserved.

Keywords: Bubble dynamics; Cavitation; Finite element method; Laser-generated focused ultrasound; Photoacoustics; Shockwave.


Conflict of interest statement

Declaration of competing interest The authors declare the following financial interests/personal relationships which may be considered as potential competing interests: Hyoung Won Baac reports that equipment, drugs, or supplies were partly provided by Kyunghee University College of Engineering. Hyoung Won Baac reports that equipment, drugs, or supplies were partly provided by Korea Institute of Science and Technology. If there are other authors, they declare that they have no known competing financial interests or personal relationships that could have appeared to influence the work reported in this paper.

Figures

Fig. 1
Fig. 1
(a) A schematic of CNT-PDMS layer with an incident laser pulse. As the laser passes through the light-absorbing layer, it exponentially decays; (b) The simulation domain for LGFU propagation. The excitation and edge waves propagate toward the focus, causing the positive and negative phases of LGFU. Due to the geometrical properties of lens, such as the focal length and diameter, the radial angle at the center is 60.4° from the axis.
Fig. 2
Fig. 2
The schematics of the AMR process in three steps: first, intermediate, and final. The black solid regions with the red and blue outer lines enclose the meshes for excitation (MeshExc) and the edge waves (MeshEdge), respectively. The green dotted line shows the direction of LGFU propagation from the CNT-PDMS lens to the focus.
Fig. 3
Fig. 3
Schematics of an experimental setup are presented for (a) measuring LGFU waveforms and (b) capturing the bubble dynamics induced by LGFU. To capture the bubble dynamics, both a laser-flash shadowgraph and a high-speed camera were utilized; Abbreviations: NDF: neutral density filter, BE: beam expander, PT: photoacoustic transmitter, WT: water tank, DO: digital oscilloscope, LS: light source, FC: fiber coupler, PD: photodetector, and LD: laser diode.
Fig. 4
Fig. 4
The LGFU waveforms ((a), (c), and (e)) and their frequency spectra ((b), (d), and (f)). (a) The simulated and measured waveform of LGFU-NS with the laser fluence of 0.03mJ/cm2 and (b) their frequency spectra; (c) The simulated and measured waveform of LGFU-WS with the laser fluence of 0.95mJ/cm2 and (d) their frequency spectra. The simulated waveforms for LGFU-NS and LGFU-WS are convoluted with FOPH responses; (e) The waveform of LGFU-SS with the laser fluence of 11.19mJ/cm2. The numerically (black solid line) and analytically (red dotted line) obtained LGFU-SS waveforms are compared; (f) The frequency spectra for all regimes corresponding to the free boundary waveform, each of which was normalized by the magnitude at the center frequency. Each figure has different scale in terms of pressure amplitude and frequency range.
Fig. 5
Fig. 5
The simulation results for bubble behavior in water, including size and the number of molecules inside the bubble without external acoustic pressures. The data was obtained using two models: (a) the Gilmore-HM model and (b) the Gilmore-HM-MY-L model. In both cases, a seed bubble with a radius of 2.8 nm and containing 2.29 mol of air and 0.05 mol of water vapor was used; (c) Dependence of κ on bubble radius under varying surface tension conditions.
Fig. 6
Fig. 6
The effects of LGFU-SS on bubble behavior in degassed water were examined using a laser fluence of 11.19mJ/cm2. (a) High-speed camera images for the free-boundary cavitation bubbles, using the experimental setup depicted in Fig. 3(b). The images are plotted with a time interval of 1.28 μs. The red circles indicate bubbles that remained in water after reverberation; (b) The experimentally obtained bubble radius (black circles) with error bars (green bars) from 10 photographs compared with the simulated bubble radius (black line). The red dotted line represents the end of the bubble reverberation, which occurred at 11 μs; (c) The simulated variation of molecules of water vapor (black solid line) and air (black dotted line) inside the bubble.
Fig. 7
Fig. 7
The simulated bubble behaviors obtained from different models along with black circles representing the measured bubble sizes. (a) A comparison between the Gilmore-Ori and the Gilmore-HM-MY-L models with a seed bubble of radius 2.8 nm; (b) A comparison between the Gilmore-HM and the Gilmore-HM-MY-L model with seed bubbles of radii 2 μm and 4.5 μm used for the former and a 2.8 nm-seed bubble used for the latter.
Fig. 8
Fig. 8
The results of the ex-vivo experiment (a) The schematic of the experimental setup. A laser with a fluence of 11.19mJ/cm2 was used to irradiate the LGFU lens with a diameter of 20 mm and a focal length of 11.5 mm. The medium for wave propagation was alternated by a blood-mimicked liquid. A liver-mimicked phantom was filled between the LGFU lens and its focus. Bubble detection was performed using laser-flash shadowgraph; (b) Laser-flash shadowgraph images for cavitation bubbles in the blood-mimicked liquid. Images were captured at 1 μs intervals, starting from 0.4 μs after laser irradiation; (c) The LGFU-SS waveform obtained from the ex-vivo environment; (d) Bubble behaviors with different nuclei sizes, based on the Gilmore-HM-MY-L model in the blood-mimicked liquid environment.

Similar articles

References

    1. Hijnen N.M., Hejiman E., Köhler M.O., Ylihautala M., Ehnholm G.J., Simonetti A.W., Grüll H. Tumour hyperthermia and ablation in rats using a clinical MR-HIFU system equipped with a dedicated small animal set-up. Int. J. Hyperther. 2012;28(2):141. - PubMed
    1. Liang H.D., Tang J., Halliwell M. Sonoporation, drug delivery, and gene therapy. Proc. Inst. Mech. Eng. H J. Eng. Med. 2010;224(2):343–361. - PubMed
    1. Maxwell A.D., Cain C.A., Duryea A.P., Yuan L., Gurm H.S., Xu Z. Noninvasive thrombolysis using pulsed ultrasound cavitation therapy – histotripsy. Ultrasound Med. Biol. 2009;35(12):1982. - PMC - PubMed
    1. Maxwell A.D., Wang T.-Y., Cain C.A., Fowlkes J.B., Sapozhnikov O.A., Bailey M.R. Cavitation clouds created by shock scattering from bubbles during histotripsy. J. Acoust. Soc. Am. 2011;130(4):1888. - PMC - PubMed
    1. Lingeman J.E., McAteer J.A., Gnessin E., Evan A.P. Shock wave lithotripsy: advances in technology and technique. Nat. Rev. Urology. 2009;6:660. - PMC - PubMed

LinkOut - more resources