

A robust machine learning model based on ribosomal-subunit-derived piRNAs for diagnostic potential of nonsmall cell lung cancer across multicentre, large-scale of sequencing data
- PMID: 40714929
- PMCID: PMC12410371
- DOI: 10.1002/ctm2.70418
A robust machine learning model based on ribosomal-subunit-derived piRNAs for diagnostic potential of nonsmall cell lung cancer across multicentre, large-scale of sequencing data
Abstract
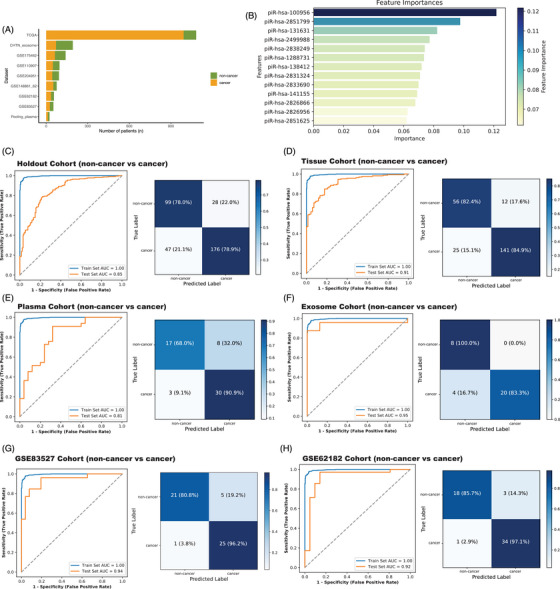
Nonsmall cell lung cancer (NSCLC) is a lethal cancer and lacks robust biomarkers for noninvasive clinical diagnosis. Detecting NSCLC at the early stage can decrease the mortality rate and minimise harm caused by various treatments. We curated 2050 samples from public tissue and plasma datasets including both invasive and noninvasive types, then supplemented with in-house pooled plasma and exosome samples. Eleven independent transcriptome datasets were utilised to develop a new machine learning model by integrating PIWI-interacting RNA (piRNA) to predict NSCLC. Five piRNA signatures derived from ribosomal subunits identified to be tumour-specific exhibited robust diagnostic ability and were combined into a piRNA-Based Tumour Probability Index (pi-TPI) risk evaluation model. pi-TPI effectively distinguished NSCLC patients from healthy individuals and showed efficacy in identifying early-stage cancers with Area under the ROC Curve (AUC) values over .80. Plasma cohorts exhibited the diagnosis efficacy of pi-TPI with an AUC value of .85. Experimental exosomal data enhances the accuracy of diagnosing noncancerous, benign, and cancer cases. The pi-TPI marker in the noncancer/cancer subgroup exhibited superior predictive performance with an AUC value of .96. These findings underscore the significant clinical potential of the five piRNA signatures as a powerful diagnostic tool for NSCLC, particularly of noninvasive cancer diagnostics.
Keywords: PIWI‐interacting RNA; machine learning; noninvasive diagnosis; nonsmall cell lung cancer; small noncoding RNA.
© 2025 The Author(s). Clinical and Translational Medicine published by John Wiley & Sons Australia, Ltd on behalf of Shanghai Institute of Clinical Bioinformatics.
Conflict of interest statement
Jeffrey A Borgia is on the scientific advisory board for the Luminex Corporation and Rational Vaccines, Inc. and gets paid as a consultant with both.
Figures


Similar articles
-
Liquid biopsy diagnostics for non-small cell lung cancer via elucidation of tRNA signatures.Commun Med (Lond). 2025 Aug 21;5(1):364. doi: 10.1038/s43856-025-01068-2. Commun Med (Lond). 2025. PMID: 40841456 Free PMC article.
-
Next-Generation Sequencing-Based Testing Among Patients With Advanced or Metastatic Nonsquamous Non-Small Cell Lung Cancer in the United States: Predictive Modeling Using Machine Learning Methods.JMIR Cancer. 2025 Jun 11;11:e64399. doi: 10.2196/64399. JMIR Cancer. 2025. PMID: 40497643 Free PMC article.
-
Identification of blood-derived exosomal tumor RNA signatures as noninvasive diagnostic biomarkers for multi-cancer: a multi-phase, multi-center study.Mol Cancer. 2025 Mar 1;24(1):60. doi: 10.1186/s12943-025-02271-4. Mol Cancer. 2025. PMID: 40025576 Free PMC article.
-
PET-CT for assessing mediastinal lymph node involvement in patients with suspected resectable non-small cell lung cancer.Cochrane Database Syst Rev. 2014 Nov 13;2014(11):CD009519. doi: 10.1002/14651858.CD009519.pub2. Cochrane Database Syst Rev. 2014. PMID: 25393718 Free PMC article.
-
Intraoperative frozen section analysis for the diagnosis of early stage ovarian cancer in suspicious pelvic masses.Cochrane Database Syst Rev. 2016 Mar 1;3(3):CD010360. doi: 10.1002/14651858.CD010360.pub2. Cochrane Database Syst Rev. 2016. PMID: 26930463 Free PMC article.
References
-
- Siegel RL, Giaquinto AN, Jemal A. Cancer statistics, 2024. CA Cancer J Clin. 2024;74:12‐49. - PubMed
Publication types
MeSH terms
Substances
Grants and funding
- 1OT2OD032581-02-997/NH/NIH HHS/United States
- OT2OD032581/NH/NIH HHS/United States
- U54 MD007601/MD/NIMHD NIH HHS/United States
- U54 HG013243/HG/NHGRI NIH HHS/United States
- RCC-004UHI-Pilot/NH/NIH HHS/United States
- 1OT2OD032581-02-PP90Y/NH/NIH HHS/United States
- P30 CA071789/CA/NCI NIH HHS/United States
- U54HG013243/NH/NIH HHS/United States
- U54MD007601/NH/NIH HHS/United States
- R01CA230514/NH/NIH HHS/United States
- R01 CA230514/CA/NCI NIH HHS/United States
- P20 GM103466/GM/NIGMS NIH HHS/United States
- P20 GM139753/GM/NIGMS NIH HHS/United States
- R01CA223490/NH/NIH HHS/United States
- T32DK137523/NH/NIH HHS/United States
- P20GM139753/NH/NIH HHS/United States
- P30 GM114737/GM/NIGMS NIH HHS/United States
- U54 GM138062/GM/NIGMS NIH HHS/United States
- U24 MD015970/MD/NIMHD NIH HHS/United States
- P20GM103466/NH/NIH HHS/United States
- T32 DK137523/DK/NIDDK NIH HHS/United States
- OT2 OD032581/OD/NIH HHS/United States
- 1OT2OD032581-02-824/NH/NIH HHS/United States
- UE5 HG013826/HG/NHGRI NIH HHS/United States
- U24MD015970/NH/NIH HHS/United States
- P30GM114737/NH/NIH HHS/United States
- UE5HG013826/NH/NIH HHS/United States
- U54GM138062/NH/NIH HHS/United States
- 3OT2OD032581-01S5-895/NH/NIH HHS/United States
- R01 CA223490/CA/NCI NIH HHS/United States
- P30CA071789/NH/NIH HHS/United States
LinkOut - more resources
Full Text Sources
Medical
Research Materials
Miscellaneous