. 2025 Jul 27;11(1):346.
doi: 10.1038/s41420-025-02630-6.

IL-33-primed NLRP3 inflammasome in basophils drives IL-1β production and initiates atopic dermatitis inflammation

Affiliations

IL-33-primed NLRP3 inflammasome in basophils drives IL-1β production and initiates atopic dermatitis inflammation

Yoshitaka Gunji et al. Cell Death Discov. .

Abstract

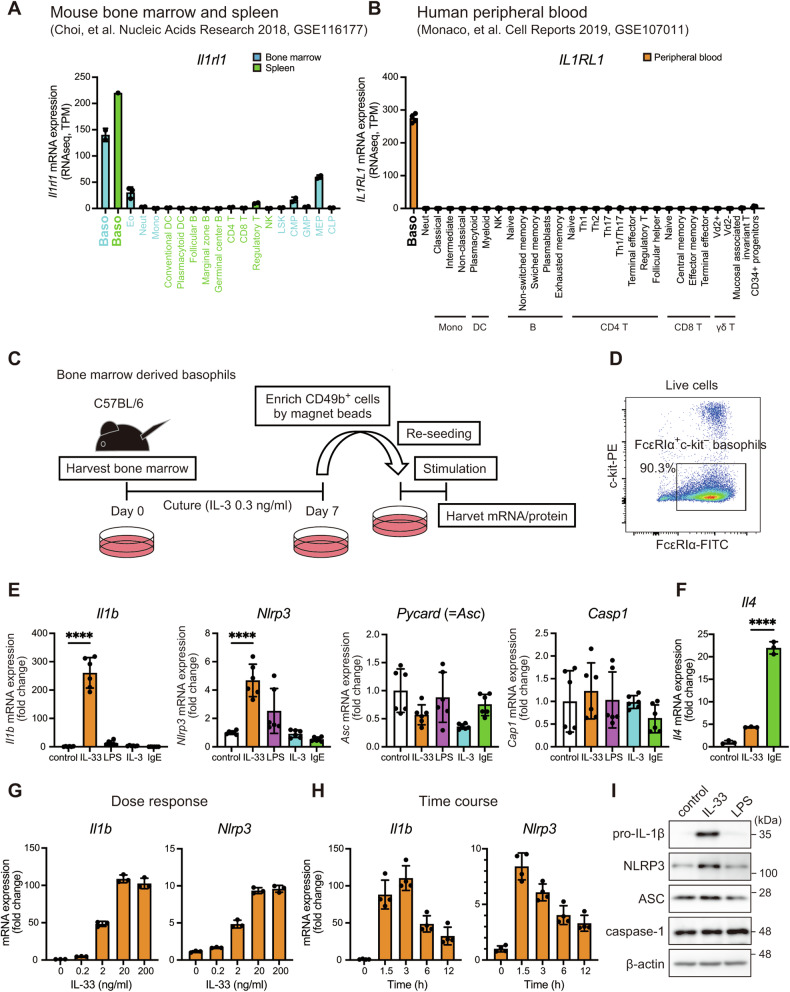
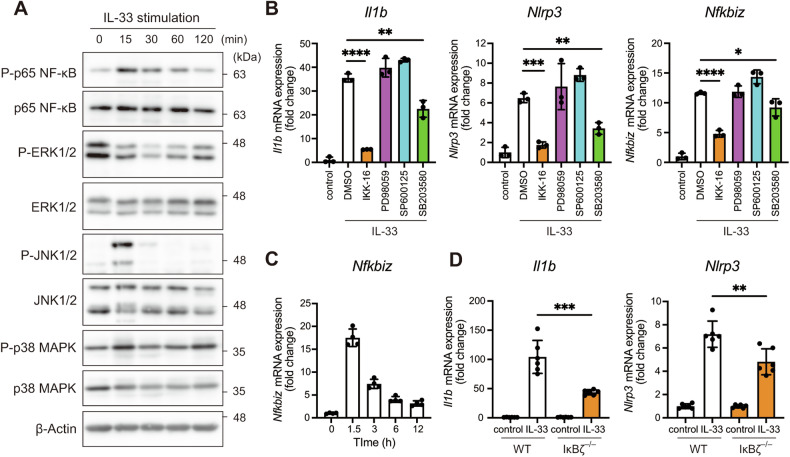
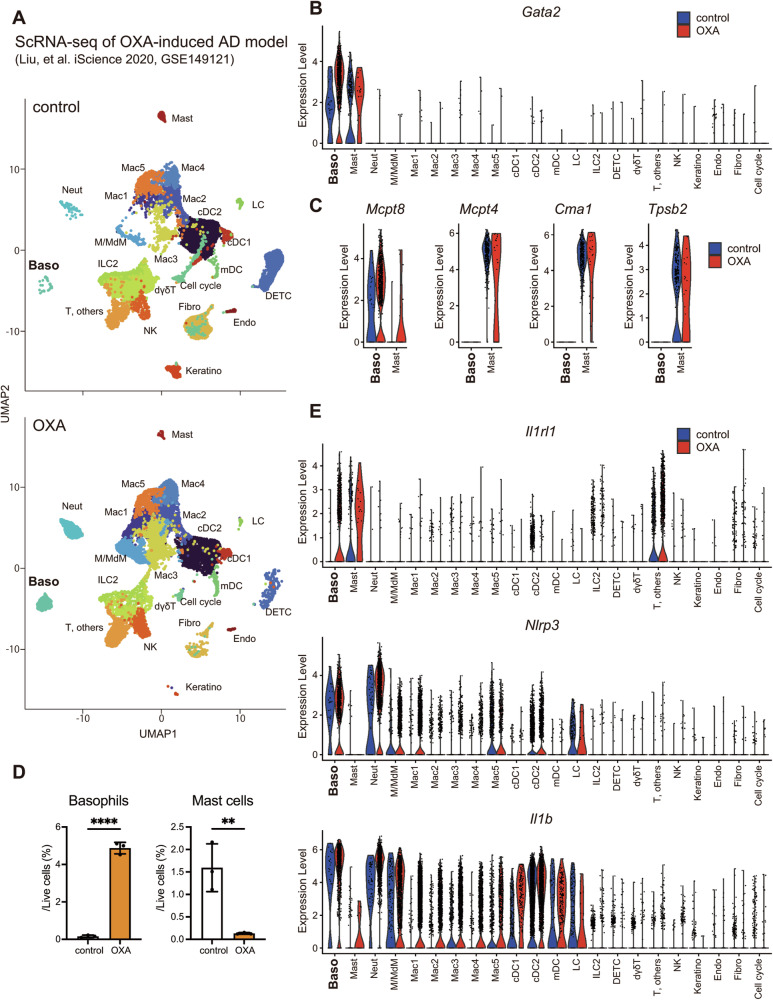
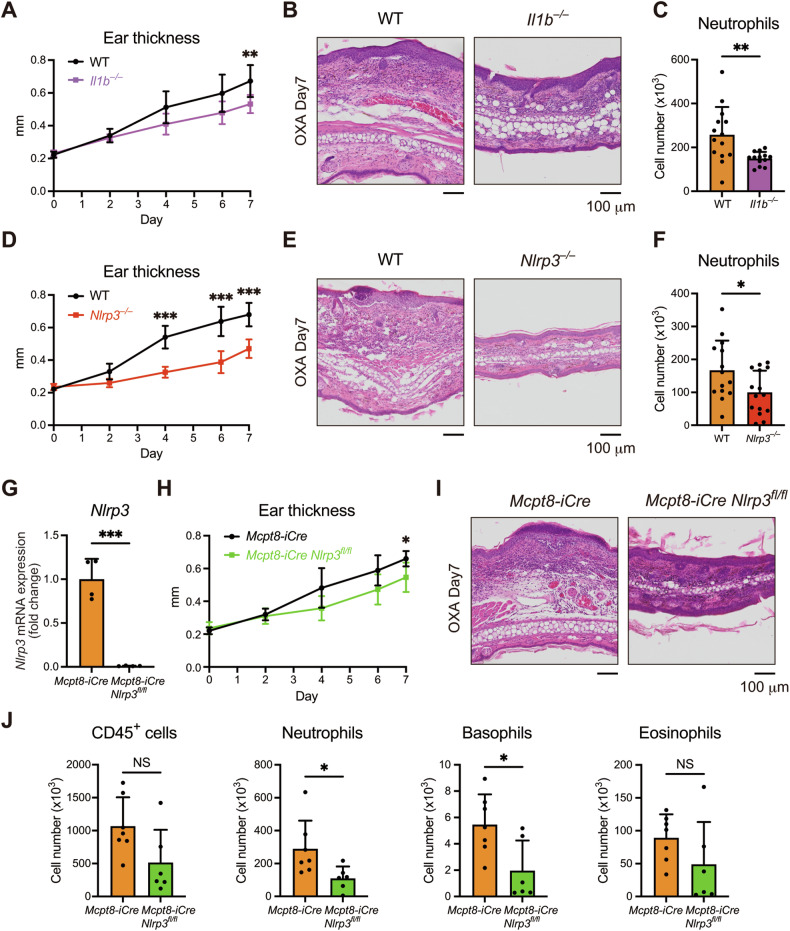
Atopic dermatitis (AD) is a chronic inflammatory skin disorder caused by immune dysregulation that involves the release of various pro-inflammatory cytokines. Patients with AD frequently exhibit basophil infiltration in the affected skin. Although the role of the NLRP3 inflammasome in innate immune cells has been extensively studied, the contribution of the basophil inflammasome to the pathophysiology of AD remains to be elucidated. In this study, we demonstrated that IL-33 primes the NLRP3 inflammasome in basophils, leading to the production and release of mature IL-1β. Mechanistically, we showed that IL-33 stimulation induced pro-IL-1β and NLRP3 expression via the NF-κB and p38 MAPK pathways and that basophils released mature IL-1β through the canonical inflammasome activation pathway, which requires NLRP3, ASC, caspase-1, and gasdermin D (GSDMD). In an oxazolone (OXA)-induced AD mouse model, we found that basophils acted as key initiators of inflammation by producing IL-1β in the lesion, and that basophil depletion, genetic ablation of Nlrp3 or Il1b, or basophil-specific genetic ablation of Nlrp3 ameliorated ear swelling and neutrophil infiltration. Collectively, these findings establish basophils as a significant early source of NLRP3 inflammasome-driven IL-1β, contributing to the pathogenesis of AD. Targeting the IL-33/ST2L axis or NLRP3 inflammasome activation in basophils may offer a promising therapeutic strategy for managing AD.


Conflict of interest statement

Competing interests: The authors declare no competing interests. Ethics approval: All animal experiments were approved by the Use and Care of Experimental Animals Committee of Jichi Medical University (permission number 20116-02) and were carried out following Jichi Medical University guidelines.

Figures

Fig. 1
Fig. 1. IL-33 serves as a priming signal for NLRP3 inflammasome in basophils.
A An analysis of publicly available RNA-seq data (GSE116117) showing mRNA expression in mouse bone marrow and spleen (n = 1 for basophils of spleen, n = 3 for eosinophils, and n = 2 for others. P < 0.0001 by a one-way ANOVA). B An analysis of publicly available RNA-seq data showing mRNA expression in human peripheral blood (n = 2 for CD4+ terminal effector T cells, and n = 4 for others. P < 0.0001 by a one-way ANOVA). C Experimental design. Bone marrow cells were cultured in the presence of IL-3 (0.3 ng/ml) for 7 days, and CD49b+ cells were isolated. D The percentage of FcεRIα+ and c-kit (basophils) was analyzed by flow cytometry. E The expression of Il1b, Nlrp3, Pycard, and Casp1 in BMBAs stimulated with IL-33 (20 ng/ml), LPS (300 ng/ml), IL-3 (20 ng/ml), or TNP-OVA (10 ng/ml) was assessed by real-time RT-PCR (n = 6). F The Il4 expression in BMBAs stimulated with IL-33 or TNP-OVA was assessed by real-time RT-PCR (n = 3). G, H The expression of Il1b and Nlrp3 in BMBAs stimulated with IL-33 was assessed by real-time RT-PCR (G: dose-response, n = 3; H: time course, n = 4). Data are expressed as dot plots with the mean ± SD. *P < 0.05, **P < 0.01, ***P < 0.001, ****P < 0.0001. I The protein levels of pro-IL-1β, NLRP3, ASC, caspase-1, and β-actin were assessed by immunoblotting.
Fig. 2
Fig. 2. IL-33 acts as a priming signal for NLRP3 inflammasome in lung basophils in vivo.
A Publicly available scRNA-seq data (GSE119228) were reanalyzed. Differential gene expression between 30 h postnatal lung basophils from WT versus Il1rl1–/– mice are shown (x-axis). Adjusted p values are shown (y-axis). B Violin plots showing the expression of Il1b, Nlrp3, Cd69, Nfkbia, Nfkbiz, and Il4 in WT and Il1rl1–/– basophils are shown. C Experimental design. D The percentages of basophils among CD45⁺ cells in the control and IL-33-treated groups are shown (n = 3). E Intracellular IL-1β expression in basophils and eosinophils of the lungs was analyzed by flow cytometry. The ratios of IL-1β+ basophils and eosinophils are shown (n = 3). Data are expressed as dot plots with the mean ± SD. *P < 0.05.
Fig. 3
Fig. 3. IL-33 elevates Il1b and Nlrp3 expression through NF-κB and p38 MAPK pathways.
A BMBAs were stimulated with IL-33 for the indicated periods. The levels of P-p65 NF-κB, p65 NF-κB, P-ERK1/2, ERK1/2, P-JNK1/2, JNK1/2, P-p38 MAPK, p38 MAPK, and β-actin were assessed by immunoblotting. B BMBAs were pretreated with DMSO, IKK-16 (2 mM), PD98059 (10 mM), SP600125 (10 mM), and SB203580 (10 mM) and then stimulated with IL-33. The expression of Il1b, Nlrp3, Nfkbia, and Nfkbiz was assessed by real-time RT-PCR (n = 3). C The expression of Nfkbiz in BMBAs stimulated with IL-33 for the indicated periods was assessed by real-time RT-PCR (n = 4). D BMBAs from WT and Mx1-Cre Nfkbiz flox/flox mice were stimulated with IL-33. The expression of Il1b and Nlrp3 was assessed by real-time RT-PCR. Data are expressed as dot plots with the mean ± SD. *P < 0.05, **P < 0.01, ***P < 0.001, ****P < 0.0001.
Fig. 4
Fig. 4. Basophils produce mature IL-1β through NLRP3 inflammasome.
A, B BMBAs primed with IL-33 for 6 h were stimulated with nigericin (10 mM) for 1 h. Cell lysates and supernatants were prepared. The protein levels of pro-IL-1β, mature IL-1β, and β-actin were assessed by immunoblotting (A). B IL-1β levels in the supernatants were assessed by an ELISA (n = 4). C BMBAs primed with IL-33 for 18 h were stimulated with ATP (5 mM) for 3 or 12 h. IL-1β levels in the supernatants were assessed (n = 4). D BMBAs primed with IL-33 for 6 h were stimulated with nigericin for 1 h or TNP-OVA for 3 h. IL-1β levels in the supernatants were assessed (n = 3). E IL-1β levels in the supernatants of WT, Nlrp3–/–, Asc–/–, and Casp1/11–/– BMBAs were assessed (n = 4). F IL-1β levels in the supernatants of WT and Gsdmd–/– BMBAs were assessed (n = 4). G IL-1β levels in the supernatants of BMBAs and BMDMs were assessed (n = 3). H IL-1β levels in the supernatants of BMBAs and neutrophils were assessed (n = 4). I Neutrophils primed with LPS or Pam3CSK4 for 6 h were stimulated with nigericin for 1 h. IL-1β levels in the supernatants of neutrophils were assessed (n = 4). Data are expressed as dot plots with the mean ± SD. *P < 0.05, **P < 0.01, ***P < 0.001, ****P < 0.0001.
Fig. 5
Fig. 5. Basophils are recruited and enhance Il1b expression in an AD mouse model.
A Publicly available scRNA-seq data (GSE149121) were reanalyzed. UMAP plot of the control (ethanol-treated) and OXA-treated skin samples are shown. Colors represent different Seurat clusters. B Violin plots showing the expression of Gata2 in control and OXA-treated skin samples are shown. C Violin plots showing the expression of Mcpt8, Mcpt4, Cma1, and Tpsb2 in control and OXA-treated skin samples are shown. D The ratios of basophils and mast cells in the ear skin samples are shown (n = 3). Data are expressed as dot plots with the mean ± SD. *P < 0.05, **P < 0.01, ***P < 0.001, ****P < 0.0001. E Violin plots showing the expression of Il1rl1, Nlrp3, and Il1b in control and OXA-treated skin samples are shown.
Fig. 6
Fig. 6. Deletion of basophils ameliorates the inflammation in the AD model.
A Experimental design. B The number of basophils and neutrophils of the ear skin samples on day 7 is shown (n = 4). C Intracellular IL-1β expression in basophils of the ear skin samples was analyzed by flow cytometry. The ratio of IL-1β+ basophils is shown (n = 4). D On day 2, mice were intraperitoneally injected with either an isotype control or anti-IL-33 neutralizing antibody. The time course of ear thickening is shown (n = 4). E, F The number of neutrophils and IL-1β levels in the ear skin samples on day 7 is shown (n = 4). G The number of basophils in the ear skin samples on day 7 is shown (n = 4 for WT, n = 3 for Mcpt8-DTR mice). H The time course of ear thickening in WT and Mcpt8-DTR mice is shown (n = 6 for WT, n = 7 for Mcpt8-DTR mice). I Representative HE staining of ear samples from WT and Mcpt8-DTR mice is shown. J The number of neutrophils in the ear skin samples on day 7 is shown (n = 6 for WT, n = 5 for Mcpt8-DTR mice). K IL-1β levels in the ear skin samples on day 7 were assessed (n = 4). L The expression of Il1b, Cxcl1, Cxcl2, Cxcl5, and Tnf in the ear skin samples on day 7 was assessed by real-time RT-PCR (n = 4). Data are expressed as dot plots with the mean ± SD. *P < 0.05, **P < 0.01, ***P < 0.001.
Fig. 7
Fig. 7. NLRP3 inflammasome in basophils contributes to neutrophilic inflammation in the AD model.
A The time course of ear thickening in WT and Il1b–/– mice is shown (n = 9 for each). B Representative HE staining of ear samples from WT and Il1b–/– mice is shown. C The number of neutrophils in the ear skin samples on day 7 is shown (n = 14 for WT, 13 for Il1b–/– mice). D The time course of ear thickening in WT and Nlrp3–/– mice is shown (n = 9 for WT, n = 10 for Nlrp3–/– mice). E Representative HE staining of ear samples from WT and Nlrp3–/– mice is shown. F The number of neutrophils in the ear skin samples on day 7 is shown (n = 14 for WT, n = 15 for Nlrp3–/– mice). G The expression of Nlrp3 in BMBAs from Mcpt8-iCre mice and Mcpt8-iCre Nlrp3fl/fl mice was assessed by real-time RT-PCR (n = 4). H The time course of ear thickening in Mcpt8-iCre and Mcpt8-iCre Nlrp3fl/fl mice is shown (n = 5). I Representative HE staining of ear samples from Mcpt8-iCre and Mcpt8-iCre Nlrp3fl/fl mice is shown. J The number of CD45+ cells, neutrophils, basophils, and eosinophils in the ear skin samples on day 7 is shown (n = 7 for Mcpt8-iCre, n = 6 for Mcpt8-iCre Nlrp3fl/fl mice). Data are expressed as dot plots with the mean ± SD. *P < 0.05, **P < 0.01, ***P < 0.001.

References

    1. Weidinger S, Novak N. Atopic dermatitis. Lancet. 2016;387:1109–22. - PubMed
    1. Chan TC, Sanyal RD, Pavel AB, Glickman J, Zheng X, Xu H, et al. Atopic dermatitis in Chinese patients shows T(H)2/T(H)17 skewing with psoriasiform features. J Allergy Clin Immunol. 2018;142:1013–7. - PubMed
    1. Choy DF, Hsu DK, Seshasayee D, Fung MA, Modrusan Z, Martin F, et al. Comparative transcriptomic analyses of atopic dermatitis and psoriasis reveal shared neutrophilic inflammation. J Allergy Clin Immunol. 2012;130:1335–1343.e1335. - PMC - PubMed
    1. Suárez-Fariñas M, Dhingra N, Gittler J, Shemer A, Cardinale I, de Guzman Strong C, et al. Intrinsic atopic dermatitis shows similar TH2 and higher TH17 immune activation compared with extrinsic atopic dermatitis. J Allergy Clin Immunol. 2013;132:361–70. - PMC - PubMed
    1. Chiang CC, Cheng WJ, Dela Cruz J, Raviraj T, Wu NL, Korinek M, et al. Neutrophils in Atopic Dermatitis. Clin Rev Allergy Immunol. 2024;67:21–39. - PMC - PubMed

LinkOut - more resources