. 2025 Jul 25;16(1):6878.
doi: 10.1038/s41467-025-62004-5.

Large-scale RNA-Seq mining reveals ciclopirox olamine induces TDP-43 cryptic exons

Affiliations

Large-scale RNA-Seq mining reveals ciclopirox olamine induces TDP-43 cryptic exons

Irika R Sinha et al. Nat Commun. .

Abstract

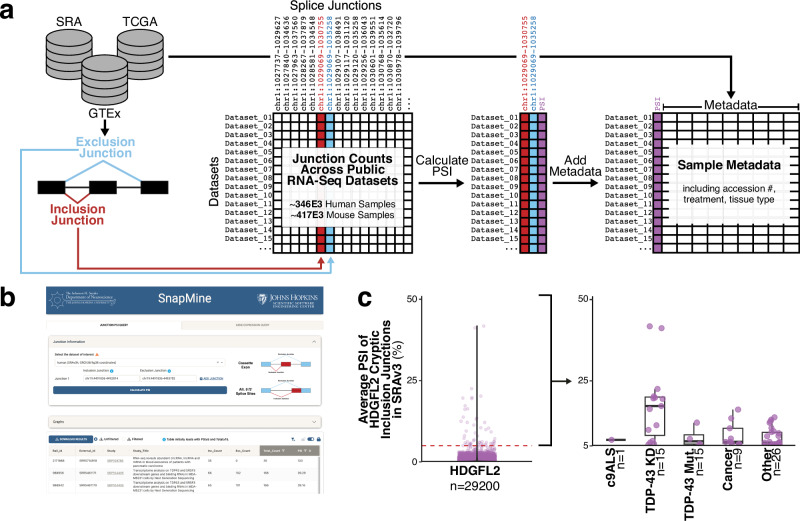
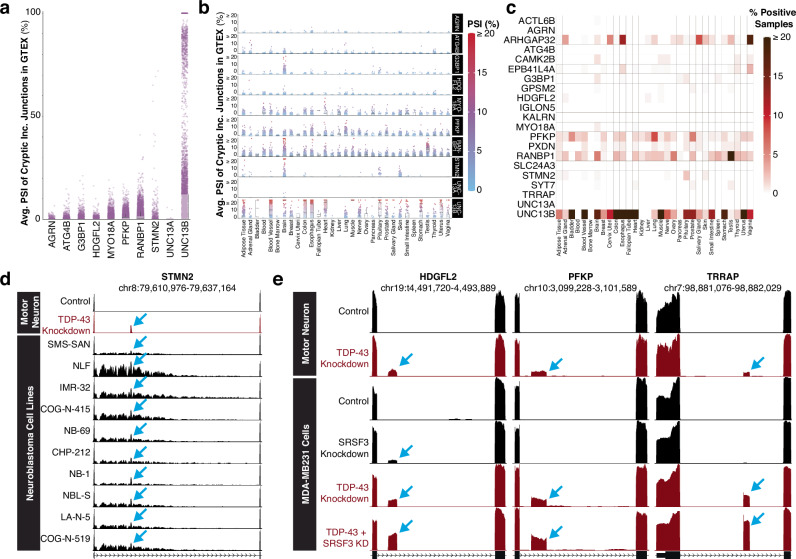
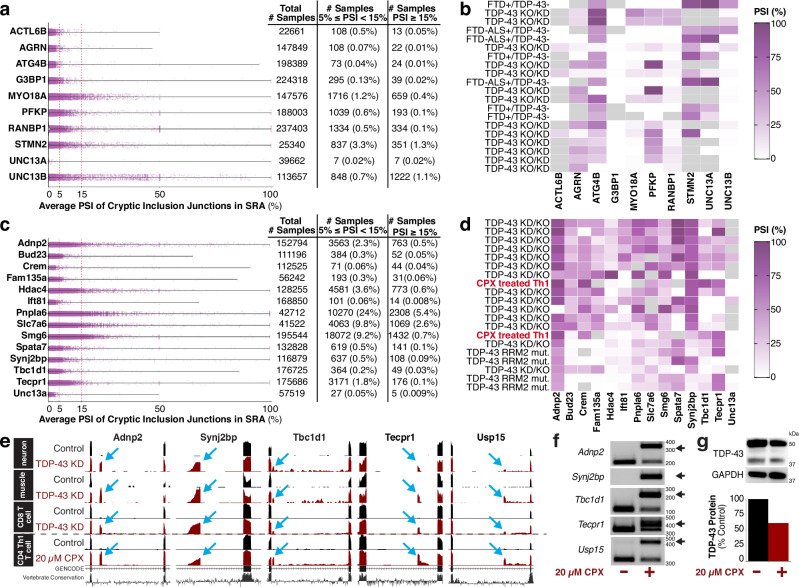
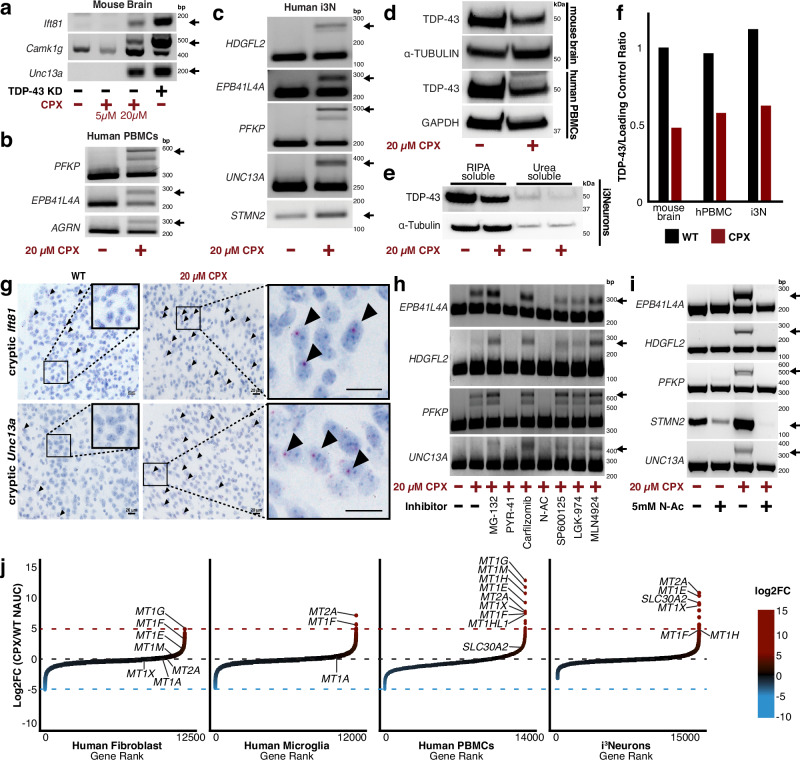
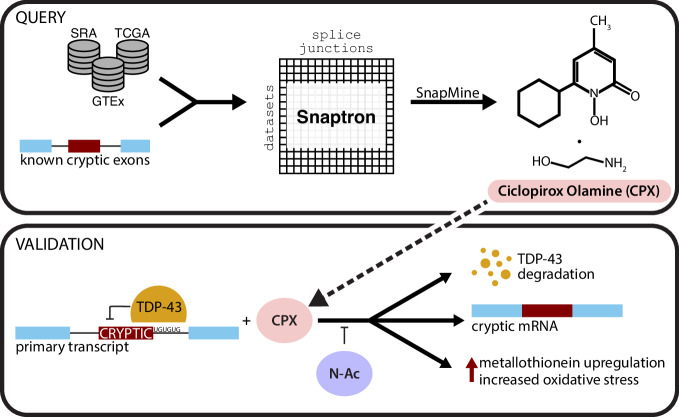
Nuclear clearance and cytoplasmic aggregation of TDP-43, initially identified in ALS-FTD, are hallmark pathological features observed across a spectrum of neurodegenerative diseases. We previously found that TDP-43 loss-of-function leads to transcriptome-wide inclusion of deleterious cryptic exons, a signature detected in presymptomatic biofluids and postmortem ALS-FTD brain tissue, but the upstream mechanisms that lead to TDP-43 dysregulation remain unclear. Here, we developed a web-based resource (SnapMine) to determine the levels of TDP-43 cryptic exon inclusion across hundreds of thousands of publicly available RNA sequencing datasets. We established cryptic exon inclusion levels across a variety of human cells and tissues to provide ground truth references for future studies on TDP-43 dysregulation. We then explored studies that were entirely unrelated to TDP-43 or neurodegeneration and found that ciclopirox olamine (CPX), an FDA-approved antifungal, can trigger the inclusion of TDP-43-associated cryptic exons in a variety of mouse and human primary cells. CPX induction of cryptic exons arises from heavy metal toxicity and oxidative stress, suggesting that similar vulnerabilities could play a role in neurodegeneration. Our work demonstrates how diverse datasets can be linked through common biological features and underscores how public archives of sequencing data remain a vastly underutilized resource with tremendous potential for uncovering novel insights into complex biological mechanisms and diseases.


Conflict of interest statement

Competing interests: The authors declare no competing interests.

Figures

Fig. 1
Fig. 1. SnapMine application mines Snaptron database for exon-exon junction usage.
a Schematic of SnapMine algorithm. SnapMine mines Snaptron for exon-exon junction counts of samples in the Sequencing Read Archive (SRA), the Cancer Genome Atlas (TCGA), and the Genotype-Tissue Expression (GTEx) project. The junction counts are extracted, as represented by the blue and red columns for the exclusion and inclusion junctions, respectively, in each sample. The percent spliced-in (PSI) value is then calculated for each inclusion junction of interest. b SnapMine interface with example usage to find results associated with one junction of the HDGFL2 cryptic exon in the Sequencing Read Archive (SRA). The graph tab is minimized. c SRA samples including the HDGFL2 cryptic exon (CE) (left) subset to those with an average inclusion rate higher than 5% (right). Most samples with avgPSI > 5% for the HDGFL2 CE are from ALS-associated or TDP-43-knockdown (KD)/mutation (mut.) studies. Data are presented as box plots with median and interquartile range, along with whiskers from minimum to maximum values. Source data are provided as a Source Data file.
Fig. 2
Fig. 2. Using SnapMine to investigate cryptic exons in GTEx and SRA data compilations.
a, b Average percent spliced-in (PSI) of cryptic exons (CEs) in AGRN, ATG4B, G3BP1, HDGFL2, MYO18A, PFKP, RANBP1, STMN2, UNC13A, and UNC13B. Data are presented as box plots with median and interquartile range, along with whiskers from minimum to maximum values. Each point represents a sample in Genotype-Tissue Expression (GTEx) project dataset (n = 19803) (a) All samples. Average PSI is not always 0 and the CE in UNC13B has particularly high inclusion rates. b Tissue-specific expression indicates CE inclusion differs by tissue. Some cryptic exons have generally low inclusion in all samples while others have tissue-specific enrichment. Points are colored in a gradient from blue (PSI = 0%) to red (PSI ≥ 20%). The following tissues are sampled: adipose (n = 28446), adrenal gland (n = 6028), bladder (n = 462), blood (n = 23056), blood vessel (n = 30756), bone marrow (n = 4488), brain (n = 64482), breast (n = 10604), cervix uteri (n = 418), colon (n = 18084), esophagus (n = 34694), fallopian tube (n = 198), heart (n = 20724), kidney (n = 2156), liver (n = 5522), lung (n = 14410), muscle (n = 19382), nerve (n = 14498), ovary (n = 4290), pancreas (n = 7920), pituitary (n = 6622), prostate (n = 5786), salivary gland (n = 3916), skin (n = 42680), small intestine (n = 4246), spleen (n = 5610) stomach (n = 8448), testis (n = 9020), thyroid (n = 15532), uterus (n = 3498), vagina (n = 3806). c Heatmap representation of percentage GTEx samples positive for each cryptic exon in each tissue. Samples are considered positive if avgPSI > 5% for the cryptic exon. ARHGAP32, PFKP, RANBP1, and UNC13B have tissue-specific enrichment. A gradient from white (% positive = 0%) to deep red (% positive ≥ 20%) is used to color the tiles. d UCSC Genome Browser visualization of the STMN2 cryptic exon in untreated neuroblastoma cell lines. Blue arrow indicates the cryptic exon. e UCSC Genome Browser visualization of HDGFL2, PFKP, and TRRAP cryptic exons in MDA-MD-231 cells after TDP-43 and/or SRSF3 knockdown. Blue arrow indicates the cryptic exon. Lanes with red-colored reads indicate a TDP-43 knockdown. Lanes with black-colored reads represent samples without TDP-43 knockdown. The PSI of HDGFL2, PFKP, and TRRAP cryptic exons appears to increase with co-knockdown of SRSF3 compared to a TDP-43 only knockdown. SRSF3 knockdown appears sufficient in these cells for cryptic exon inclusion.
Fig. 3
Fig. 3. The SRA can be mined to identify novel biological contexts of alternative splicing events.
ad SnapMine can be used to calculate the average percent spliced-in (PSI) values of cryptic exons (CEs) in samples from the Sequencing Read Archive (SRA). a, c Data are presented as box plots with median and interquartile range, along with whiskers from minimum to maximum values. a Visualization and quantification of PSI of human-specific CEs. b Heatmap visualization of the top 20 human samples in SRA with high inclusion of TDP-43-associated CEs. A gradient from white (PSI = 0%) to purple (PSI = 100%) is used to color the tiles. Gray tiles indicate the PSI cannot be calculated with certainty. All samples are associated with TDP-43 knockout (KO), knockdown (KD), or nuclear depletion (TDP-43-). c Visualization and quantification of PSI of mouse-specific CEs. d Heatmap visualization of the top 20 mouse samples in SRA with high inclusion of all selected TDP-43-associated CEs. A gradient from white (PSI = 0%) to purple (PSI = 100%) is used to color the tiles. Gray tiles indicate the PSI cannot be calculated with certainty. Although the majority are associated with TDP-43 KD, KO, or mutation (mut.), two samples stand out. The two samples correspond to CD4 + Th1 cells treated with ciclopirox olamine (CPX) in vitro. e UCSC Genome Browser visualization comparing RNA-seq reads of CEs in Adnp2, Synj2bp, Tbc1d1, Tecpr1, and Usp15 in TDP-43 KD and CPX treatment conditions. CD4 + Th1 cells treated with CPX incorporate cryptic exons at levels comparable to mouse neuronal and muscle cells with TDP-43 knocked down. Blue arrow indicates the cryptic exon. Lanes with red-colored reads indicate a TDP-43 KD or the CPX treatment. Lanes with black-colored reads are control samples. f Representative RT-PCR measurements of cryptic exon inclusion of mouse splenocyte culture treated with 20 µM CPX for four hours (n = 3). The black arrow points to the cryptic band. g Representative immunoblot of TDP-43 depletion in mouse splenocyte culture treated with 20 µM CPX for four hours (n = 3). TDP-43 protein levels are normalized to GAPDH protein levels. Bar graph quantifies presented TDP-43 protein levels in representative immunoblot with the black bar indicating the control and red bar indicating the CPX-treated sample. Source data are provided as a Source Data file.
Fig. 4
Fig. 4. CPX treatment causes TDP-43 protein depletion in various primary cell types.
ac Representative RT-PCR measurements of cryptic exon (CE) inclusion after cell culture treatment with 20 µM CPX for four hours. The black arrow points to the cryptic band. a Mouse brain (n = 2). The primers used to measure Ift81 and Unc13a cryptic exon inclusion target the CE directly, therefore no WT band is measured. b Human primary PBMCs (n = 2). c Human i3N (n = 2). df Representative immunoblots of TDP-43 depletion in mouse brain (n = 2), human PBMC (n = 2), and human i3N (n = 2) cultures treated with 20 µM CPX for four hours. TDP-43 protein levels are normalized to GAPDH or alpha-tubulin protein levels. e Representative immunoblot of TDP-43 and alpha-tubulin levels in RIPA-soluble and urea-soluble fractions in i3N. No aggregated, urea-soluble TDP-43 is measured (n = 2). f Bar graph quantifies presented TDP-43 protein levels in representative immunoblots. g Representative images for Basescope measurements of cryptic Ift81 and cryptic Unc13a inclusion of ex vivo treatment of mouse brain with 20 µM CPX for four hours (n = 4, 5 slices/n). Pink dots represent detected CE RNA. h Representative RT-PCR measurements of CE inclusion in human i3N culture after four-hour CPX treatment in combination with different small compound inhibitors (n = 2). Treatment with MG-132, Carfilzomib, or MLN4924 appears to increase cryptic exon inclusion rates while treatment with N-acetylcysteine (N-Ac) attenuates cryptic exon inclusion. i Representative RT-PCR measurements of CE inclusion in human i3N culture after four-hour CPX treatment in combination 5mM N-Ac (n = 2). j Heatmap visualization of average log2 fold change (log2FC) values of selected gene normalized area under the curve (NAUC) values, a measure of expression, between CPX-treated and WT conditions (n = 2 for each condition). A gradient from blue (log2FC of −5) to red (log2FC of 15) is used to color the tiles. I3Neurons and PBMCs, cell types that exhibit cryptic exons after treatment with CPX, exhibit strong gene upregulation of metallothioneins. Further analysis of genes upregulated in i3Neurons (Supplementary Fig. 4) confirms that heat shock response and oxidative stress pathways are upregulated, suggesting that heavy metal toxicity may be mediating CPX’s effect on TDP-43. Source data are provided as a Source Data file.
Fig. 5
Fig. 5. SnapMine was used to identify CPX treatment as a modifier of TDP-43 levels.
RNA is depicted with blue and red bars representing canonical and cryptic exons, respectively. The black line connecting the exons represents the introns. (top) Snaptron Sequencing Read Archive (SRA), The Cancer Genome Atlas (TCGA), and the Genotype-Tissue Expression (GTEx) project data compilations were queried for TDP-43-associated cryptic exons. Ciclopirox olamine (CPX) was identified as a candidate for TDP-43 modulation. (bottom) CPX was validated to induce TDP-43 degradation, cryptic exons, and increased oxidative stress and metallothionein upregulation in various cell-types. N-Acetylcysteine (N-Ac) was found to inhibit this effect.

Update of

References

    1. Chen, M. & Manley, J. L. Mechanisms of alternative splicing regulation: insights from molecular and genomics approaches. Nat. Rev. Mol. Cell Biol.10, 741–754 (2009). - PMC - PubMed
    1. Wahl, M. C., Will, C. L. & Lührmann, R. The spliceosome: design principles of a dynamic RNP machine. Cell136, 701–718 (2009). - PubMed
    1. Wang, E. T. et al. Alternative isoform regulation in human tissue transcriptomes. Nature456, 470–476 (2008). - PMC - PubMed
    1. Matlin, A. J., Clark, F. & Smith, C. W. J. Understanding alternative splicing: towards a cellular code. Nat. Rev. Mol. Cell Biol.6, 386–398 (2005). - PubMed
    1. Pan, Q., Shai, O., Lee, L. J., Frey, B. J. & Blencowe, B. J. Deep surveying of alternative splicing complexity in the human transcriptome by high-throughput sequencing. Nat. Genet.40, 1413–1415 (2008). - PubMed

LinkOut - more resources