. 2025 Jul 26;16(1):6892.
doi: 10.1038/s41467-025-62105-1.

Flower dependent trafficking of lamellar bodies facilitates maturation of the epidermal barrier

Affiliations

Flower dependent trafficking of lamellar bodies facilitates maturation of the epidermal barrier

Justin C Rudd et al. Nat Commun. .

Abstract

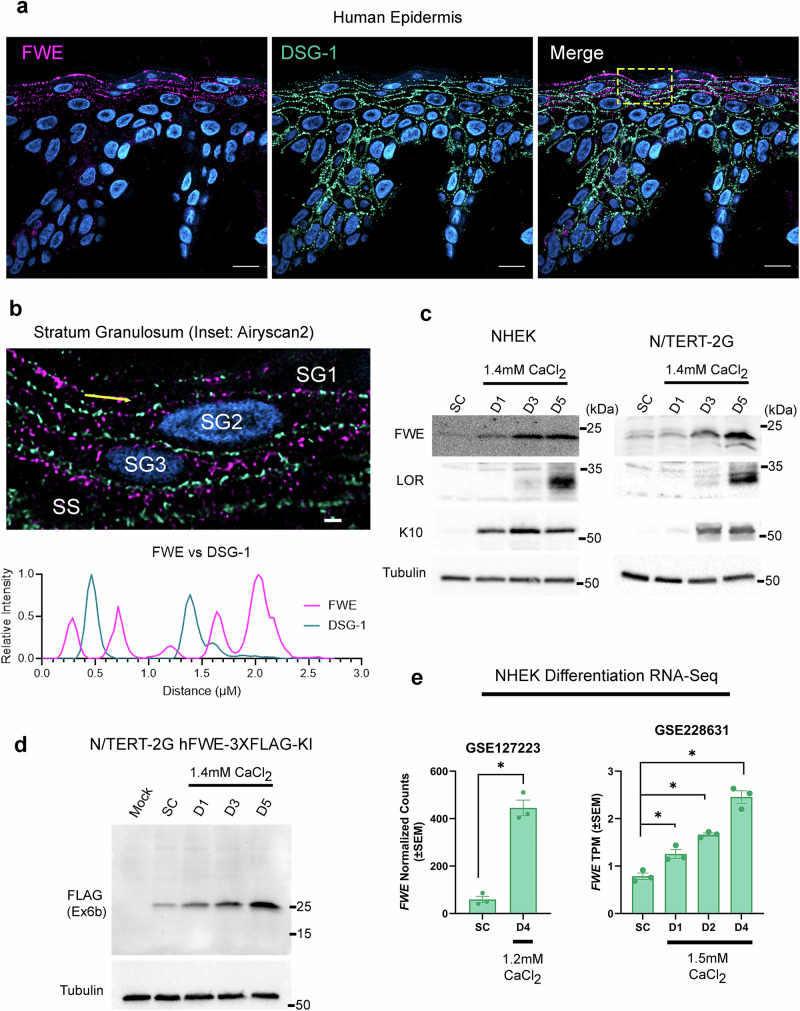
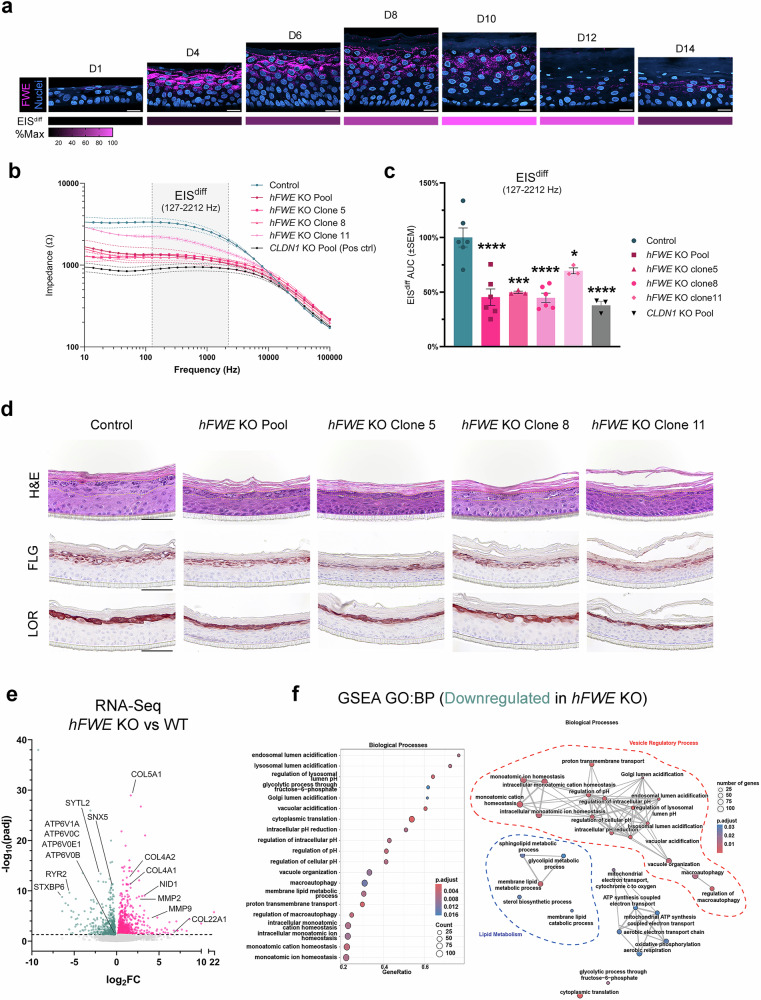
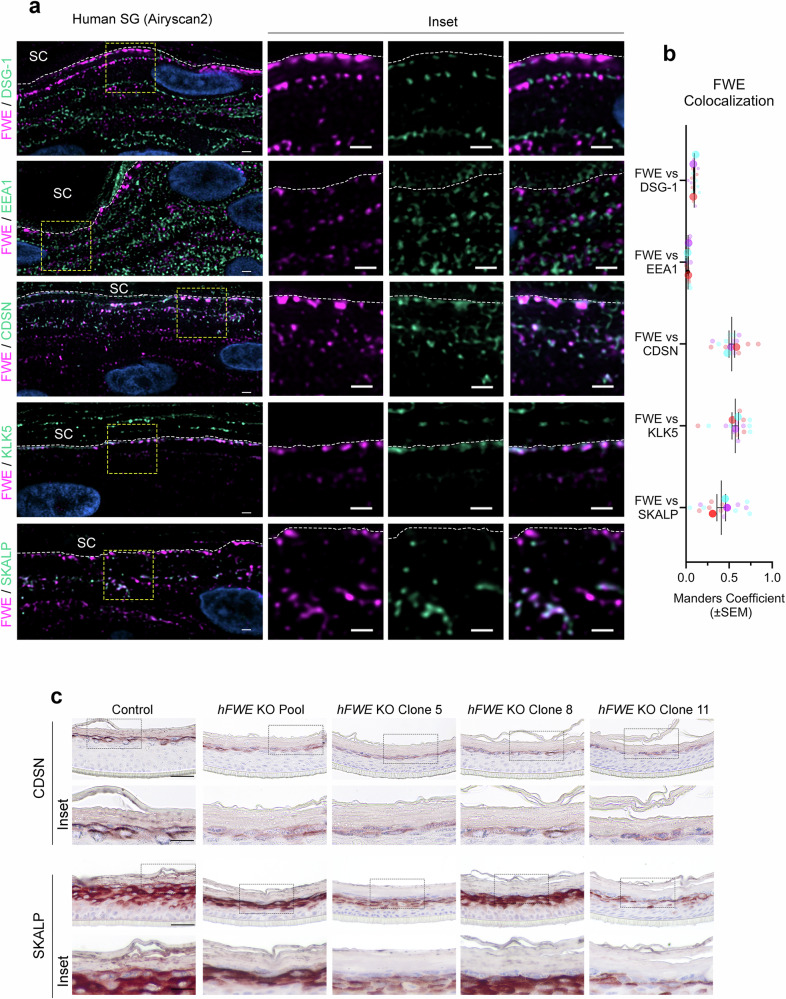
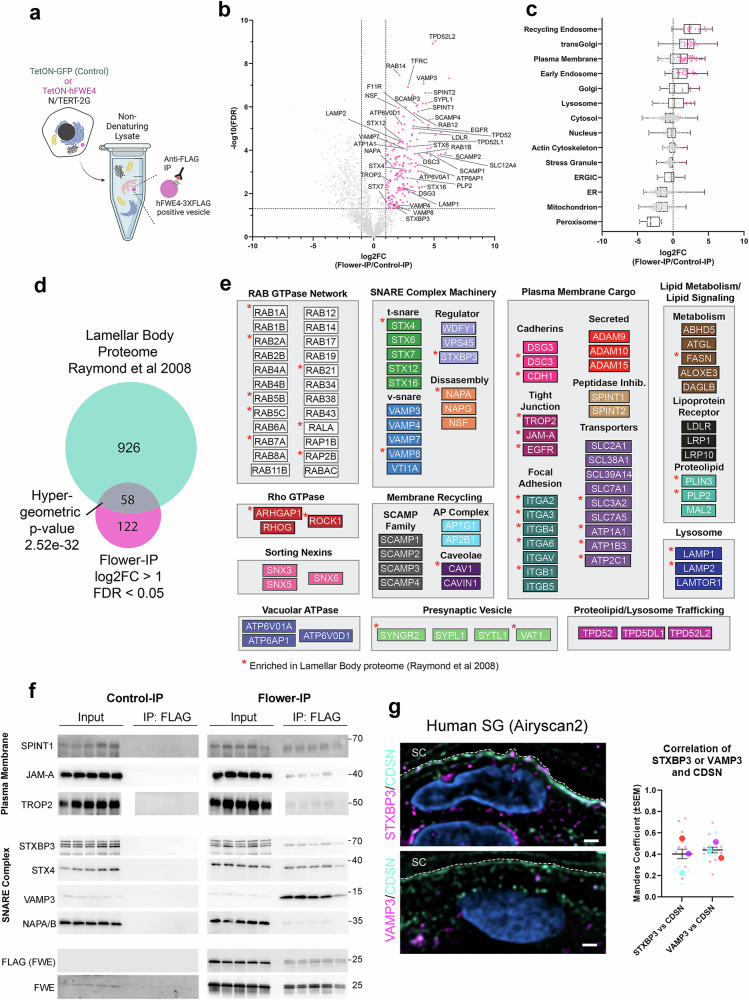
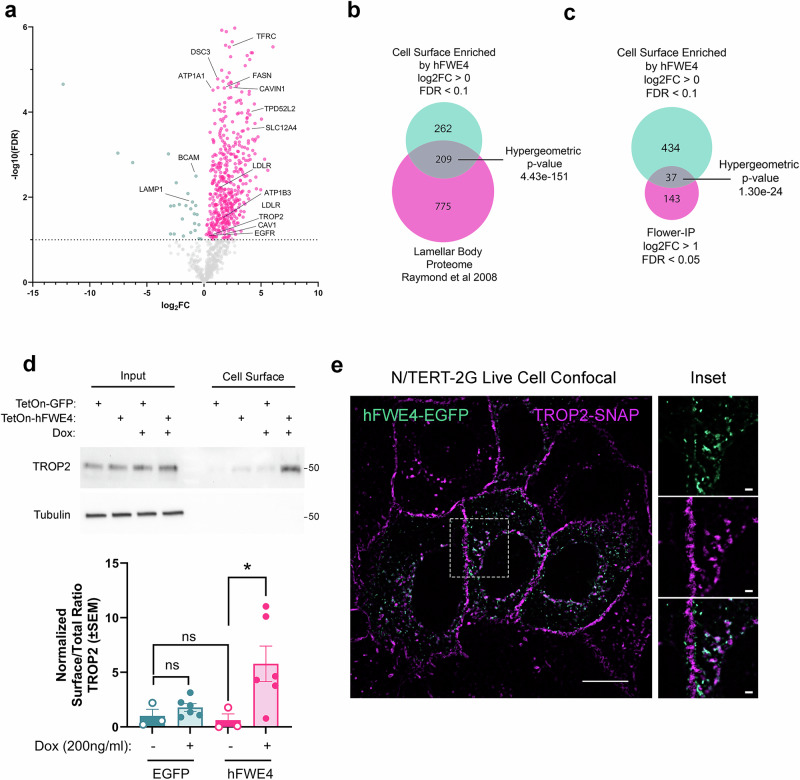
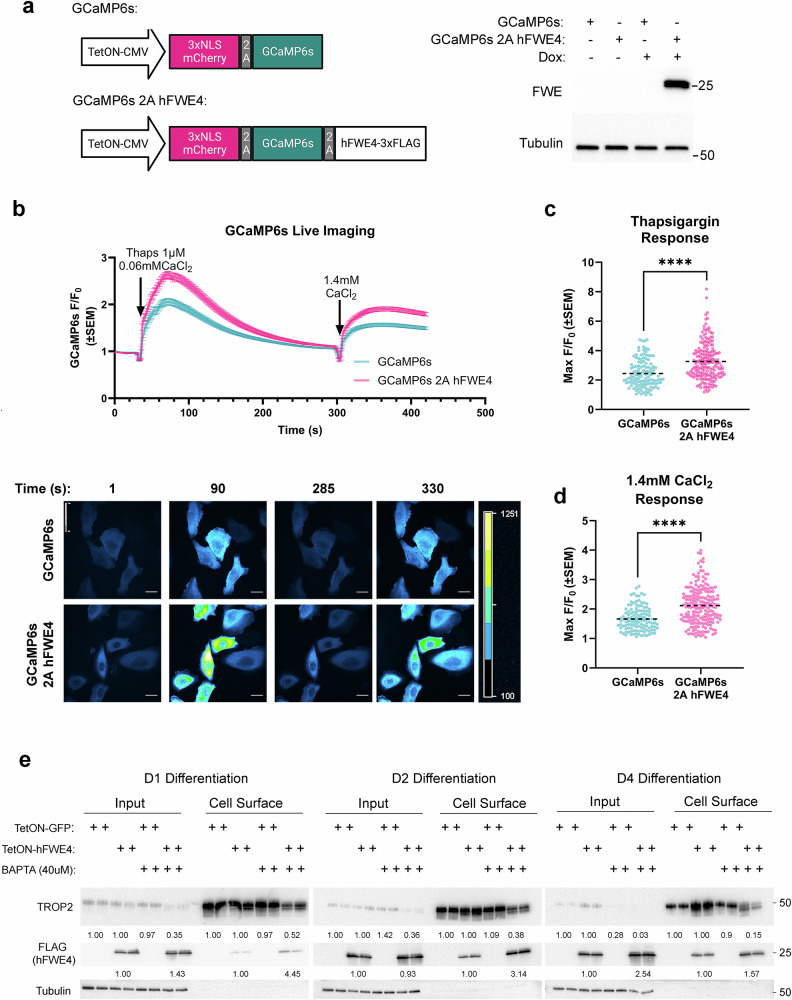
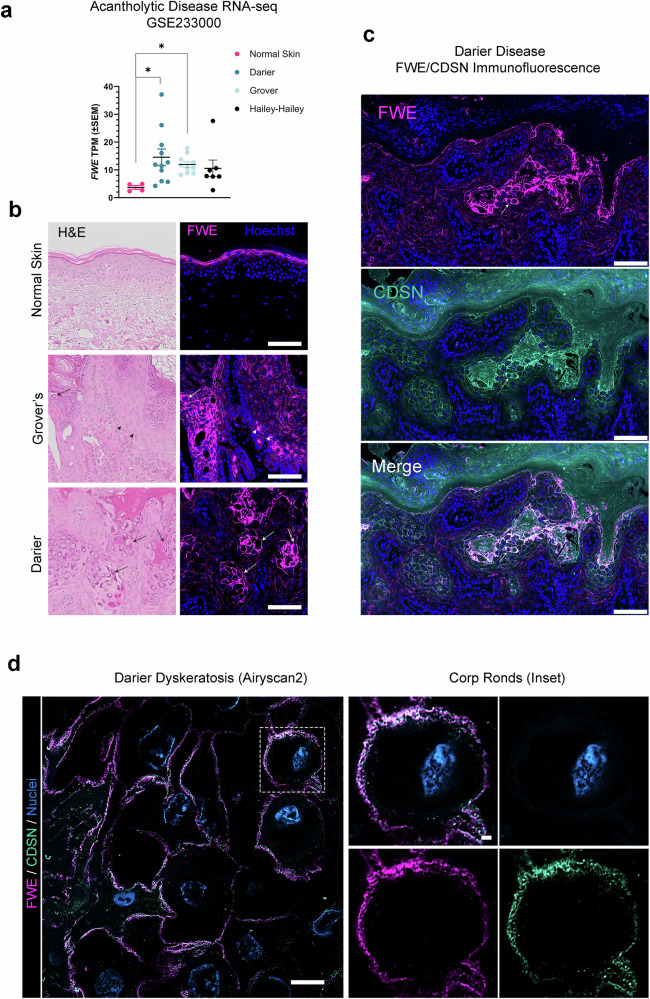
Specialized secretory cells, including keratinocytes in the last viable layers of mammalian epidermis, utilize lysosome-related organelles (LROs) to exocytose distinct cargoes vital for tissue function. Here, we demonstrate that the Flower isoform, hFWE4, a putative Ca2+ channel that permits endocytic retrieval of presynaptic vesicles and lytic granules, also resides on epidermal lamellar bodies (LBs), an LRO that extrudes a proteinaceous lipid-rich matrix to finalize the epidermal barrier. In differentiated keratinocyte cultures, we show that hFWE4-positive LB-like vesicles associate with a distinct ensemble of LRO trafficking mediators and demonstrate that hFWE4 liberates Ca2+ from intracellular stores to enable the surface presentation of cargo contained within these vesicles. Finally, supporting a critical role for hFWE4-dependent trafficking in establishing the epidermal barrier, we demonstrate that this process is dysregulated in genetic diseases of cornification that are driven by impairments in keratinocyte Ca2+ handling. Our results provide new insight into the biogenesis and trafficking of epidermal LBs and more broadly suggest that hFWE4 may serve as a core component of LRO trafficking machinery that endows Ca2+ dependency to distinct stages of the transport process depending on the cell of origin.


Conflict of interest statement

Competing interests: The authors declare no competing interests.

Figures

Fig. 1
Fig. 1. Flower is up-regulated in terminally differentiating epidermal keratinocytes and localizes to apically polarized vesicles.
a Representative confocal microscopy of double immunofluorescence for desmoglein-1 (DSG-1) and Flower (FWE) in normal human epidermis (n = 3) with Hoechst-labeled nuclei (blue). b Airyscan2 super resolution confocal image of the inset stratum granulosum area in (A) showing stratum spinosum (SS) and SG layers 1-3. The line scan indicated by the yellow line in the image shows fluorescence intensity values for DSG-1 and FWE along the apical SG1 membrane. Scale bars (a) 10 µm, (b) 500 nm. c Representative (n = 3) immunoblots for FWE and differentiation markers in whole cell lysates collected from monolayer NHEK or N/TERT-2G keratinocytes in a subconfluent (SC) undifferentiated state or after differentiation in 1.4 mM CaCl2 containing media for 1, 3, or 5 days post confluence. d Representative FLAG immunoblot (n = 2) of monolayer N/TERT-2G keratinocytes harboring a 3XFLAG knock-in (3XFLAG-KI) preceding the stop codon in exon 6B of hFWE (see Supplementary Fig. 2A). Whole cell lysates from unedited cells (Mock) and KI cells were collected from cells as described in (c). e hFWE expression values retrieved from bulk RNA seq experiments (GSE127223 and GSE228631) performed on subconfluent or differentiated NHEK monolayers (n = 3 replicates per timepoint, * = DESeq2, p- or q-value < 0.05).
Fig. 2
Fig. 2. Flower deficient epidermal organoids exhibit impaired barrier function.
a Representative FWE immunofluorescence on N/TERT-2G derived epidermal organoids grown at air-liquid interface for the indicated number of days (n = 2 organoids per timepoint, scale bars, 20 µm). Heatmap beneath images reports average percentage of maximal EISdiff AUC for each timepoint from ref. . b Full impedance spectra from control and hFWE KO N/TERT-2G after 10 d at air-liquid interface, as well as AUC calculations (c) for impedance values in EISdiff range are shown normalized to control (* = p < 0.05, *** = p < 0.001, **** = p < 0.0001, one-way ANOVA with Bonferroni’s multiple comparison test). CLDN1 KO N/TERT-2G previously developed in ref. were included as a positive control for barrier deficit. (n = 6 organoids for Control, hFWE KO pool and hFWE KO clone8 over two independent experiments; n = 3 organoids for hFWE KO clone5 and clone11). d Representative (n = 3) H&E and differentiation marker (LOR, FLG) immunohistochemistry on epidermal organoids. Dashed lines on H&E indicate the border of keratohyalin granule-containing cells in the SG (scale bars, 50 µm). e Volcano plot of DESeq2 results from bulk RNA-seq comparing all hFWE KO organoids (n = 11, including pool and clonal organoids) to control (n = 3) organoids. f Dotplot (left) and emap (right) of enriched GO:BP terms from gene-set enrichment analysis on significantly (p-adj < 0.05) downregulated genes in KO organoids. Enriched nodes related to vesicle function and lipid metabolism are denoted with red and blue outlines on emap, respectively.
Fig. 3
Fig. 3. Flower localizes to epidermal lamellar bodies (LBs) and facilitates their apically-directed secretion.
a Representative Airyscan2 imaging of double immunofluorescence for FWE and either desmoglein-1 (DSG-1), early endosome antigen 1 (EEA1), corneodesmosin (CDSN), kallikrein-5 (KLK5), or skin-derived antileukoprotease (SKALP) in the SG of normal human epidermis. Inset regions indicated by yellow dashed boxes. The white dashed line demarcates the border between SG1 and SC. b Mander’s coefficient (n = 12–15 micrographs across three biologically independent samples) for colocalization of FWE and the indicated marker in double-positive cell layers of Airyscan2 micrographs. Large dots indicate the average of n ≥ 4 distinct imaging fields (small dots) for each independent sample. c CDSN and SKALP IHC in epidermal organoids (n = 3) derived from control or hFWE KO N/TERT-2G cells. Inset regions indicated by dashed boxes. Scale bars, (a) 1 µm (full image), 1 µm (inset), (c) 20 µM, 10 µm (inset).
Fig. 4
Fig. 4. Proteomic profiling defines composition of hFWE4-positive vesicles and association with LB-specific trafficking machinery.
a Schematic of non-denaturing immunoprecipitation strategy for isolation of intact vesicles harboring 3XFLAG-tagged hFWE4 from differentiated (D4) keratinocytes. Created in BioRender. Rudd, J. (2025) https://BioRender.com/zvwuxf0. b LFQ-MS volcano plot showing proteins enriched (pink) in Flower-IP relative to Control-IP (n = 5) using cutoffs of FDR < 0.05 and log2FC > 1. c Graph-based annotation (from ref. ) of subcellular localization for all proteins identified in the LFQ-MS dataset. Proteins identified as significantly enriched in (b) are shown in pink. Box plots show median and 25th–75th percentile values with whiskers extending to minimum and maximum values. d Overlap of Flower-IP enriched proteins with those identified as part of the 984-component human LB proteome (from ref. ). Fisher’s exact test of the hypergeometric distribution was calculated to determine the significance of the overlap. e Representation of Flower-IP enriched proteins (FDR < 0.05) organized by functional network or multi-subunit complex. f Immunoblot validation of Flower-IP enrichment for select interactions, including SNARE complex and plasma membrane cargo. Unrelated intervening lanes were removed from the TROP2 blot. g Representative Airyscan2 imaging of double immunofluorescence for CDSN and VAMP3 or STXBP3 showing partial colocalization CDSN positive LBs in the SG of human epidermis. Mander’s coefficient (n = 12–15 micrographs across three biologically independent samples) for colocalization of CDSN and the indicated marker in double-positive cell layers of Airyscan2 micrographs. Scale bars, 1 µm.
Fig. 5
Fig. 5. Ectopic hFWE4 expression facilitates plasma membrane presentation of LB associated cargo including the tight junction component, TROP2.
a LFQ-MS volcano plot showing enriched (pink) and depleted (green) cell surface proteins in TetON-hFWE4 N/TERT-2G cells relative to TetON-GFP control after four days of differentiation (n = 5, FDR < 0.1). Overlap of cell surface enriched proteins with the LB proteome (Raymond 2008) (b) and with Flower-IP enriched proteins (c). Fisher’s exact test of the hypergeometric distribution was calculated to determine the significance of the overlap. d Representative TROP2 immunoblot of 100 µg affinity-purified cell surface protein relative to 10 µg total protein from D7 differentiated TetON-GFP or TetON-hFWE4 N/TERT-2G in the presence (n = 6) or absence (n = 3) of doxycycline. Densitometric quantification of immunoblots across two independent experiments is presented (* = p < 0.05, one-way ANOVA with Dunnet’s multiple comparison test). e Representative (n = 4 independent experiments) spinning disc confocal imaging of live N/TERT-2G expressing a TetON-hFWE4-EGFP and SNAP-tagged TROP2. Inset (right) shows colocalization on hFWE4-EGFP positive vesicles. Scale bars, 10 µm (full image), 1 µm (inset).
Fig. 6
Fig. 6. hFWE4 potentiates Ca2+ release from intracellular stores to facilitate surface trafficking of LB cargo.
a Schematic of bi- and tri-cistronic lentiviral vectors used to stably coexpress a nuclear-localized mCherry indicator with GCaMP6s alone or with GCaMP6s and hFWE4 in N/TERT-2G cells. Created in BioRender. Rudd, J. (2025) https://BioRender.com/gtefyvp. Immunoblot validation shows inducible expression of hFWE4-3XFLAG in N/TERT-2G cells. b Representative spinning disc confocal imaging of GCaMP6s in control (n = 120 cells across 24 independent experiments) or hFWE4 overexpressing (n = 193 cells across 18 independent experiments) cells following 1 µM thapsigargin treatment and 1.4 mM CaCl2 supplementation. Snapshots from representative movies show intensity profiles of GCaMP6s at indicated timepoints before and after treatments. Scale bars, 10 µm. Max fold change in GCaMP6s intensity in response to thapsigargin (c) and extracellular Ca2+ supplementation (d) are shown. Mean fold change is represented by dashed lines in (d) (**** = p < 0.0001, unpaired two-tailed t test). e Immunoblotting for TROP2 using 300 µg cell surface protein and 10 µg total protein from doxycycline-treated TetON-GFP and TetON-hFWE4 (n = 2) cell cultures that were loaded with either 40 µM BAPTA-AM or DMSO prior to switching to 1.4 mM CaCl2 for 1, 2, or 4 d differentiation. D4 differentiated cells were reloaded with BAPTA or DMSO after 48 h of differentiation. Densitometry quantification under each panel reflects intensity values relative to the DMSO-treated control for each genetic condition. For inputs, tubulin normalized intensities were used. Values are the average of duplicate samples for each experimental group.
Fig. 7
Fig. 7. Dysregulation of FWE-associated LBs characterizes epidermal pathologies driven by impaired cytosolic Ca2+ handling.
a hFWE expression retrieved from bulk RNA-seq of normal skin (n = 4) and Darier (n = 11), Grover (n = 10), or Hailey-Hailey disease (n = 7) from GSE233000 (* = DESeq2 p-adj < 0.05). b Representative FWE immunofluorescence performed on normal (n = 5), Grover (n = 3) and Darier (n = 3) patient samples. Following fluorescent imaging, H&Es were performed on the same section to allow co-registration of FWE signal with histopathology. Arrows show significant elevation of FWE signal in corps ronds and grains of dyskeratotic foci, arrowheads show examples of cells with improper FWE polarization. c Representative double immunofluorescence for FWE and CDSN on Darier skin biopsies (n = 3 biologically independent samples) showing significant colocalization in dyskeratotic foci. Arrows indicate representative corps ronds imaged using Airyscan2 super resolution confocal in (d) showing accumulation of double positive vesicles around the entire cell periphery. Scale bars, (b, c) 100 µm, (d) 10 µm (full image), 1 µm (inset).

Similar articles

References

    1. Candi, E., Schmidt, R. & Melino, G. The cornified envelope: a model of cell death in the skin. Nat. Rev. Mol. Cell Biol.6, 328–340 (2005). - PubMed
    1. Simpson, C. L., Patel, D. M. & Green, K. J. Deconstructing the skin: cytoarchitectural determinants of epidermal morphogenesis. Nat. Rev. Mol. Cell Biol.12, 565–580 (2011). - PMC - PubMed
    1. Mahanty, S. & Setty, S. R. G. Epidermal Lamellar Body Biogenesis: Insight Into the Roles of Golgi and Lysosomes. Front. Cell Dev. Biol.9, 10.3389/fcell.2021.701950 (2021). - PMC - PubMed
    1. Rassner, U., Feingold, K. R., Crumrine, D. A. & Elias, P. M. Coordinate assembly of lipids and enzyme proteins into epidermal lamellar bodies. Tissue Cell31, 489–498 (1999). - PubMed
    1. Oren, A., Ganz, T., Liu, L. & Meerloo, T. In human epidermis, beta-defensin 2 is packaged in lamellar bodies. Exp. Mol. Pathol.74, 180–182 (2003). - PubMed

LinkOut - more resources