. 2025 Jul 25;16(1):562.
doi: 10.1038/s41419-025-07882-9.

Ferroptosis mediated by the IDO1/Kyn/AhR pathway triggers acute thymic involution in sepsis

Affiliations

Ferroptosis mediated by the IDO1/Kyn/AhR pathway triggers acute thymic involution in sepsis

Zimei Cheng et al. Cell Death Dis. .

Abstract

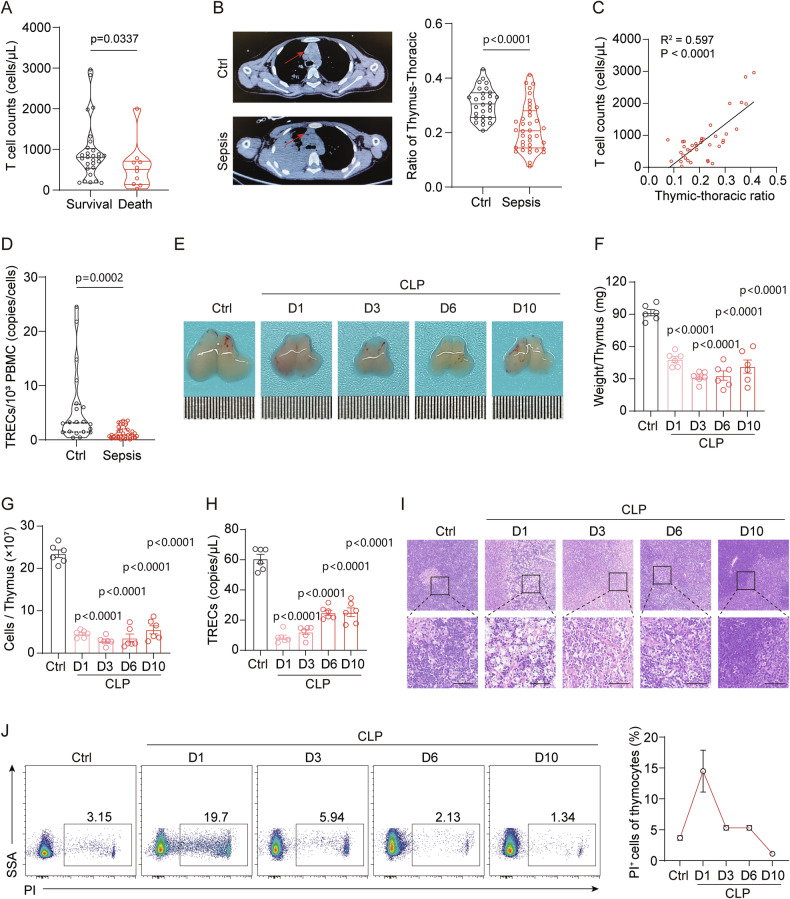
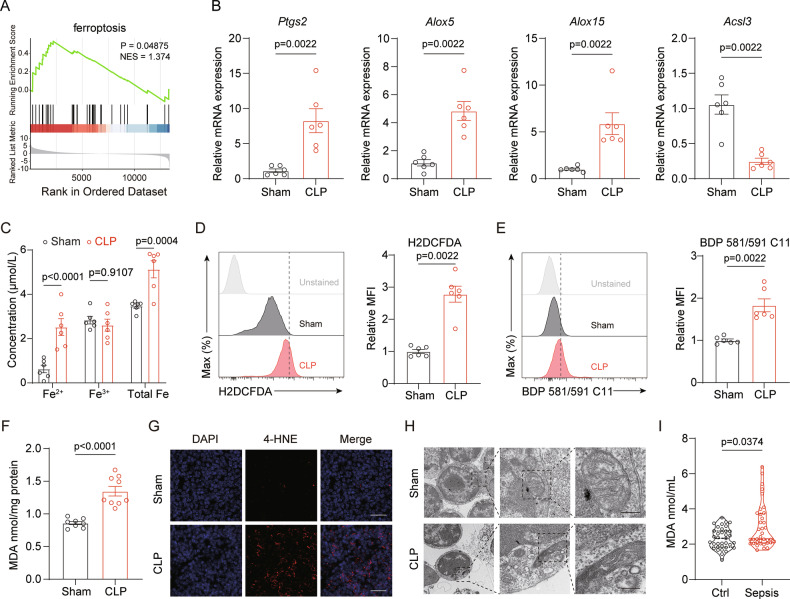
Acute thymic involution (ATI) is frequently observed during sepsis, however the underlying mechanisms remain poorly understood. This study demonstrates that ferroptosis plays a crucial role in sepsis-associated ATI. We found that pediatric sepsis patients showed significantly elevated kynurenine (Kyn)/tryptophan (Trp) ratios, indicating increased indoleamine 2,3-dioxygenase 1 (IDO1) activity, along with higher Kyn levels compared to controls. Moreover, Kyn levels were negatively correlated with thymus-to-thorax ratio. Further mechanistic analysis revealed that the enhanced expression of IDO1, induced by inflammatory signals, drives the accumulation of Kyn and subsequent activation of the aryl hydrocarbon receptor (AhR), triggering lipid oxidation-related gene transcription and ferroptosis in thymocytes during sepsis. Treatment with 1-methyltryptophan (IDO1 inhibitor) effectively restore thymic function and improve survival in septic mice. Our findings reveal a novel role for the IDO1/Kyn/AhR pathway in ferroptosis, suggesting that targeting this pathway may offer a promising therapeutic strategy for sepsis. Created with BioRender ( https://app.biorender.com/ ).


Conflict of interest statement

Competing interests: The authors declare no competing interests.

Figures

None
Created with BioRender (https://app.biorender.com/).
Fig. 1
Fig. 1. Thymic involution in pediatric sepsis and polymicrobial sepsis mouse model.
A Peripheral blood T cell counts in surviving (n = 28) versus deceased (n = 10) pediatric sepsis patients. B Representative CT images showing the thymus between sepsis patients (n = 38) and controls (Ctrl) (n = 28). Violin plots depict the ratio of thymus-to-thoracic cavity in both groups. C Correlation between the thymus-to-thoracic ratio and total T cell counts in peripheral blood (n = 38). D Levels of TRECs in PBMCs from sepsis patients (n = 30) and controls (Ctrl) (n = 20). EG Representative images of thymus appearance (E), thymus weight (F), and total thymocyte counts (G) on days 1, 3, 6, and 10 post-CLP surgery (n = 6). H Quantification of TRECs in peripheral blood expressed as absolute TRECs counts per microliter of blood (n = 6). I HE staining of thymus sections on days 1, 3, 6, and 10 post-CLP, showing progressive structural damage (scale bar = 50 μm). J Flow cytometry showing PI+ (propidium iodide positive) thymocytes at different time points, indicating increased cell death following sepsis (n = 4). Bars represent the means ± SEM.
Fig. 2
Fig. 2. Sepsis-associated ATI and thymocyte death are linked to ferroptosis.
A Gene set enrichment analysis (GSEA) plot showing significant enrichment of the ferroptosis pathway in thymocytes from CLP-treated mice (n = 4). B Relative mRNA expression levels of Ptgs2, Alox15, Alox5, and Acsl3 in thymocytes from sham and CLP mice (n = 6). C Quantification of Fe²⁺, Fe³⁺, and total iron levels in thymocytes from sham and CLP mice (n = 6). D Flow cytometry analysis of ROS levels in thymocytes using H2DCFDA staining in thymocytes from sham and CLP mice, represented by flow cytometry histograms (left) and mean fluorescence intensity (MFI) quantification (right) (n = 6). E Lipid peroxidation levels measured via BDP 581/591 C11 staining in thymocytes from sham and CLP mice, represented by flow cytometry histograms (left) and MFI quantification (right) (n = 6). F MDA concentration in thymic tissue from sham and CLP mice (n = 8-9). G Representative immunofluorescence images showing 4-HNE staining in sham and CLP murine thymus (scale bar = 25 μm). H TEM images of thymocyte mitochondria, showing ferroptosis-associated damage in CLP mice compared to sham (scale bar = 200 nm). I MDA levels in plasma from pediatric sepsis patients and healthy controls (n = 35−38). Bars represent the means ± SEM.
Fig. 3
Fig. 3. Inhibition of ferroptosis alleviates ATI.
A Representative images of thymus morphology from sham and CLP mice treated with vehicle or Fer-1. B, C Quantification of thymus weight (B) and total thymocyte counts (C) in sham and CLP mice after Fer-1 administration (n = 6). D Quantification of thymic TRECs in peripheral blood from CLP mice following Fer-1 treatment (n = 7). E Representative HE-stained thymic sections from sham and CLP mice with vehicle or Fer-1 treatment (scale bar = 50 μm). F TEM images of thymocytes showing restoration of mitochondrial structure in Fer-1-treated CLP mice (scale bar = 200 nm). G, H Flow cytometric analysis of ROS production (G) and lipid peroxidation (H) in sham and CLP thymocytes after Fer-1 treatment (n = 6). I MDA levels in thymic tissue from sham and CLP mice with Fer-1 treatment (n = 10). J Immunofluorescence staining of 4-HNE in sham and CLP murine thymus treated with vehicle or Fer-1 (scale bar = 25 μm). K Plasma levels of IL-6 and TNF-α in CLP mice with and without Fer-1 treatment (n = 4). L Kaplan-Meier survival curves of CLP mice treated with vehicle or Fer-1 (n = 10). Bars represent the means ± SEM.
Fig. 4
Fig. 4. Thymic Kyn accumulation triggered by IDO1 exacerbates ferroptosis.
A Volcano plot showing differentially expressed ferroptosis-driver genes in thymocytes from sham and CLP mice (n = 4) based on RNA-seq analysis. B Relative mRNA expression levels of Ido1 in thymocytes from sham and CLP mice (n = 4). C Flow cytometry analysis of IDO1 protein expression in thymocytes from sham and CLP mice (n = 5). D Kyn levels in plasma and thymus of sham and CLP mice (n = 5). E, F Plasma Kyn (E) levels and Kyn/Trp (F) in sepsis patients (n = 12) versus healthy controls (HC) (n = 6). G, H Quantification of thymus weight (G) and total thymocyte counts (H) in sham and CLP mice treated with vehicle or Kyn (n = 6). I Representative HE-stained thymic sections from sham and CLP mice treated with vehicle or Kyn (scale bar = 50 μm). J TEM images of thymocytes showing mitochondrial damage in CLP mice after Kyn administration (scale bar = 200 nm). K, L Flow cytometry analysis of ROS production (K) and lipid peroxidation (L) in sham and CLP thymocytes after Kyn treatment (n = 6). M MDA concentration in thymic tissue from sham and CLP mice treated with Kyn (n = 10). N Immunofluorescence staining of 4-HNE in thymic sections from sham and CLP mice treated with vehicle or Kyn (scale bar = 200 nm). O Correlation analysis between plasma Kyn levels and the thymic-to-thoracic ratio (n = 38). Bars represent the means ± SEM.
Fig. 5
Fig. 5. IDO1 inhibitor 1-MT curtails Kyn-AhR signaling cascade to mitigate thymic ferroptosis and sepsis survival.
A, B Kyn levels in plasma (A) and thymus (B) of sham and CLP mice after 1-MT administration (n = 5). CE Representative images of thymus morphology (C), and quantification of thymus weight (D) and thymocyte counts (E) in sham and CLP mice treated with 1-MT (n = 6). F Quantification of thymic TRECs in peripheral blood from CLP mice treated with 1-MT (n = 7). G Representative HE-stained thymic sections from sham and CLP mice treated with 1-MT (scale bar = 50 μm). (H) TEM images showing mitochondrial structure in thymocytes from CLP mice after 1-MT treatment (scale bar = 200 nm). I, J Flow cytometry analysis of ROS production (I) and lipid peroxidation (J) in thymocytes from sham and CLP mice treated with 1-MT (n = 6). K MDA levels in thymic tissue from sham and CLP mice treated with 1-MT (n = 10). L Immunofluorescence staining of 4-HNE in thymic sections from sham and CLP mice treated with 1-MT (scale bar = 25 μm). M Plasma levels of IL-6 and TNF-α in CLP mice treated with 1-MT (n = 4). N Kaplan-Meier survival curves of CLP mice treated with vehicle (Veh) or 1-MT (n = 12). Bars represent the means ± SEM.
Fig. 6
Fig. 6. Kyn-activated AhR promotes lipid peroxidation in thymocytes of CLP mice.
A AhR expression in the nucleus and cytoplasm of thymocytes from sham and CLP mice after 1-MT treatment compared with vehicle (n = 5). B AhR expression in the nucleus and cytoplasm of thymocytes from sham and CLP mice after Kyn treatment compared with vehicle (n = 5). CE Representative images of thymus morphology (C), and quantification of thymus weight (D) and thymocyte counts (E) in sham and CLP mice after treatment with Kyn and AhR inhibitor TMF, compared to Kyn or vehicle alone (n = 6). F Representative HE staining of thymocytes from sham and CLP mice treated with Kyn and TMF, compared to Kyn or vehicle alone (scale bar = 50 μm). G Representative TEM images of thymocytes from sham and CLP mice treated with Kyn and TMF, compared to Kyn or vehicle alone (scale bar = 200 nm). H, I Flow cytometry analysis of ROS production (H) and lipid peroxidation (I) in thymocytes from sham and CLP mice treated with Kyn and TMF, compared to Kyn or vehicle alone (n = 6). J MDA levels in thymic tissue from sham and CLP mice treated with Kyn and TMF, compared to Kyn or vehicle alone (n = 10). K Immunofluorescence staining of 4-HNE in thymic sections from sham and CLP mice treated with Kyn and TMF, compared to Kyn or vehicle alone (scale bar = 25 μm). L Thymocytes were isolated from sham and CLP mice 24 h post-surgery. ChIP analysis was performed to assess AhR binding at XRE sites within the Pla2g4a promoter region, with IgG serving as a negative control (n = 3). Bars represent the means ± SEM.

Similar articles

References

    1. Abraham E. New definitions for sepsis and septic shock: continuing evolution but with much still to be done. JAMA. 2016;315:757–9. - PubMed
    1. Rudd KE, Johnson SC, Agesa KM, Shackelford KA, Tsoi D, Kievlan DR, et al. Global, regional, and national sepsis incidence and mortality, 1990–2017: analysis for the global burden of disease study. Lancet. 2020;395:200–11. - PMC - PubMed
    1. van der Poll T, van de Veerdonk FL, Scicluna BP, Netea MG. The immunopathology of sepsis and potential therapeutic targets. Nat Rev Immunol. 2017;17:407–20. - PubMed
    1. Boehm T, Swann JB. Thymus involution and regeneration: two sides of the same coin?. Nat Rev Immunol. 2013;13:831–8. - PubMed
    1. Taub DD, Longo DL. Insights into thymic aging and regeneration. Immunol Rev. 2005;205:72–93. - PubMed