. 2025 Jul 25;16(1):6884.
doi: 10.1038/s41467-025-62014-3.

An all-in-one pipeline for the in vitro discovery and in vivo testing of Plasmodium falciparum malaria transmission blocking drugs

Affiliations

An all-in-one pipeline for the in vitro discovery and in vivo testing of Plasmodium falciparum malaria transmission blocking drugs

Nicolas M B Brancucci et al. Nat Commun. .

Abstract

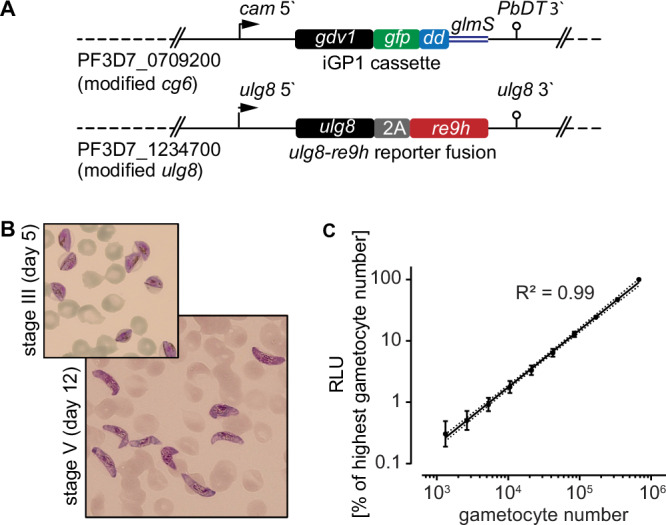
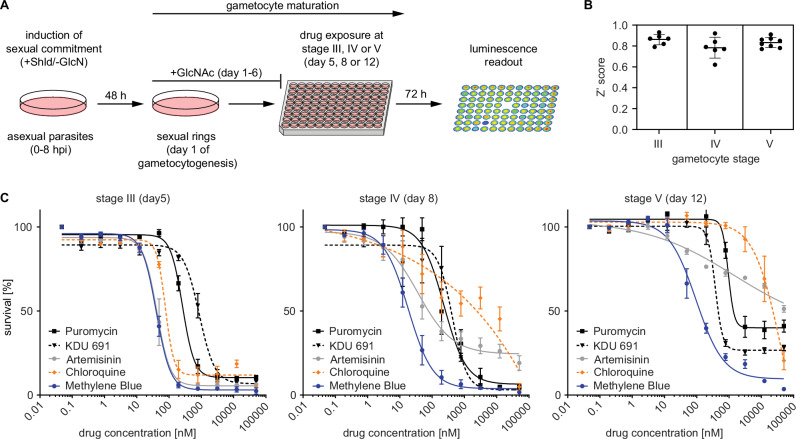
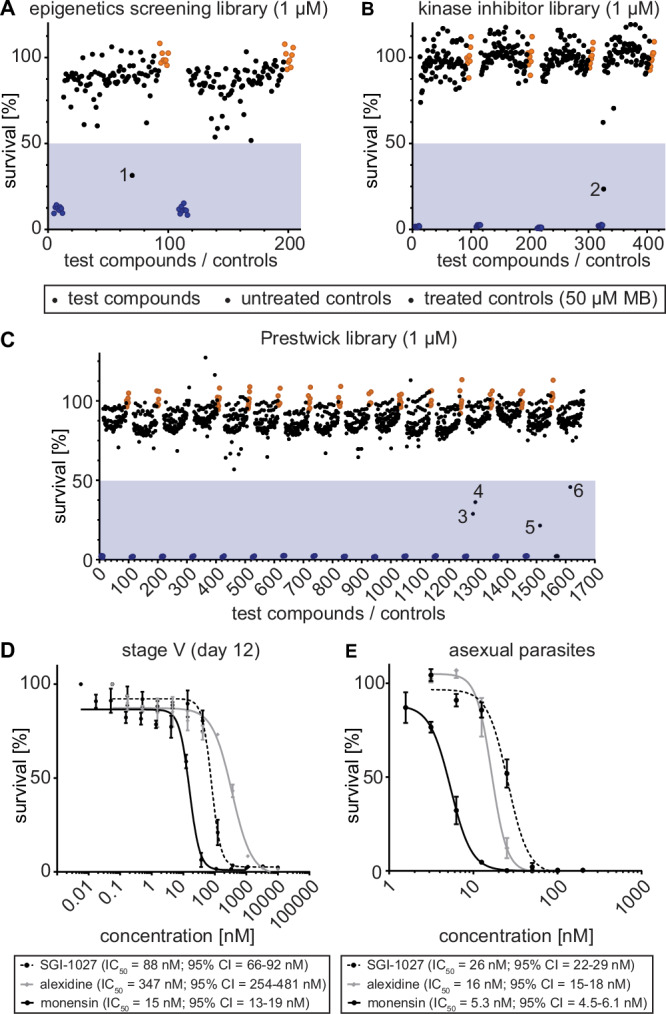
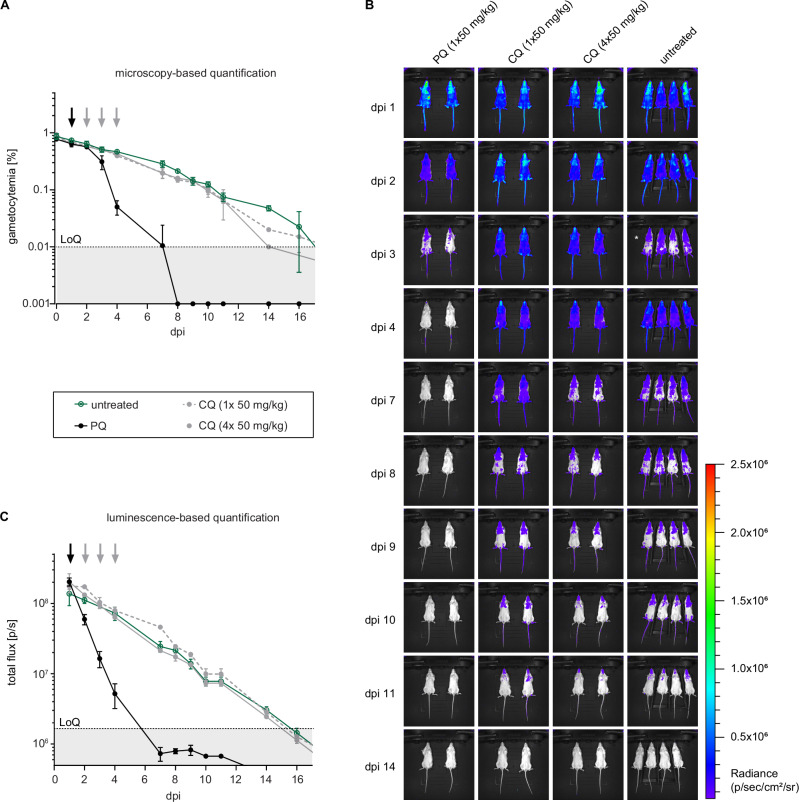
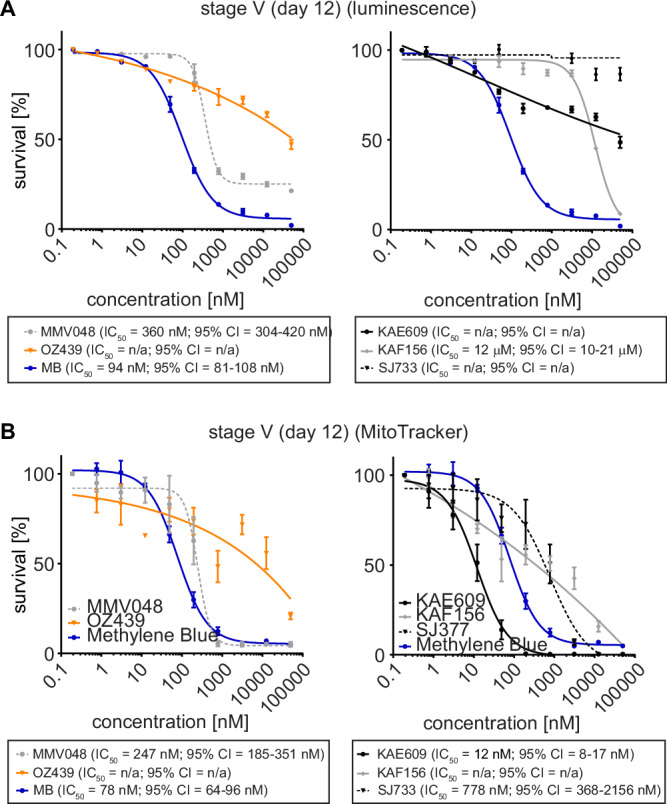
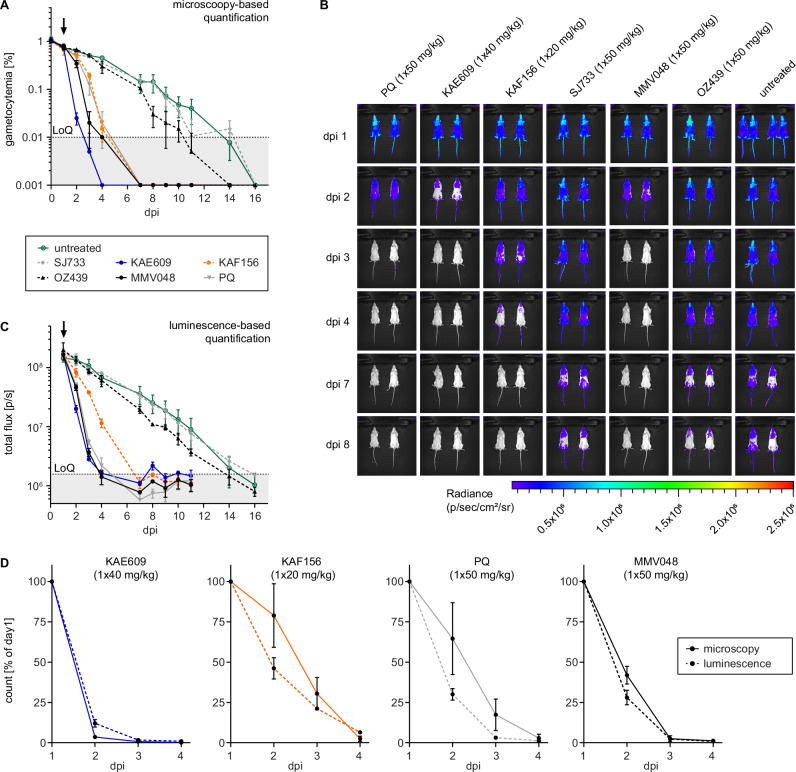
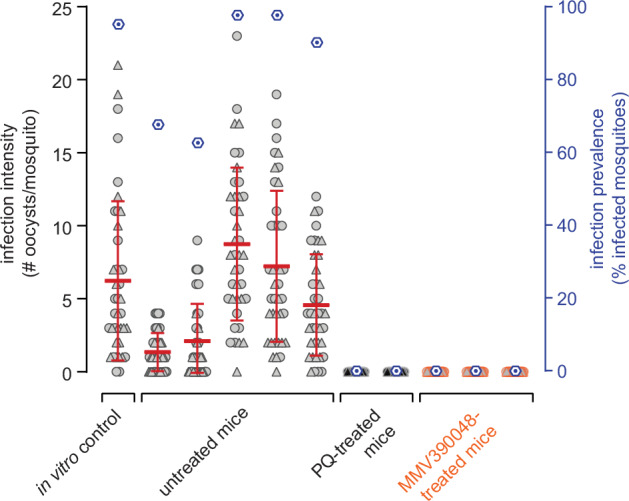
Elimination of malaria will require new drugs with potent activity against Plasmodium falciparum mature stage V gametocytes, the only stages infective to the mosquito vector. The identification and comprehensive validation of molecules active against these quiescent stages is difficult due to the specific biology of gametocytes, challenges linked to their cultivation in vitro and the lack of animal models suitable for evaluating the transmission-blocking potential of drug candidates in vivo. Here, we present a transmission-blocking drug discovery and development platform that builds on transgenic NF54/iGP1_RE9Hulg8 parasites engineered to conditionally produce large numbers of stage V gametocytes expressing a red-shifted firefly luciferase viability reporter. Besides developing a robust in vitro screening assay for the reliable identification of stage V gametocytocidal compounds, we also establish a preclinical in vivo malaria transmission model based on infecting female humanized NODscidIL2Rγnull mice with pure NF54/iGP1_RE9Hulg8 stage V gametocytes. Using whole animal bioluminescence imaging, we assess the in vivo gametocyte killing and clearance kinetics of antimalarial reference drugs and clinical drug candidates and identify markedly different pharmacodynamic response profiles. Finally, we combine this mouse model with mosquito feeding assays and thus firmly establish a valuable tool for the systematic in vivo evaluation of transmission-blocking drug efficacy.


Conflict of interest statement

Competing interests: D.L. is an employee of Medicines for Malaria Venture (MMV). B.B. and M.D. are employees of the Global Antibiotic Research & Development Partnership (GARDP) and were employed at MMV at the time of conceptualization and execution of the work. The remaining authors declare no competing interests.

Figures

Fig. 1
Fig. 1. NF54/iGP1_RE9Hulg8 gametocyte reporter line.
Engineering and validation of the NF54/iGP1_RE9Hulg8 reporter line for gametocytocidal drug research. A Schematic maps of the genetically modified loci in NF54/iGP1_RE9Hulg8 parasites. The cg6 locus carries an integrated conditional GDV1-GFP-DD over-expression cassette (iGP1) controlled by the P. falciparum calmodulin promoter (cam 5’) and the glmS ribozyme element followed by the P. berghei dihydrofolate-thymidylate synthase terminator (PbDT 3’). The ulg8 gene is tagged at the 3‘ end with a sequence encoding the 2 A split peptide and the RE9H luciferase. B Hemacolor-stained thin blood smears showing stage III (day 5) and mature stage V (day 12) NF54/iGP1_RE9Hulg8 gametocytes. Representative images of one of n = 4 biological replicates are shown. C Correlation between NF54/iGP1_RE9Hulg8 stage V gametocyte numbers (day 12) and RE9H-catalysed bioluminescence. Values on the y-axis represent RLUs normalized to the mean signal emitted from the wells containing the highest gametocyte number, obtained from n = 4 biological replicates (mean ± s.d.). Linear regression (black line), coefficient of determination (R2) and confidence bands (dashed lines) are indicated.
Fig. 2
Fig. 2. Development of an in vitro gametocytocidal drug assay using NF54/iGP1_RE9Hulg8 gametocytes.
Assay setup and validation. A Schematic illustrating the workflow used to produce synchronous NF54/iGP1_RE9Hulg8 gametocytes and stage-specific gametocytocidal compound testing in a 96-well plate format. Gametocytes are exposed to compounds at the desired day of gametocyte development and gametocyte viability is determined 72 h later via RE9H-catalysed bioluminescence readout. Shld, Shield-1; GlcN, glucosamine, GlcNAc, N-acetylglucosamine. B Z‘ scores calculated from the RLUs obtained from four untreated (0.1% DMSO) and four treated (50 μM MB) samples (technical replicates) routinely included on each drug assay plate. Thick horizontal lines represent the mean Z‘ scores calculated from n = 6 (stage III and IV) or n = 8 (stage V) different assay plates, error bars indicate the s.d. and individual values are represented as black dots. C Dose-response curves for reference antimalarials (ART, CQ) and experimental compounds (KDU691, puromycin, MB) tested against synchronous NF54/iGP1_RE9Hulg8 gametocytes at three different stages of development. Values on the y-axis represent RLUs normalized to the mean signal emitted from cells exposed to the lowest drug concentration, obtained from n = 3 (stage III and IV) or n = 4 (stage V) biological replicates (mean ± s.e.m.). IC50 values are shown in Table S1.
Fig. 3
Fig. 3. Screening of chemical libraries against NF54/iGP1_RE9Hulg8 stage V gametocytes.
Results from the primary screening of small- to medium-sized compound libraries. AC Effect of compounds of the Epigenetics Screening Library (Cayman Chemical) (A), human kinase inhibitors (SelleckChem, Enzo Life Sciences) (B) or compounds of the Prestwick Chemical Library (C) on NF54/iGP1_RE9Hulg8 stage V (day 12) gametocyte viability (1 µM concentration). Each assay plate included eight treated (50 µM MB; blue dots) and untreated (0.1% DMSO; orange dots) samples each as positive and negative controls, respectively. Values on the y-axis represent RLUs normalized to the mean signal emitted from the negative controls, obtained from n = 1 experiment for each library. Compounds with >50% inhibitory activity (blue shaded areas) are highlighted by numbers (1, SGI-1027; 2, SU4312; 3, monensin; 4, alexidine dihydrocholride; 5, indoprofen; 6, equilin). D Dose-response curves of SGI-1027, monensin and alexidine dihydrochloride tested against NF54/iGP1_RE9Hulg8 stage V gametocytes (day 12). Values on the y-axis represent RLUs normalized to the mean signal emitted from cells exposed to the lowest drug concentration, obtained from n = 3 biological replicates (mean ± s.e.m.) E Dose-response curves of SGI-1027, monensin and alexidine dihydrochloride tested against NF54 wild type asexual blood stage parasite multiplication. Values on the y-axis represent [3H]-hypoxanthine incorporation normalized to the mean signal emitted from eight untreated control samples per plate, obtained from n = 3 biological replicates (mean ± s.e.m.). IC50 values and 95% confidence intervals (CI) are indicated below the graphs.
Fig. 4
Fig. 4. Circulation and clearance of NF54/iGP1_RE9Hulg8 stage V gametocytes in the NSG-PfGAM in vivo model.
Mice were infected with 2 × 10⁸ NF54/iGP1_RE9Hulg8 stage V gametocytes (day 11) and treated one day after infection with 1 × 50 mg/kg PQ, 1 × 50 mg/kg CQ or four daily doses of 1 × 50 mg/kg CQ (days 1–4) or were left untreated. A Peripheral gametocytemia in treated and untreated NF54/iGP1_RE9Hulg8-infected mice as determined by microscopic inspection of Hemacolor-stained thin blood smears prepared daily from tail blood for 16 days. Arrows indicate the day(s) of treatment. Values on the y-axis represent gametocytemia (mean ± s.d.) obtained from n = 2 mice per drug/dose combination and n = 4 untreated control mice. B Representative ventral images of treated and untreated NF54/iGP1_RE9Hulg8-infected mice. Pseudocolour heat-maps indicate RE9H-catalysed bioluminescence intensity from low (blue) to high (red). Circulation of NF54/iGP1_RE9Hulg8 stage V gametocytes was monitored daily for 16 days following infection (only a selection of images is shown). For technical reasons, the uninfected control mice on day 3 post-infection had to be imaged 30 min after D-luciferin injection (instead of 1 min after D-luciferin injection for all other mice), which resulted in reduced signals (white asterisk). C Quantification of in vivo bioluminescence emitted from treated and untreated NF54/iGP1_RE9Hulg8-infected mice. Arrows indicate the day(s) of treatment. Values on the y-axis represent total photon flux (mean ± s.d.) obtained from n = 2 mice per drug/dose combination and n = 4 untreated control mice. dpi, days post infection; LoQ, limit of quantification (area below the LoQ is shaded gray); p/s, photons/second.
Fig. 5
Fig. 5. Activities of clinical drug candidates against NF54/iGP1_RE9Hulg8 stage V gametocytes in vitro.
Comparison of RE9H bioluminescence- and MitoTracker/gametocyte shape-based viability readouts for NF54/iGP1_RE9Hulg8 stage V gametocytes treated with clinical drug candidates. A Dose-response curves of MMV390048 and OZ439/artefenomel (left graph) and KAE609/cipargamin, KAF156/ganaplacide and SJ733 (right graph) tested against NF54/iGP1_RE9Hulg8 stage V gametocytes (day 12) using RE9H-catalysed bioluminescence as viability readout. MB was used as a positive control (identical data shown in both graphs). Values on the y-axis represent RLUs normalized to the mean signal emitted from cells exposed to the lowest drug concentration, obtained from n = 3 biological replicates (mean ± s.e.m.). B Dose-response curves of MMV390048 and OZ439/artefenomel (left graph) and KAE609/cipargamin, KAF156/ganaplacide and SJ733 (right graph) tested against NF54/iGP1_RE9Hulg8 stage V gametocytes (day 12) using MitoTracker signal/gametocyte shape as viability readout. MB has been used as a positive control (identical data shown in both graphs). Values on the y-axis represent normalized mean numbers of viable gametocytes obtained from n = 3 biological replicates (n = 2 biological replicates for OZ439/artefenomel and MMV390048) (mean ± s.e.m.). IC50 values and 95% confidence intervals (CI) are shown below the graphs.
Fig. 6
Fig. 6. In vivo therapeutic efficacy of clinical drug candidates against NF54/iGP1_RE9Hulg8 stage V gametocytes in the NSG-PfGAM model.
Mice were infected with 2 × 10⁸ NF54/iGP1_RE9Hulg8 stage V gametocytes (day 11) and were treated one day after infection with 1 × 40 mg/kg KAE609/cipargamin, 1 × 20 mg/kg KAF156/ganaplacide, 1 × 50 mg/kg SJ733, 1 × 50 mg/kg MMV390048, 1 × 50 mg/kg OZ439/artefenomel and 1 × 50 mg/kg PQ (positive control) or were left untreated. A Peripheral gametocytemia in treated and untreated NF54/iGP1_RE9Hulg8-infected mice as determined by microscopic inspection of Hemacolor-stained thin blood smears prepared daily from tail blood for 16 days. The arrow indicates the day of treatment. Values on the y-axis represent gametocytemia obtained from n = 2 mice per drug/dose combination and n = 4 untreated control mice (mean ± s.d.). B Representative ventral images of treated and untreated NF54/iGP1_RE9Hulg8-infected mice. Pseudocolour heat-maps indicate RE9H-catalysed bioluminescence intensity from low (blue) to high (red). Circulation of NF54/iGP1_RE9Hulg8 stage V gametocytes was monitored for 16 days following infection (only a selection of images up to day 8 is shown). C Quantification of in vivo bioluminescence signal emitted from treated and untreated NF54/iGP1_RE9Hulg8-infected mice. The arrow indicates the day of treatment. Values on the y-axis represent total photon flux obtained from n = 2 mice per drug/dose combination and n = 4 untreated control mice (mean ± s.d.). D Direct comparison of peripheral gametocytemia (solid lines) and in vivo bioluminescence signal (dashed lines) in NF54/iGP1_RE9Hulg8-infected mice treated with active molecules. Values on the y-axis represent % gametocytemia (microscopy readout) or total photon flux (luminescence readout) normalized to the corresponding values determined on day 1 after infection, obtained from n = 2 mice per drug/dose combination (mean ± s.d.) (same experiment as shown in panels A and C). dpi, days post infection; LoQ, limit of quantification (area below the LoQ is shaded gray); p/s, photons/second.
Fig. 7
Fig. 7. In vivo transmission-blocking efficacy of clinical drug candidates as assessed using the NSG-PfGAM mouse model.
Female Anopheles stephensi mosquitoes were allowed to feed on the blood taken from NODscidIL2Rγnull mice infected with 2 × 10⁸ NF54/iGP1_RE9Hulg8 stage V gametocytes (day 11) and were left untreated (positive control for mosquito infection; five mice) or were treated one day after infection with either 1 × 50 mg/kg PQ (positive control for transmission blockade; two mice) or 1 × 50 mg/kg MMV390048 (three mice). Blood samples were prepared for MFAs three days after infection/two days after treatment (day 14 of gametocyte maturation). A day 14 aliquot of the same in vitro gametocyte culture used to infect the mice was prepared for SMFAs and served as a further positive control for mosquito infection. Values on the left y-axis (infection intensity) show the number of oocysts detected in each of the 20 mosquitoes dissected per n = 2 technical replicate feeds, with open circles and triangles representing the results obtained from the two separate feeds, respectively. The thick red horizontal lines represent the mean numbers of oocysts per mosquito, error bars indicate the s.d.. Values on the right y-axis (infection prevalence) represent the mean percentage of infected mosquitoes obtained from the combined replicate feeds for each condition (dark blue hexagons).

Similar articles

References

    1. World Health Organisation. World Malaria Report 2023. WHO Press (2023).
    1. Josling, G. A., Williamson, K. C. & Llinas, M. Regulation of sexual commitment and gametocytogenesis in malaria parasites. Annu Rev. Microbiol72, 501–519 (2018). - PMC - PubMed
    1. Venugopal, K., Hentzschel, F., Valkiunas, G. & Marti, M. Plasmodium asexual growth and sexual development in the haematopoietic niche of the host. Nat. Rev. Microbiol18, 177–189 (2020). - PMC - PubMed
    1. Rabinovich, R. N. et al. malERA: An updated research agenda for malaria elimination and eradication. PLoS Med14, e1002456 (2017). - PMC - PubMed
    1. Dhorda, M., Amaratunga, C. & Dondor,p A. M. Artemisinin and multidrug-resistant Plasmodium falciparum – a threat for malaria control and elimination. Curr. Opin. Infect. Dis.34, 10.1097/QCO.0000000000000766 (2021). - PMC - PubMed

LinkOut - more resources