. 2025 Jul 25;16(1):6871.
doi: 10.1038/s41467-025-62188-w.

Distinct role of claustrum and anterior cingulate cortex bidirectional circuits in methamphetamine taking and seeking

Affiliations

Distinct role of claustrum and anterior cingulate cortex bidirectional circuits in methamphetamine taking and seeking

Manqing Wu et al. Nat Commun. .

Abstract

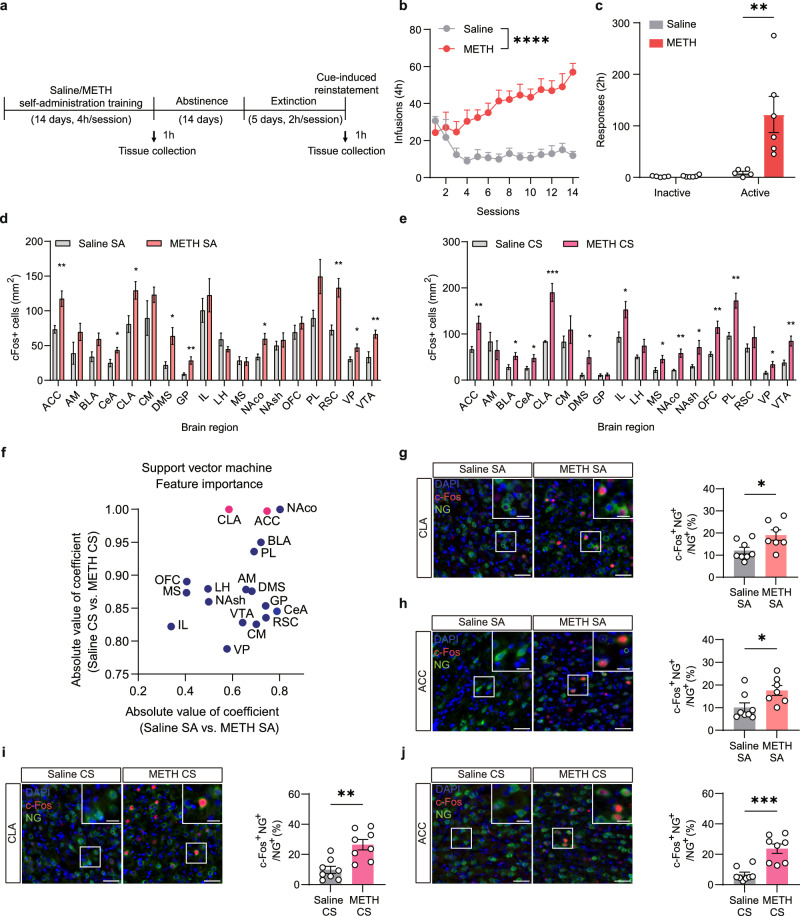
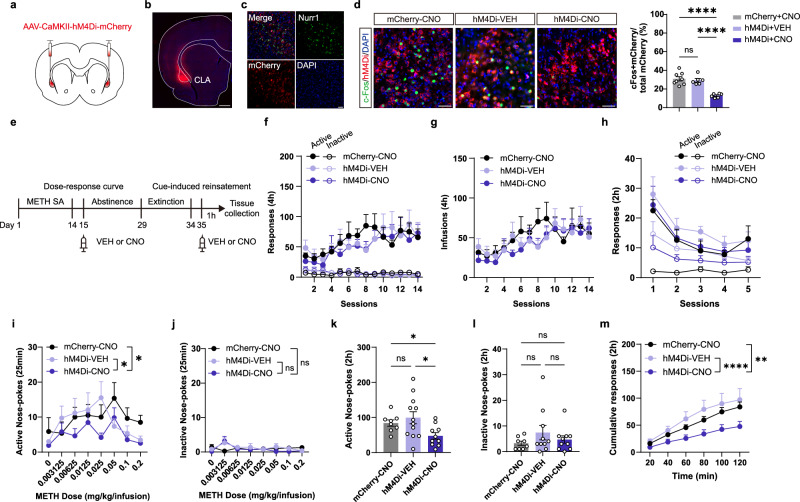
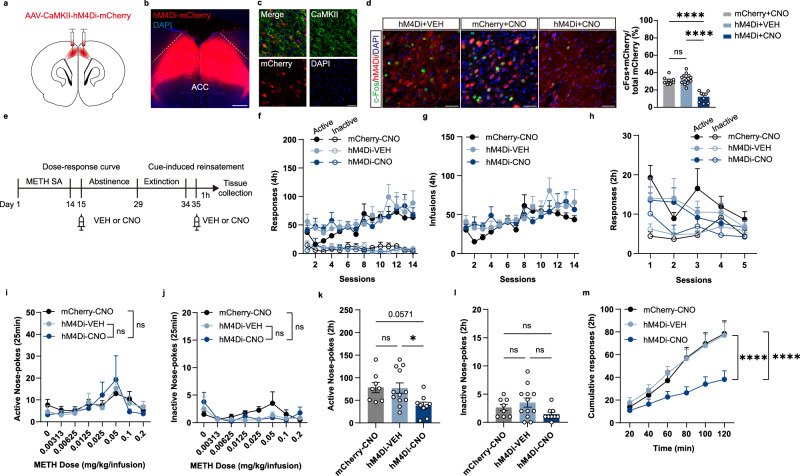
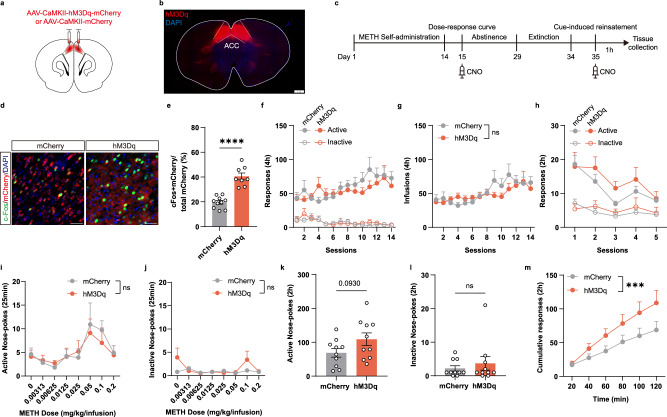
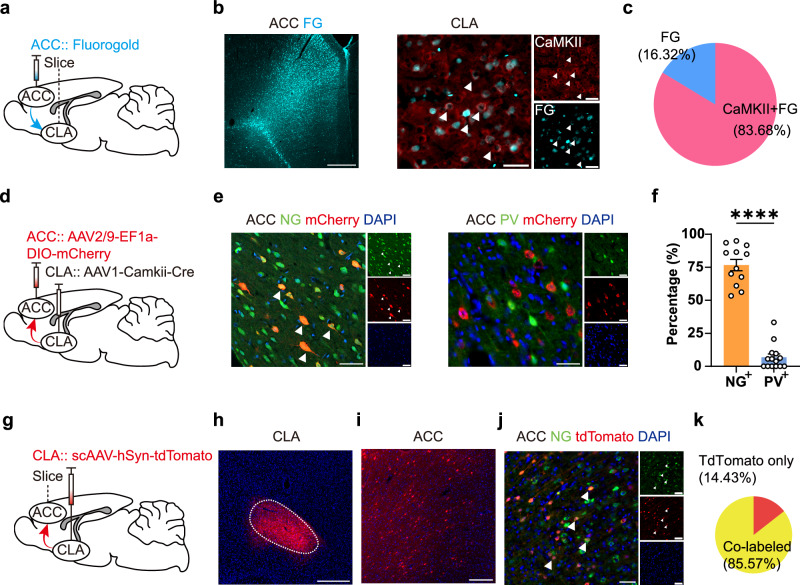
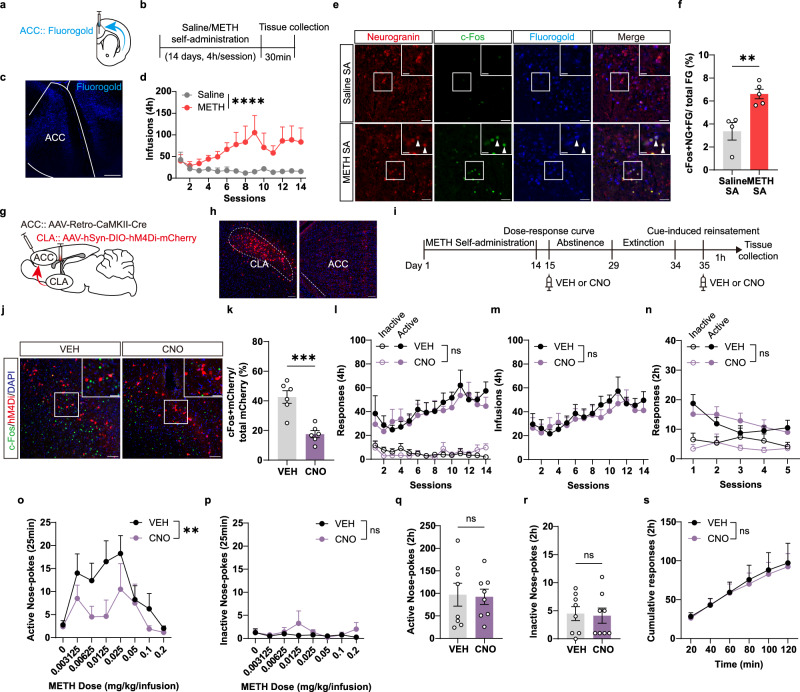
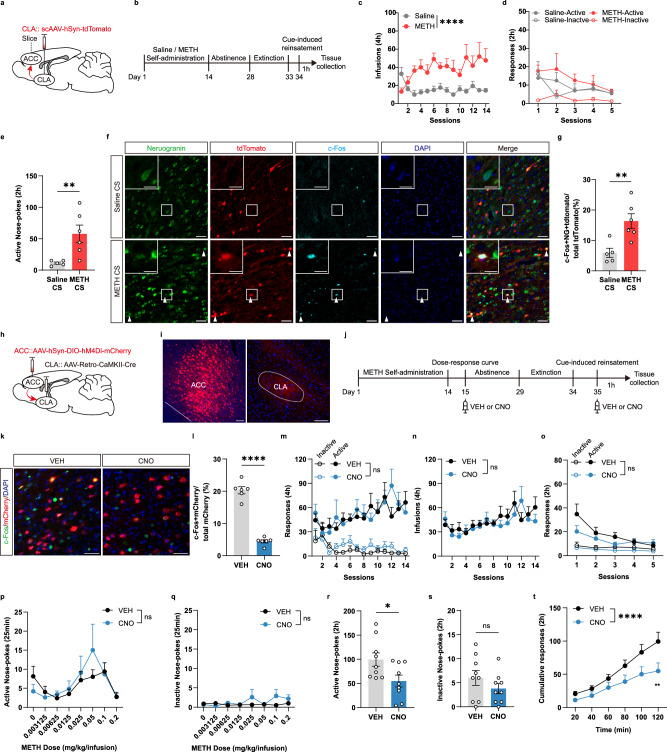
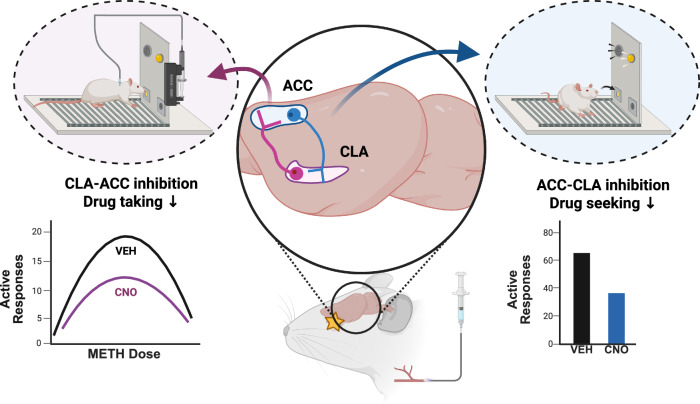
Methamphetamine (METH) addiction involves escalating intake with strong cue reactivity, and high relapse risk, yet its neural mechanism remains unclear. Using c-Fos mapping and machine learning, we identified the claustrum (CLA), a subcortical region reciprocally connected with the anterior cingulate cortex (ACC), as key mediators of both METH taking and seeking in self-administering male rats. Chemogenetic inhibition of CLA suppressed both drug consumption and cue-induced reinstatement, while ACC inhibition selectively reduced drug-seeking. Circuit tracing and manipulation revealed that the CLA-ACC circuit supported drug-taking, whereas the ACC-CLA circuit was specifically recruited during drug-seeking. Activity-dependent labeling showed that ACC ensembles activated by cues overlapped with those engaged during prior drug use. These findings suggest that CLA drives METH reward through the ACC, while the ACC gains cue salience and feeds back to CLA, reinforcing relapse. Targeting this bidirectional CLA-ACC circuit may provide novel therapeutic strategies for treating METH addiction.


Conflict of interest statement

Competing interests: The authors declare that they have no competing interests.

Figures

Fig. 1
Fig. 1. Identification of ACC and CLA as key regions in methamphetamine reward and cue-induced seeking using brain-wide activation mapping.
a Experiment timeline. b METH versus saline self-administration (SA) infusions (Saline: n = 11, METH: n = 13; two-way ANOVA). c Active and inactive responses during cue-induced reinstatement (Saline: n = 5, METH: n = 6; two-way ANOVA). d, e c-Fos immunostaining quantification across 18 brain regions during METH reward (d) or cue-induced reinstatement (e). For (d), METH SA (n = 7 rats) and saline SA (n = 6 rats; Student’s t test). For (e), groups include METH cue-induced reinstatement (METH CS, n = 6 rats) and saline cue-induced reinstatement (Saline CS) (n = 5 rats; Student’s t test). Abbreviations for brain areas are listed in Supplementary Table 1. f Coefficients for brain regions in two classifications (Saline SA vs. METH SA; Saline CS vs. METH CS) calculated by a support vector classifier. g, h Representative images and quantification of c-Fos cells (red) among glutamatergic neurons with neurogranin (NG, green) as markers in the CLA (g, Student’s t test) and ACC (h, Student’s t test) during Saline SA and METH SA. (Saline, n = 8 rats; METH, n = 7 rats) Scale bar, 50 µm and 20 µm (zoomed-in panels). i, j Representative images and the percentage of c-Fos positive cells (red) among glutamatergic neurons (green) in CLA (i, Student’s t test) or ACC (j, Student’s t test) during the cue-induced reinstatement. (n = 8 rats per group) Scale bar, 50 µm and 20 µm (zoomed-in panels). Data presented as mean ± SEM. *p < 0.05; **P < 0.01; ***, p < 0.001; ****p < 0.0001.
Fig. 2
Fig. 2. Inhibition of the CLA pyramidal neurons suppress METH taking and cue-induced seeking.
a Scheme for specific infection of pyramidal neurons in the CLA with hM4Di. b Representative image illustrating hM4Di-mCherry expression in the CLA. Scale bar, 500 µm. c Representative fluorescence image showing hM4Di-mCherry (red) co-expressed with CLA-enriched marker Nurr1 (green) in the CLA. Scale bar, 50 µm. d Chemogenetic suppression validation in CLA neurons. (Left) Immunofluorescence images showing c-Fos expression (green) in mCherry-positive neurons (red) across groups: mCherry control + CNO, hM4Di + vehicle, and hM4Di + CNO. (Right) Quantitative analysis of c-Fos expression relative to mCherry in each group. (mCherry + CNO, n = 8; hM4Di + VEH, n = 6; hM4Di + CNO, n = 8; one-way ANOVA followed by Tukey’s multiple comparisons). Scale bar, 50 µm. e Experimental design for behavioral tests. f Nose-poke responses during METH SA training for rats later assigned to different treatment groups in the dose-response test (two-way ANOVA). g Number of drug infusions during the METH SA (two-way ANOVA). h Number of nose-pokes during extinction for rats assigned to different groups in the drug-seeking test (two-way ANOVA). i, j Effect of chemogenetic inhibition of CLA pyramidal neurons on METH reward, evaluated by a dose-response curve. Active nose-pokes (i, two-way ANOVA) and inactive nose-pokes (j, two-way ANOVA) were measured. km Effect of chemogenetic inhibition of CLA pyramidal neurons on drug-seeking. Number of active nose-pokes (k, Brown-Forsythe ANOVA with Dunnett’s T3 multiple comparisons test), inactive nose-pokes (l, one-way ANOVA with Bonferroni’s test), and cumulative active nose-pokes (m, two-way ANOVA with Bonferroni’s test) in the cue-induced reinstatement test. For (fm), mCherry + CNO, n = 8; hM4Di + VEH, n = 12; hM4Di + CNO, n = 10. Data presented as mean ± SEM. *p < 0.05; **p < 0.01; ****p < 0.0001.
Fig. 3
Fig. 3. Chemogenetic inhibition of ACC glutamatergic neurons suppress cue-induced drug-seeking but not METH taking.
a Scheme for specific infection of pyramidal neurons in the ACC with hM4Di. b Representative image showing hM4Gi expression in the ACC. Scale bar, 500 µm. c Co-localization of CaMKII (green), hM4Di-mCherry (red), DAPI (blue) in the viral infected ACC region. Scale bar, 50 µm. d Immunofluorescence of c-Fos (green) and mCherry (red) expression across different treatment groups (mCherry + CNO, hM4Di + VEH, hM4Di + CNO). Scale bar, 50 µm. Quantification of c-Fos relative to mCherry within the ACC (one-way ANOVA with Bonferroni’s test). e Schematic timeline of the experiment. f, g Number of nose-poke responses (f, two-way ANOVA) and METH infusions (two-way ANOVA) during METH SA training for rats later assigned to different treatment groups in the dose-response test. h The number of active and inactive nose-pokes decreased over 5 extinction sessions for rats assigned to different groups in the drug-seeking test (two-way ANOVA). i, j Effect of chemogenetic inhibition of ACC glutamatergic neurons on METH reward, evaluated by a dose-response curve. Active nose-pokes (i, two-way ANOVA) and inactive nose-pokes (j, two-way ANOVA) were measured. km Effect of chemogenetic inhibition of ACC glutamatergic neurons on cue-induced reinstatement. Number of active nose-pokes (k, one-way ANOVA with Bonferroni’s test) and inactive nose-pokes (l, one-way ANOVA) in the cue-induced reinstatement test. Time course of cumulative active nose-pokes during the test (m, two-way ANOVA with Bonferroni’s test). Data presented as mean ± SEM, mCherry + CNO, n = 8, hM4Di + VEH, n = 12, hM4Di + CNO, n = 9. *p < 0.05, ***p < 0.005, ****p < 0.0001.
Fig. 4
Fig. 4. Chemogenetic activation of ACC glutamatergic neurons tends to facilitate cue-induced drug-seeking but not METH taking.
a Schematic of hM3Dq expression in ACC pyramidal neurons for chemogenetic activation. b Representative image of hM3Dq-mCherry expression in the ACC pyramidal neurons. Scale bar, 1 mm. c Schematic timeline of the experiment. d Immunofluorescence staining of c-Fos (green) of mCherry (red), and hM3Dq (red) group in ACC. Scale bar, 50 µm. e Quantification of c-Fos expression relative to mCherry in mCherry and hM3Dq groups (Student’s t test, mCherry, n = 10, hM3Dq, n = 8). f Daily active and inactive nose-pokes for mCherry and hM3Dq groups during METH SA training (two-way ANOVA). g The number of drug infusions during METH SA in mCherry and hM3Dq groups (two-way ANOVA followed by Bonferroni’s test). h Number of active nose-pokes and inactive nose-pokes decreased over 5 extinction sessions in mCherry and hM3Dq groups (two-way ANOVA). i, j Effect of chemogenetic activation of ACC glutamatergic neurons on METH reward, evaluated by a dose-response curve. Active nose-pokes (i, two-way ANOVA) and inactive nose-pokes (j, two-way ANOVA) were measured. km Effect of chemogenetic activation of ACC glutamatergic neurons on cue-induced reinstatement. Number of active nose-pokes (k, Student’s t test) and inactive nose-pokes in the cue-induced reinstatement test (l, Welch’s t test). Time course of cumulative active nose-pokes measured in 20 min intervals during the test. (m, two-way ANOVA with Bonferroni’s multiple comparisons). For (f, m), mCherry, n = 10; hM3Dq, n = 10. Data presented as mean ± SEM. *p < 0.05, ***p < 0.005, ****p < 0.0001.
Fig. 5
Fig. 5. Projection profiles of CLA reciprocal connectivity with the ACC.
ac Schematic of retrograde tracer Fluorogold (FG, cyan) injection into the ACC (a), CaMKII staining (red) in CLA slices (b), and statistics showing the CLAglu-ACC projection (c, n = 207 cells from 5 rats). Scale bar, 50 µm. d Experimental design for selective expression of mCherry in ACC neurons receiving CLA glutamatergic projections. e Immunostaining showing specific expression of mCherry+ (red) in glutamatergic neurons (NG+, green), but not in parvalbumin-expressing interneurons (PV+, green). Scale bar, 50 µm. f Percentages of CLA inputs to ACC neurons expressing neurogranin (NG+) or parvalbumin (PV+). (Student’s t test, NG staining, n = 12 sections from 6 rats, PV staining, n = 14 sections from 6 rats). g Schematic of retrograde virus scAAV-hSyn-tdTomato injection into the CLA. h Representative image of tdTomato expression (red) in the CLA. Scale bar, 500 µm. i Representative image of tdtTomato expression in the ACC. Scale bar, 200 µm. j, k Immunostaining showing expression of tdTomato (red) and neurogranin (NG, green) in ACC slices (j) and statistics for the ACCglu-CLA projection (k, n = 880 cells from 6 rats). Scale bar, 50 µm. Data presented as mean ± SEM. ****p < 0.001.
Fig. 6
Fig. 6. METH taking recruits CLA-ACC glutamatergic projections.
a Schematic of Fluorogold (FG) injection into the ACC. b Experimental timeline for saline or METH SA. c Representative image of FG injection (blue) in the ACC. Scale bar, 500 µm. d The number of infusions in saline (n = 4) or METH (n = 5) SA (two-way ANOVA). e Immunofluorescence images showing co-labeling of c-Fos (green) and FG (blue) in CLA pyramidal neurons (red). Scale bar, 50 µm. f Quantification of colocalization of Neurogranin, c-Fos, and FG relative to total FG-positive cells in CLA-ACC neurons (saline, n = 4; METH, n = 5, Student’s t test). g Schematic showing the viral strategy to target CLA-projecting ACC neurons. h Representative images showing mCherry expression in CLA and ACC. Scale bar = 500 µm (left), 100 µm (right). i Timeline of the experiment. j Representative images of c-Fos (green) and mCherry (red) expression in rats treated with VEH or CNO. Scale bar, 100 µm and 50 µm (zoomed in panels). k Quantification of c-Fos expression relative to mCherry (n = 6 per group, Student’s t test). l, m Number of responses (two-way ANOVA) and infusions (two-way ANOVA) during METH SA for rats assigned to different groups in METH reward test. n Number of responses during extinction for rats assigned to VEH or CNO groups in the drug-seeking test (two-way ANOVA). o, p Inhibition of CLA-ACC glutamatergic neurons reduced active nose-pokes (o, two-way ANOVA) during METH reward, with no change in inactive nose-pokes (p, two-way ANOVA). qs Inhibition of CLA-ACC glutamatergic neurons did not alter the number of active nose-pokes (q, Student’s t test), inactive nose-pokes (r, Mann-Whitney U test), and cumulative active nose-poles (s, two-way ANOVA with Bonferroni’s multiple comparisons) in cue-induced reinstatement. For (l, m), n = 8 rats in each group. Data presented as mean ± SEM. **p < 0.01, ****p < 0.001.
Fig. 7
Fig. 7. Effect of ACC-CLA glutamatergic pathway inhibition on METH taking and cue-induced drug-seeking.
a Schematic of retrograde AAV injection. b Experiment timeline. c Number of infusions in SA training (two-way ANOVA). d Extinction behavior did not differ between groups (two-way ANOVA). e METH group showed higher active nose-pokes during cue-induced reinstatement (Mann-Whitney U test). f Representative images showing colocalization of tdTomato (red), c-Fos (cyan), and neurogranin (green) in the ACC. Scale bar, 50 µm (main) and 20 µm (zoom-in). g Quantification of triple-labeled tdTomato + ACC-CLA neurons showed greater activation in METH vs. saline rats (Student’s t test). h Schematics of AAV injections. i mCherry expression in CLA and ACC. Scale bar, 100 µm. j Experiment timeline. k, l Representative images (k, scale bar, 50 µm) and quantification (l, n = 6 per group, Student’s t test) of c-Fos in the ACC after VEH or CNO treatment. m, n Number of responses (two-way ANOVA) and infusions (two-way ANOVA) during SA acquisition for rats assigned to different groups in the dose-response test. (VEH, n = 10, CNO, n = 8). o Extinction curves for rats assigned to different groups in the drug-seeking test. (n = 9 per group, two-way ANOVA). p, q ACC-CLA pathway inhibition did not affect active (p, two-way ANOVA) nor inactive nose-pokes (q, two-way ANOVA) in METH reward test. (VEH, n = 10, CNO, n = 8). rt Chemogenetic inhibition of the ACC-CLA pathway reduced active nose-pokes (r, Student’s t test) but not inactive nose-pokes (s, Student’s t test) during drug seeking. Cumulative active nose-pokes during drug seeking test (t, n = 9 per group, two-way ANOVA with Bonferroni’s multiple comparisons). Data presented as mean ± SEM. *p < 0.05; **p < 0.01; ****p < 0.0001. For (c, g), saline, n = 5; METH, n = 6.
Fig. 8
Fig. 8. Schematic summary of the present study.
Methamphetamine (METH) self-administration activates a bottom-up glutamatergic pathway from the claustrum (CLA) to the anterior cingulate cortex (ACC), facilitating drug-taking behavior. Chemogenetic inhibition of this CLA-ACC pathway specifically downshifts METH dose-response. While ACC pyramidal neurons are activated by METH reward, their activity is not required for drug reinforcement. Instead, ACC pyramidal neurons predominantly regulate drug-seeking behavior by activating CLA-projecting neurons during cue-induced reinstatement. Inhibition of this top-down ACC-CLA glutamatergic circuit specifically reduces drug-seeking behavior without affecting the drug reward process. This study highlights the bidirectional CLA-ACC-CLA circuit, which differentially modulates drug-taking and drug-seeking behaviors. The graph was created in BioRender. Wu, A. (2025) https://BioRender.com/i45c405.

Similar articles

References

    1. World Drug Report 2024. (United Nations publication, 2024).
    1. Brecht, M. L. & Herbeck, D. Time to relapse following treatment for methamphetamine use: a long-term perspective on patterns and predictors. Drug Alcohol Depend.139, 18–25 (2014). - PMC - PubMed
    1. Huang, M. C. et al. Risk factors for relapse among methamphetamine users receiving a joint legal-medical treatment program as a diversion intervention: A one-year follow-up study. J. Subst. Use Addict. Treat.151, 208955 (2023). - PubMed
    1. Koob, G. F. & Volkow, N. D. Neurobiology of addiction: a neurocircuitry analysis. Lancet Psychiatry3, 760–773 (2016). - PMC - PubMed
    1. Paulus, M. P. & Stewart, J. L. Neurobiology, clinical presentation, and treatment of methamphetamine use disorder: A review. JAMA Psychiatry77, 959–966 (2020). - PMC - PubMed

MeSH terms

Substances

LinkOut - more resources