. 2025 Jul 25;16(1):561.
doi: 10.1038/s41419-025-07887-4.

Inhibition of the Caveolin-1 pathway promotes apoptosis and overcomes pan-tyrosine kinase inhibitor resistance in hepatocellular carcinoma

Collaborators, Affiliations

Inhibition of the Caveolin-1 pathway promotes apoptosis and overcomes pan-tyrosine kinase inhibitor resistance in hepatocellular carcinoma

Tasnuva D Kabir et al. Cell Death Dis. .

Abstract

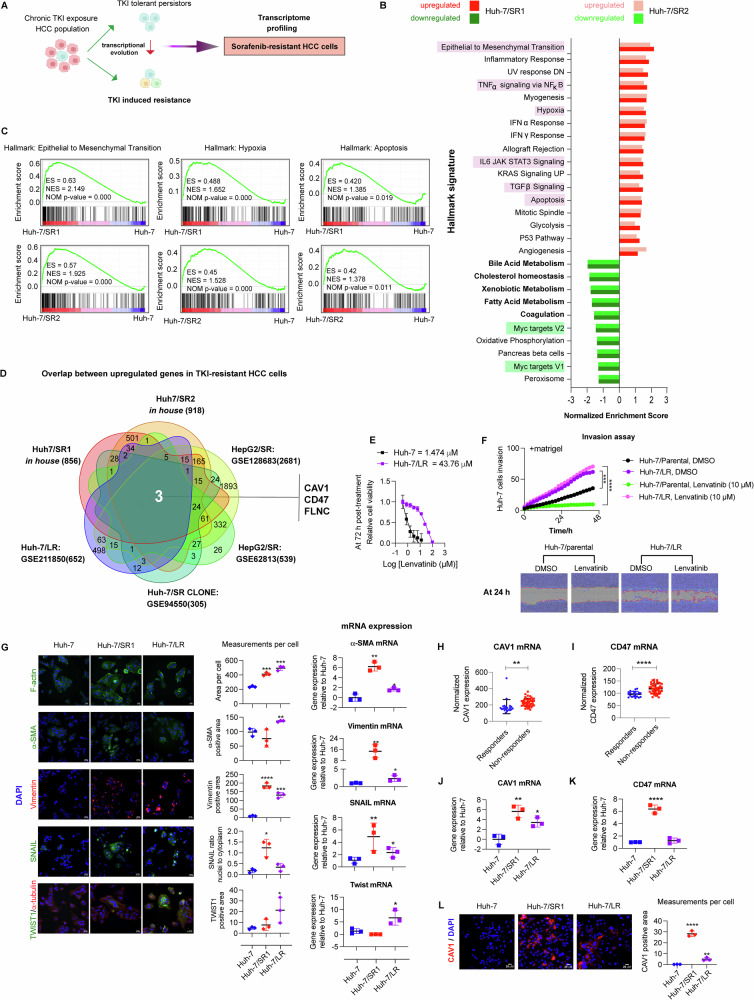
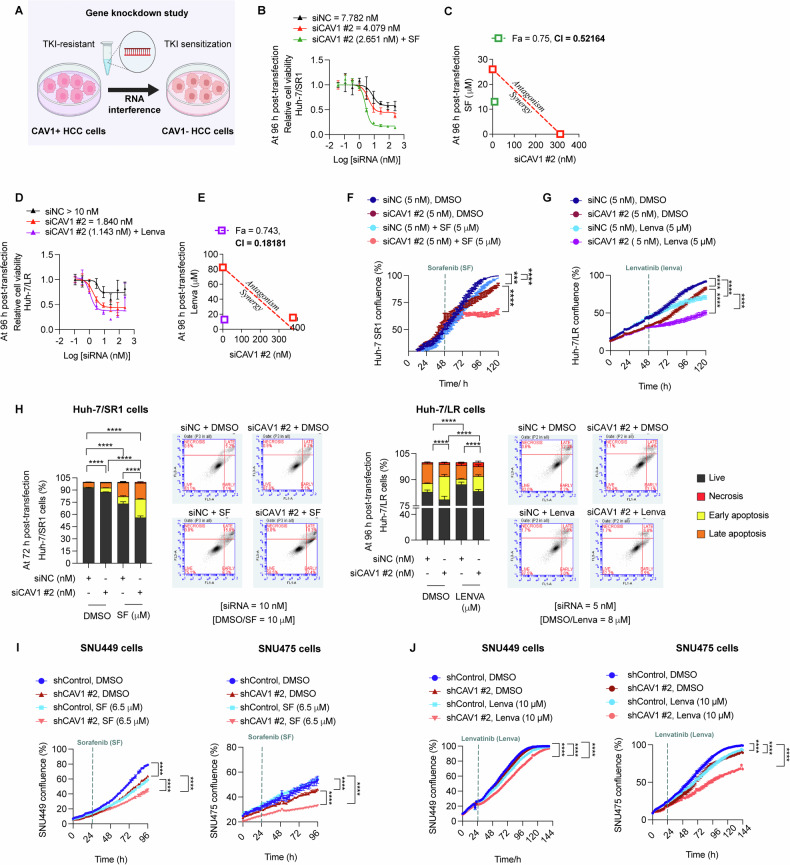
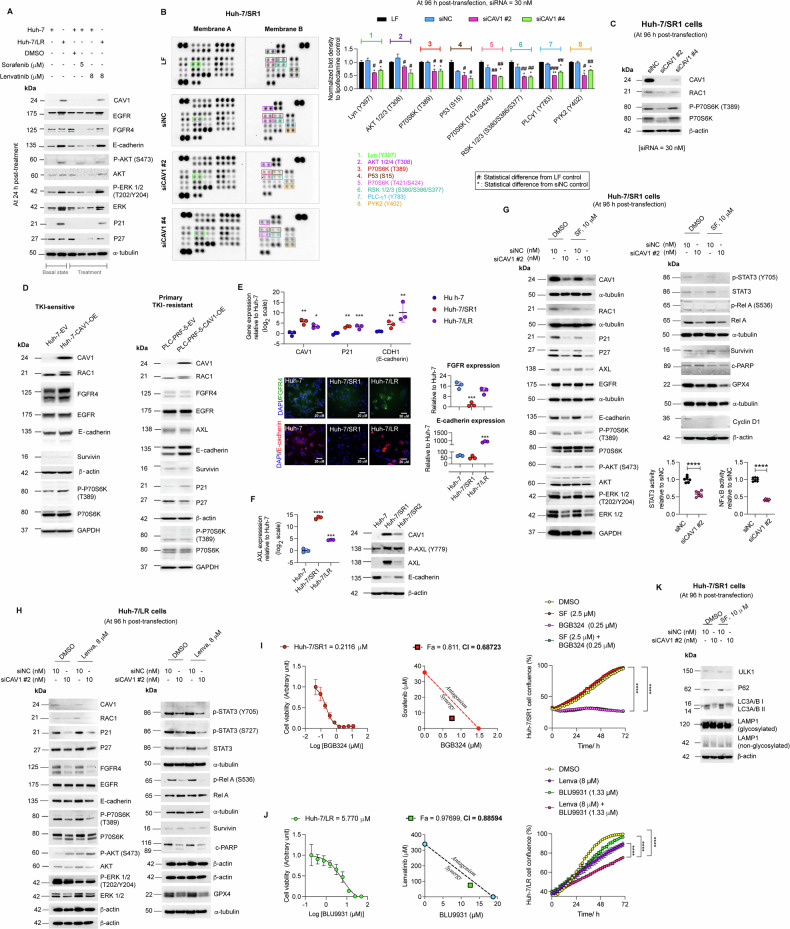
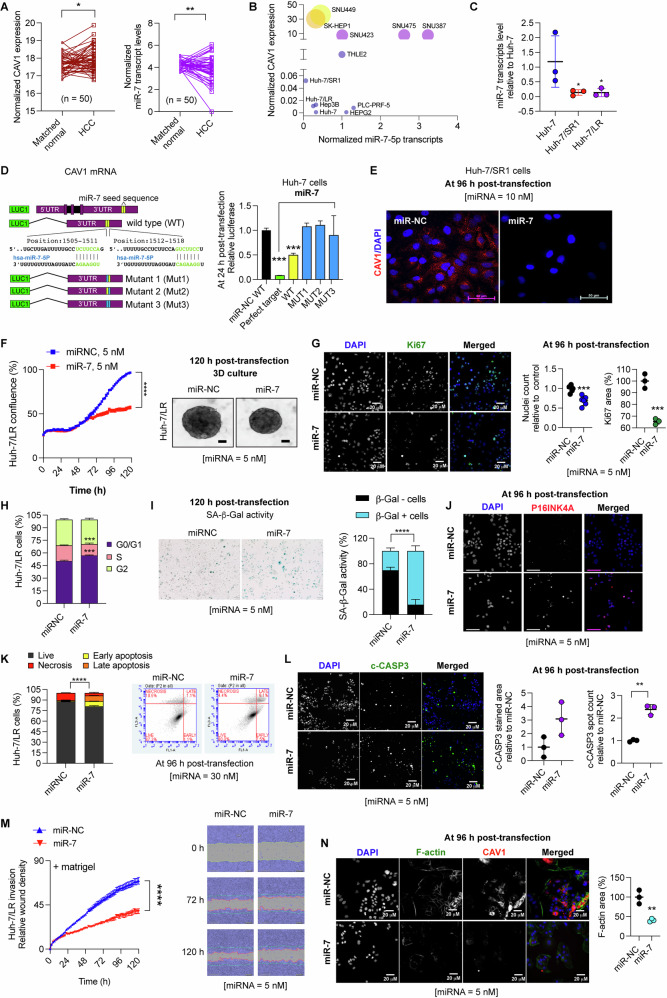
Resistance to multi-tyrosine kinase inhibitors (TKI) is a major clinical concern in advanced hepatocellular carcinoma (HCC). Herein, we aimed to uncover the mechanisms underlying pan-TKI resistance and to identify potential therapeutic targets. We used multiple TKI-resistant HCC cell lines to identify caveolin-1 (CAV1) as a key driver of therapeutic resistance. CAV1 downregulation induced apoptosis, inhibited metastasis and restored TKI sensitivity in both inherent and acquired TKI-resistant HCC cells. Mechanistically, in acquired TKI-resistant cells aberrant CAV1/STAT3/P70S6K signalling is required for their survival, motility, and invasiveness. CAV1 inhibition reduced expression of dormancy regulators E-cadherin, RAC1 and p21, enhanced cancer stemness markers, and disrupted downstream STAT3/P70S6K and AMPKα signalling pathways, prompting cancer cells to exit from dormancy and initiate autophagy-induced cell death. Furthermore, selective inhibition of AXL and FGFR4 downstream of the CAV1 pathway sensitized TKI-resistant cells to sorafenib and lenvatinib, respectively. In addition, microRNA-7-5p (miR-7) was identified as an endogenous regulator of CAV1; and miR-7's inhibitory effect on CAV1 and FGFR4 suppressed the STAT3/P70S6K pathway, promoted autophagy and triggered apoptosis in lenvatinib-resistant cells. Combination therapy using either lenvatinib or sorafenib and selective CAV1 inhibitors (e.g., siCAV1/miR-7), or AXL/FGFR4 inhibitors (e.g., BGB324/BLU9931) effectively overcame pan-TKI resistance. In HCC patient datasets, elevated CAV1 mRNA was observed in sorafenib non-responders, and single cell RNA-sequencing of HCC patient tumours revealed a rare population of CAV1+ cancer cells associated with recurrence. High CAV1 expression was specific to HBV+ HCC patients and independently predicted poor survival. Further, targeting of CAV1, AXL or FGFR4 effectively overcame TKI resistance in HCC patient derived organoids (PDOs). Our findings highlight a previously unrecognized role for CAV1-driven signalling in sustaining tumour dormancy, a critical and challenging therapeutic barrier underlying recurrence and pan-TKI resistance in HCC. Therapeutically targeting these pathways offer a promising and novel strategy to eliminate dormant tumour cells, thereby overcoming resistance and improving treatment outcomes.


Conflict of interest statement

Competing interests: The authors declare no competing interests. Ethics approval and consent to participate: All methods were carried out in accordance with relevant guidelines and regulations and approved by the Sir Charles Gairdner Osborne Park Health Care Group Human Research Ethics Committee (approval number RGS0000000919). Informed consent was obtained from all participants, with anonymity and confidentiality maintained throughout the study. The research adhered to the ethical principles of the Declaration of Helsinki (2008) and was conducted in accordance with the Australian Code for the Responsible Conduct of Research (2018).

Figures

Fig. 1
Fig. 1. Discovery of CAV1 as a driver of pan-tyrosine kinase inhibitor resistance in HCC.
A Experimental design. B Hallmark pathways up- and downregulated in sorafenib-resistant Huh-7/SR1 and Huh-7/SR2 cells (n = 3 per group). C Gene set enrichment plots showing enrichment score (ES), normalised enrichment score (NES) and nominal p-value (NOM p-value) for epithelial-to-mesenchymal transition (EMT), hypoxia and apoptosis hallmark pathways in Huh-7/SR1 and Huh-7/SR2 cells relative to parental Huh-7 cells. D Gene overlap analysis of upregulated genes in Huh-7/SR1, Huh-7/SR2, Huh-7 A7 clone (GSE94550), sorafenib-resistant HepG2 cells (GSE62813 and GSE128683) and lenvatinib-resistant Huh-7/LR cells (GSE211850). E Lenvatinib dose-response curve in Huh-7 and Huh-7/LR cells, as determined by cell titre assay (n = 3). F IncuCyte scratch assay evaluating lenvatinib’s effect on cell invasion through Matrigel in Huh-7 and Huh-7/LR cells (n = 3). G Validation of EMT markers (F-actin, α-smooth muscle actin (α-SMA), Vimentin, Snail and Twist1) in Huh-7/SR1 and Huh-7/LR cells using immunofluorescence immunocytochemistry and RT-qPCR (n = 3 per group). Expression levels of H CAV1 and I CD47 mRNA in sorafenib recipients from the Biostorm HCC cohort of STORM trial; responders (n = 21) vs non-responders (n = 46). RT-qPCR of J CAV1 and K CD47 expression in Huh-7/SR1 and Huh-7/LR cells (n = 3). L Immunofluorescence immunocytochemistry of CAV1 in Huh-7/LR cells (n = 3). Each experiment was performed on three independent days with at least three technical replicates. Error bars represent SD. Data were analysed by one-way ANOVA ( > 2 groups) and unpaired two-tailed student’s t-test. Significance is denoted as follows: *p < 0.05, **p < 0.01, ***p < 0.001, ****p < 0.0001.
Fig. 2
Fig. 2. CAV1 regulates survival, motility and apoptosis in TKI-resistant HCC cells via modulating RAC1 and vimentin.
A FACS analysis showing the proportion of CAV1+cancer cells in Huh-7 after chronic treatment with lenvatinib and sorafenib (n = 3 per group). B Immunofluorescence immunocytochemistry of CAV1 and F-actin in Huh-7, Huh-7/SR1 and Huh-7/SR2 cells (n = 3). C Western blot analysis of CAV1 and RAC1 in parental vs. sorafenib-resistant Huh-7/SR cells (n = 3). D Measurement of cell stiffness of Huh-7 cells and its sorafenib-resistant derivatives using atomic force microscopy (AFM) (n = 3, each dot represents one individual cell). E Schematics of gene overexpression study. F Western blot confirming CAV1 overexpression (OE) in Huh-7 cells; Huh-7-CAV1-OE, using a lentivirus overexpression system compared to empty virus (EV) infected control cells; Huh-7-EV. Growth curve showing the effect of CAV1 overexpression on proliferation of Huh-7 cells (Huh-7-CAV1-OE) and their susceptibility to G sorafenib and H lenvatinib, assessed by IncuCyte Zoom (n = 3). I Validation of CAV1 knockdown in Huh-7/SR1 cells and its impact on RAC1 by Western blot (n = 3). siNC group served as control. J Immunofluorescence for CAV1 and F-actin in CAV1 knockdown Huh-7/SR1 cells (n = 3). K Effect of CAV1 knockdown on Huh-7/SR1 cell stiffness assessed by AFM (n = 3). Evaluation of functional effects of siCAV1 in Huh-7/SR1 cells using: L cell adhesion assay (n = 3) and M 3D-invasion assay in collagen I gel. F-actin staining was done to visualise sprouting in collagen I gel (n = 3). N Migration of CAV1 knockdown Huh-7/SR1 cells assessed by IncuCyte Zoom scratch assay (n = 3). O Western blot for RAC1 and vimentin in Huh-7/SR1 cells treated with siCAV1 alone or in combination with DMSO vehicle/sorafenib (n = 3). P Apoptosis analysis in CAV1 knockdown Huh-7/SR1 cells measured by Annexin V-FITC apoptosis assay (n = 3. Q Migration of CAV1 knockdown Huh-7/LR cells assessed by IncuCyte Zoom scratch assay (n = 3). R Western blot for RAC1 and vimentin in Huh-7/LR cells treated with siCAV1 alone or in combination with DMSO vehicle/lenvatinib (n = 3). S Apoptosis analysis in CAV1 knockdown Huh-7/LR cells using Annexin V-FITC apoptosis assay. β-actin and α-tubulin were used as loading controls (n = 3). Each experiment was performed on three independent days with at least three technical replicates. Error bars represent ± SD. All growth curves and time course studies were analysed by one-way repetitive measure ANOVA. All other data were analysed by unpaired two-tailed student’s t-test. Significance is denoted as follows: **p < 0.01, ***p < 0.001, ****p < 0.0001 SF = sorafenib, Lenva = lenvatinib.
Fig. 3
Fig. 3. Downregulation of CAV1 restores sensitivity of TKI-resistant HCC cells to sorafenib and lenvatinib.
A Experimental design schematic. B Dose-response curve of siCAV1 alone and in combination with sorafenib (SF) in Huh-7/SR1 cells (n = 3). siNC treatment group served as control. C Combination index (CI) and isobologram analysis for sorafenib and siCAV1, demonstrating synergy (Fa = 0.75, CI = 0.5216) (n = 3). D Dose-response curve of siCAV1 alone and in combination with lenvatinib (lenva) in LR cells (n = 3). siNC treatment group served as control. E Combination index (CI) and isobologram analysis for lenvatinib and siCAV1 in Huh-7/LR cells, demonstrating strong synergy (Fa = 0.743, CI = 0.18181) (n = 3). (F) Validation of synergy between siCAV1 #2 and sorafenib in Huh-7/SR1 cells by IncuCyte growth curve assays (n = 3). G Validation of synergy between siCAV1 #2 and lenvatinib in Huh-7/LR cells by IncuCyte growth curve assays (n = 3). H Annexin V-FITC apoptosis assay to measure the effect of combining siCAV1 #2 and sorafenib/lenvatinib on Huh-7/SR1 and Huh-7/LR cell death (n = 3). Growth curves illustrating the impact of shRNA-mediated CAV1 down-regulation in primary TKI-resistant HCC cell lines SNU449 and SNU475 on sensitivity to I sorafenib and J lenvatinib. For all drug treatment groups, DMSO vehicle served as control. Each experiment was performed on three independent days with at least three technical replicates. Error bars represent ± SD. All growth curves and time course studies were analysed by one-way repeated measures ANOVA. All other data were analysed by one-way ANOVA with multiple comparison. Significance is denoted as follows: ***p < 0.001, ****p < 0.0001. SF = sorafenib, Lenva = Lenvatinib.
Fig. 4
Fig. 4. CAV1 regulates distinct molecular pathways in primary and acquired TKI resistance.
A Western blot for key proteins (CAV1, EGFR, FGFR4, E-cadherin, p21 & p27) and pathways (AKT/ERK) in Huh-7 parental and Huh-7/LR cells under basal conditions and post-treatment (n = 3). B Pathway identification following CAV1 knockdown in Huh-7/SR1 cells using a proteome profiler array, quantified by band densitometry (n = 1). C Validation of P70S6K signalling in CAV1-depleted Huh-7/SR1 cells by Western blot (n = 3). D Western blot evaluation of pathways activated by CAV1 overexpression in TKI-naïve Huh-7 parental cells (Huh-7-CAV1-OE) and primary TKI-resistant PLC-PRF-5 cells (PLC-PRF-5-CAV1-OE) (n = 3). E RT-qPCR analysis of CAV1, p21(CDKN1A), CDH1 (E-cadherin) mRNA, with immunofluorescence detection of FGFR4 and E-cadherin in Huh-7, Huh-7/SR1 and Huh-7/LR cells (n = 3). F AXL profiling in Huh-7/SR cells by RT-qPCR and Western blot (n = 3). G Western blot validation of CAV1 dependence in CAV1-depleted Huh-7/SR1 cells treated with sorafenib or DMSO control, further confirmed by STAT3 and NFκB activity assays using luciferase reporters. H Western blot validation of CAV1 dependence in CAV1-depleted Huh-7/LR cells treated with lenvatinib or DMSO control. I Dose-response curve of AXL inhibitor; BGB324, in Huh-7/SR1 cells, assessed by cell viability assay, with synergy between sorafenib and BGB324 evaluated through combination index (CI) and isobologram analysis (Fa = 0.811, CI = 0.68723) and confirmed via IncuCyte growth curve assays (n = 3). J Dose-response curve of selective FGFR4 inhibitor; BLLU9931, in Huh-7/LR cells, with synergy between lenvatinib and BLU9931 assessed via CI and isobologram analysis (Fa = 0.97699, CI = 0.88594), and validated using IncuCyte growth curve assays (n = 3). K Western blot analysis for autophagy markers (P62, LC3A/B I (16 kDa), LC3A/B II (14 kDa), and LAMP1) in CAV1-depleted Huh-7/SR1 cells following sorafenib treatment. All experiments were performed on three independent days with at least three technical replicates. Error bars represent ± SD. Growth curves and time course studies were analysed by one-way repeated measure ANOVA, while all other data were evaluated by one-way ANOVA with multiple comparison ( > 2 groups) or an unpaired two-tailed student’s t test. Significance is denoted as follows: *p < 0.05, **p < 0.01, ***p < 0.001, ****p < 0.0001. CI = combination index, Fa = fractional inhibition, SF = sorafenib, Lenva = lenvatinib. β-actin and α-tubulin were used as loading controls.
Fig. 5
Fig. 5. miR-7 functions as an endogenous inhibitor of CAV1.
A Expression profile of CAV1 and miR-7 transcripts in the TCGA HCC cohort (tumour versus matched normal, n = 50). B RT-qPCR analysis of CAV1 and miR-7 levels in the HCC cell panel, normalised to a normal-like hepatocyte cell line, THLE2 (n = 3). C RT-qPCR measurement of miR-7 expression in acquired TKI-resistant Huh-7 cells (n = 3). D Schematic representation of predicted miR-7 seed-sequences in the 3’UTR of human CAV1 mRNA (TargetScan Human v7.1), with wild-type and mutant constructs used in dual-luciferase reporter assays in Huh-7 cells to assess the effect of miR-7 on CAV1 transcription. E Immunofluorescence detection of CAV1 protein in miR-7 transfected Huh-7/SR1 cells. F–N Assessment of miR-7’s anti-cancer effects on Huh-7/LR cells compared to miR-NC control: F Effect on growth using IncuCyte growth curve assay and 3D cultures (n = 3). G Effect on cell proliferation measured by immunofluorescence staining for ki67 (n = 3). H Effect on cell cycle (n = 3). Effect on senescence measured by I senescence associated β-galactosidase (SA-β-gal) activity (n = 3) and J immunofluorescence for p16 staining (n = 3). Effect on cell death measured by K Annexin V-FITC apoptosis assay (n = 3) and L immunofluorescence for c-CASP3 staining (n = 3). M Effect on Huh-7/LR cell invasion in Matrigel via IncuCyte Zoom scratch assay (n = 3). N Validation of the effect of miR-7 on CAV1 (red) and F-actin (green) expression using immunofluorescence staining (n = 3). All experiments were performed on three independent days with at least three technical replicates. Error bars represent ± SD. Growth curves and time course studies were analysed by one-way repetitive measure ANOVA., while all other data were evaluated by an unpaired two-tailed student’s t test. Significance is denoted as follows: *p < 0.05, **p < 0.01, ***p < 0.001, ****p < 0.0001.
Fig. 6
Fig. 6. miR-7 and lenvatinib synergistically suppress FGFR4/P70S6K/ERK and NFκB-mediated survival signalling downstream of CAV1 in Huh-7/LR cells.
A Dose-response effects of miR-7 alone and in combination with lenvatinib, with synergy assessed via CI and isobologram analysis, Fa = 0.73 and CI = 0.05324 (n = 3). B Validation of synergy using IncuCyte growth curve assays (n = 3). Effect of low dose miR-7 and lenvatinib on C growth and D invasion of 3D co-cultured tumour spheroids of Huh-7/LR, LX2 and Matrigel (n = 3). E Cell cycle analysis of Huh-7/LR cells under different treatment conditions by FACS (n = 3). F Annexin V-FITC assay to measure apoptosis in Huh-7/LR cells under different treatment conditions (n = 3). G RT-qPCR for CAV1, IL-8 and MMP-9 mRNA levels and gelatin zymography of conditioned media from 3D co-culture tumourspheres under different combination treatments (n = 3). H Western blot analysis for miR-7 targets and evaluation of downstream signalling pathways in Huh-7/LR cells treated with miR-7 and lenvatinib (n = 3). All experiments were performed on three independent days with at least three technical replicates. Error bars represent ± SD. Growth curves and time course studies were analysed by one-way repetitive measure ANOVA., while all other data were evaluated by one-way ANOVA with multiple comparisons ( > 2 groups). Significance is denoted as follows: *p < 0.05, **p < 0.01, ***p < 0.001, ****p < 0.0001. Fa= Fractional inhibition, Lenva = Lenvatinib.
Fig. 7
Fig. 7. Therapeutic targeting of the CAV1 pathway in HCC.
A Schematic of CAV1 validation in independent HCC cohorts. B Spatial distribution of hepatocyte clusters in HCC. C UMAP visualisation of hepatocytes, coloured by prognosis (recurrence and no recurrence). D CAV1 expression in recurrence-associated hepatocyte clusters. E Bulk RNA-seq analysis of CAV1 expression in HCC patients (n = 55). F Heatmap of CAV1 expression in HCC cell types, clustered by HBV status and recurrence. G CAV1 expression profile in HCC tissues with different etiologies from the TCGA HCC cohort (tumour versus matched normal, n = 50). H Representative histology sections showing CAV1 expression pre- and post-recurrence, with AE1/AE3 (green) as a pan-cytokeratin marker and CAV1 (red) by double-immunofluorescence immunocytochemistry. I RT-qPCR validation of CAV1 knockdown in HCC PDOs using siRNAs. J 3D cell viability assay showing the effect of CAV1 knockdown on HCC PDO growth, with siPLK1 to monitor transfection efficiency. K RT-qPCR of IL-8 and MMP-9 mRNA in CAV1 knockdown PDOs. L 3D cell viability assay assessing lenvatinib sensitivity after CAV1 knockdown in HCC PDOs. M Western blot of signalling pathways following CAV1 knockdown in HCC PDOs. N RT-qPCR of CAV1 mRNA in miR-7 transfected PDOs. O 3D cell viability assay evaluating the effect of miR-7 on HCC PDO growth. P Effect of lenvatinib and BLU9931 combination treatment on HCC PDO growth. Q Effect of sorafenib and BGB324 combination treatment on HCC PDO growth. For siRNA experiments, RNAiMax was used as a lipid control, and non-targeting siRNA served as the lead control. All experiments were performed on three independent days with at least three technical replicates. Error bars represent ± SD. Data were analysed by one-way ANOVA with multiple comparisons ( > 2 groups) or unpaired two-tailed student’s t-test. Significance is denoted as follows: *p < 0.05, **p < 0.01, ***p < 0.001, ****p < 0.0001. Lenva = Lenvatinib, SF = Sorafenib.
Fig. 8
Fig. 8. A proposed model for overcoming TKI resistance via targeting the CAV1 and AXL pathways.
HCC patients with elevated CAV1 and AXL expression exhibit poor responses to targeted therapies. Both CAV1 and AXL are essential for survival, invasion and chemotaxis of cancer cells. Mechanistically, CAV1 primarily acts via the STAT3/P70S6K/NFkB pathway, while AXL regulates STAT3/c-Jun axis in TKI-resistant cells. CAV1 via its interaction with E-cadherin can modulate FGFR4 expression and activity in lenvatinib-resistant cells, as well as AXL in sorafenib-resistant cells. In addition, CAV1 overexpression enhances RAC1 activity, leading to increased transcription of P21 and concurrent activation of the AMPKα pathway. This, in turn, induces a slower proliferative rate (dormancy), suppresses autophagy, and promotes evasion of apoptosis. AXL can also indirectly influence the AMPKα pathway. Targeting both CAV1 and AXL using selective siRNAs or miR-7 disrupts this protective autophagic brake, triggering excessive, uncontrolled autophagy, which ultimately drives rapid cancer cell death and overcomes resistance to sorafenib and lenvatinib.

Similar articles

References

    1. Cheng Z, Wei-Qi J, Jin D. New insights on sorafenib resistance in liver cancer with correlation of individualized therapy. Biochim Biophys Acta Rev Cancer. 2020;1874:188382. - PubMed
    1. Llovet JM, Kelley RK, Villanueva A, Singal AG, Pikarsky E, Roayaie S, et al. Hepatocellular carcinoma. Nat Rev Dis Prim. 2021;7:6. - PubMed
    1. Llovet JM, Kudo M, Merle P, Meyer T, Qin S, Ikeda M, et al. Lenvatinib plus pembrolizumab versus lenvatinib plus placebo for advanced hepatocellular carcinoma (LEAP-002): a randomised, double-blind, phase 3 trial. Lancet Oncol. 2023;24:1399–410. - PubMed
    1. Pfister D, Nunez NG, Pinyol R, Govaere O, Pinter M, Szydlowska M, et al. NASH limits anti-tumour surveillance in immunotherapy-treated HCC. Nature. 2021;592:450–6. - PMC - PubMed
    1. Finn RS, Qin S, Ikeda M, Galle PR, Ducreux M, Kim TY, et al. Atezolizumab plus Bevacizumab in Unresectable Hepatocellular Carcinoma. N Engl J Med. 2020;382:1894–905. - PubMed

MeSH terms