. 2025 Jul 25;16(1):6888.
doi: 10.1038/s41467-025-62090-5.

Biomarkers of pediatric Epstein-Barr virus-associated hemophagocytic lymphohistiocytosis through single-cell transcriptomics

Affiliations

Biomarkers of pediatric Epstein-Barr virus-associated hemophagocytic lymphohistiocytosis through single-cell transcriptomics

Jie Shen et al. Nat Commun. .

Abstract

Epstein-Barr virus-associated hemophagocytic lymphohistiocytosis (EBV-HLH) is a fatal hyperinflammatory disorder distinct from self-limiting EBV-induced infectious mononucleosis (IM). However, the immunological mechanisms underlying the divergence between benign EBV infection and fulminant HLH-particularly in the absence of inherited immunodeficiency-remains unclear, and systematic comparisons of immune landscapes across EBV-associated disease spectra are lacking. In this study, by enrolling children with IM and healthy volunteers as controls, we utilize single-cell RNA sequencing to identify unique immunological characteristics of EBV-HLH. Our analysis indicates that patients with EBV-HLH exhibite widespread activation of NF-κB signaling pathway. Furthermore, excessive cytokine secretion by T and NK cells is observed, along with a shift in monocyte differentiation towards an inflammatory phenotype, and the aggregation of IDO1+ monocytes. Metabolic pathway analysis reveals that L-kynurenine, a downstream metabolite of IDO1, is specifically elevated in EBV-HLH and mediates the production of multiple pro-inflammatory cytokines. Collectively, our study maps the immune landscape in pediatric EBV-HLH at single-cell resolution, uncovering potential role of IDO1+ monocytes and L-kynurenine as biomarkers.


Conflict of interest statement

Competing interests: The authors declare no competing interests.

Figures
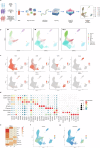
Fig. 1
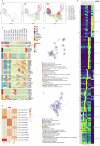
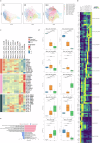
Fig. 1. Single-cell atlas of EBV-HLH patients, IM patients, and healthy volunteers.
a Flowchart describing the overall experimental design of this study. b UMAP was used for mapping 25,091 single cells from HV (n = 3), 56,752 single cells from IM (n = 9), and 134,973 single cells from HLH (n = 17). Based on the expression levels of marker genes, cells are categorized into ten distinct clusters and color-coded accordingly. c Expression distribution of canonical markers identifying individual cell clusters in the dot plot. The diameter of each dot reflected the proportion of subtype cells expressing a specific gene, while the color denotes the normalized mean expression. d The main cell lineages were labeled according to cell identity using canonical cell markers, as depicted in the UMAP plot. Color intensity ranging from gray to red indicates expression levels from low to high. e The enrichment of each cell subpopulation was quantified by calculating the ratio of observed to expected cell numbers (Ro/e). +++, Ro/e > 3; ++, 1.5 <Ro/e ≤ 3; +, 1 ≤ Ro/e ≤ 1.5; +/−, 0 <Ro/e < 1. f The scoring of cytokine sets for each cell in UMAP plot, with color intensity transitioning from blue to red to denote scores from low to high. g The scoring of inflammatory response sets for each cell in UMAP plot. The gradient from blue to red signifies expression levels increasing from low to high.
Fig. 2
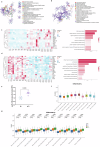
Fig. 2. Sub-clustering analysis on T cells.
a UMAP visualization of 13,163 single cells from HV (n = 3), 44,746 single cells from IM (n = 9), and 107,388 single cells from HLH (n = 17). Cells are color-coded and divided into 13 clusters. b Heatmap illustrating the average expression values of the top 10 highly expressed genes within each T cluster. c The average expression of selected markers of T cells in Heatmap. d Quantification of cell subpopulation enrichment based on Ro/e for cellular populations. e, f Enriched GO terms for upregulated genes in HLH patients compared to HV (e) and IM (f). A selection of indicative terms from the complete cluster has been transformed into a network configuration. Each term is depicted as a circular node, with the node’s size corresponding to the quantity of input genes associated with that term, and its color indicating its cluster membership (i.e., nodes sharing the same color are part of the same cluster). Terms that exhibit a similarity score greater than 0.3 are interconnected by an edge, where the edge’s thickness denotes the score of similarity.
Fig. 3
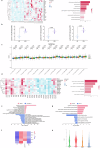
Fig. 3. Immunological characterization of T cell clusters.
a Based on the screened genes specifically upregulated in the HLH group compared to the HV and IM groups, the expression levels of related genes across all samples and their enrichment in the GO and KEGG pathways. The enrichment results were produced by Metascape and BH-corrected. b Quantification of phosphorylated p65 levels (normalized MFI values) in T lymphocytes from pediatric IM (n = 4) and HLH (n = 5) biologically independent samples. Two-sided Independent-samples t-test was applied. c Box plot showing the scoring of cytokine sets for each cell cluster among the three groups. Comparisons were made using the two-sided Wilcoxon test and P-values were adjusted using the BH correction. d Based on the screened genes specifically downregulated in the HLH group compared to the HV and IM groups, the expression levels of related genes across all samples and their enrichment in the GO and KEGG pathways. The enrichment results were produced by Metascape and BH-corrected. e Enriched GO terms of differentially expressed genes between EBV-T and non-EBV-T groups. The enrichment results were produced by clusterProfiler and BH-corrected. f The normalized expression levels of selected genes in T cells across HV, IM, non-EBV-T, and EBV-T groups. g Enriched GO terms of differentially expressed genes between HLH-D and HLH-L groups. The enrichment results were produced by clusterProfiler and BH-corrected. h Expression levels of ANXA1 in T cells across HV, IM, HLH-L, and HLH-D groups.
Fig. 4
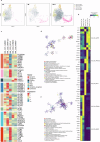
Fig. 4. Sub-clustering analysis on NK cells.
a Visualization through UMAP of 2868 single cells from HV (n = 3), 1732 single cells from IM (n = 9), and 8911 single cells from HLH (n = 17). Cells were sorted into 5 clusters, each marked with a unique color code. b, c Heatmap representing the average expression values of the highly expressed 10 genes (b) and functional genes (c) in each NK cluster. d, e Enriched GO terms for upregulated genes in HLH patients compared to HV (d) and IM (e).
Fig. 5
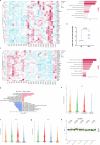
Fig. 5. Immunological characterization of NK cell clusters.
a Based on the screened genes specifically upregulated in the HLH group compared to the HV and IM groups, the expression levels of related genes across all samples and their enrichment in the GO and KEGG pathways. The enrichment results were produced by Metascape and BH-corrected. b Quantification of phosphorylated p65 levels (normalized MFI values) in NK cells from pediatric IM (n = 4) and HLH (n = 5) biologically independent samples. Two-sided Independent-samples t-est was applied. c Based on the screened genes specifically downregulated in the HLH group compared to the HV and IM groups, the expression levels of related genes across all samples and their enrichment in the GO and KEGG pathways. The enrichment results were produced by Metascape and BH-corrected. d Enriched GO terms of differentially expressed genes between EBV-NK and non-EBV-NK groups. The enrichment results were produced by clusterProfiler and BH-corrected. e, f Expression levels of LYST and DUSP1 in NK cells across HV, IM, non-EBV-NK, and EBV-NK groups. g Expression levels of DUSP1 in NK cells across HV, IM, HLH-L, and HLH-D groups. h Box plot showing the scoring of cytokine sets for each cell cluster among the three groups. Comparisons were made using the two-sided Wilcoxon tests and P-values were adjusted using the BH correction.
Fig. 6
Fig. 6. Sub-clustering analysis on Monocytes.
a UMAP visualization of 5228 single cells from HV (n = 3), 7298 single cells from IM (n = 9), and 12,387 single cells from HLH (n = 17). The cells were divided into 10 clusters and color-coded accordingly. b, c Heatmap representing the average expression values of the highly expressed 10 genes (b) and functional genes (c) in each monocytes cluster. d Box plot depicting the percentage of each cell cluster in HV (n = 3), IM (n = 9), and HLH (n = 17) group, with the median indicated by a horizontal line. Two-sided Wilcoxon tests were performed between groups and P-values were adjusted using the BH correction. e Enriched GO terms of differentially expressed genes between Mono_C06_HLA-DQA1 cluster and the rest monocytes. The enrichment results were produced by clusterProfiler and BH-corrected.
Fig. 7
Fig. 7. Immunological characterization of Monocytes clusters.
Enriched GO terms for upregulated genes in HLH patients compared to HV (a) and IM (b). c, d The expression levels of specific genes in all samples and their enrichment in the GO and KEGG pathways. The enrichment results were produced by Metascape and BH-corrected. Compared to the HV group and IM group, these genes were upregulated (c) or downregulated (d) in the HLH group. In contrast, expression levels between the HV and IM groups either showed no significant differences or exhibited a reverse trend. e Quantification of phosphorylated p65 levels (normalized MFI values) in monocytes from pediatric IM (n = 4) and HLH (n = 5) biologically independent samples. Two-sided Independent-samples t-test was applied. f, g The box plot shows the scoring of the inflammatory response set for each cell cluster among the three groups (HLH, HV, and IM). Comparisons were made using the two-sided Wilcoxon tests and P-values were adjusted using the BH correction.
Fig. 8
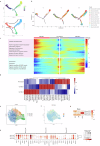
Fig. 8. Trajectory inference of monocytes differentiation.
a The trajectories of monocytes were visualized and colored according to pseudotime (left) and cell state (right). b Pseudotime trajectory analysis of monocytes among each group, where each dot signified an individual cell and was colored according to its cluster label. c Heatmap representation of GO analysis findings for signaling pathways unique to fate 1, plotted along pseudotime. d Heatmap displaying the top 10 regulons in each cell type, with the average AUC (Area Under the Curve) matrix clustered. Numbers in parentheses indicate the number of target genes for each transcription factor. This visualization reveals the transcriptional regulators most strongly associated with each cell type, offering clues to the transcriptional control mechanisms at play during monocyte differentiation. e UMAP visualization showing monocyte subpopulations clustered by fate. Mono_S01 represented cells on the pre-branch, indicating an undifferentiated or initial state. Mono_S02 represents cells on the fate 2 branch, and Mono_S03 represents cells on the fate 1 branch, indicating differentiated states along two distinct developmental paths. The presence of cells on the fate 1 and fate 2 branches were denoted by Mono_S03 and Mono_S02, respectively, demonstrating different stages of differentiation across two unique developmental trajectories. f UMAP visualization displaying the scoring of the inflammatory response set for each monocyte. g Quantification of cell subpopulation enrichment based on the Ro/e value for each cell population. h Dot plot showing the highly variable genes for three cell classifications. The diameter of each circle reflected the percentage of cells expressing the gene in the subtype, and the color denotes the mean expression.
Fig. 9
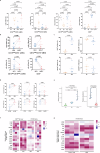
Fig. 9. Validation analysis of IDO1+ monocytes as new biomarkers for HLH.
a, b The proportions of IDO1+ monocytes in the validation biologically independent samples (n = 6 in HV, n = 4 in IM, n = 7 in HLH, n = 3 in HLH-T) by flow cytometry. The discrepancies between multiple groups were assessed using one-way ANOVA along with two-sided Tukey–Kramer post hoc testing (a). Two-sided Paired t-test was used for the three paired samples of HLH and HLH-T (b). c The proportions of IDO1+, HLA-DR+, CD163+, and CX3CR1+ monocytes in the IM (n = 4) and HLH (n = 5) biologically independent samples by flow cytometry. Two-sided Independent-samples t-test was applied. d In monocyte subsets of HLH patients (n = 5), comparative analysis of HLA-DR+/CD163+/CX3CR1+ proportions between IDO1+ and IDO1 subpopulations (upper panel) and evaluation of IDO1+ proportions across positive/negative of HLA-DR, CD163, and CX3CR1 subgroups (lower panel). Two-sided Paired t-test was applied. e Box plot depicting the relative expression levels of L-Kynurenine across biologically independent sample groups (n = 6 in HV, n = 4 in IM, n = 5 in HLH). One-way ANOVA along with two-sided Tukey–Kramer post hoc testing was employed to assess the significance between multiple groups. f In THP1 and U937 cell lines, mRNA levels of inflammation-related cytokines were quantified via qRT-PCR following either IDO1 overexpression or exogenous KYN treatment for 48 h. g In primary CD3⁺ T cells and NK92 cell line, mRNA levels of inflammation-associated cytokines were quantified by qRT-PCR following exogenous KYN treatment for 48 h. The data were presented as means ± SEM (error bar) in (ad).
Fig. 10
Fig. 10. Intercellular interaction alterations among cell types between HV and HLH sample groups.
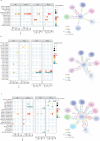
Predicted cellular interactions between monocytes and other cell types, represented by bubble charts (left) and corresponding schematic diagrams (right), including immune checkpoint interaction pairs (a), chemokine interaction pairs (b), and cytokine interaction pairs (c). The circle size in this illustration reflected the significance P-value of the ligand-receptor axis, and the color indicated the specificity of the interactions. The interaction results were produced by CellPhoneDB.

References

    1. Epstein, M. A., Achong, B. G. & Barr, Y. M. Virus particles in cultured lymphoblasts from Burkitt’s lymphoma. Lancet1, 702–703 (1964). - PubMed
    1. Taylor, G. S., Long, H. M., Brooks, J. M., Rickinson, A. B. & Hislop, A. D. The immunology of Epstein-Barr virus-induced disease. Annu. Rev. Immunol.33, 787–821 (2015). - PubMed
    1. Damania, B., Kenney, S. C. & Raab-Traub, N. Epstein-Barr virus: biology and clinical disease. Cell185, 3652–3670 (2022). - PMC - PubMed
    1. El-Mallawany, N. K., Curry, C. V. & Allen, C. E. Haemophagocytic lymphohistiocytosis and Epstein-Barr virus: a complex relationship with diverse origins, expression and outcomes. Br. J. Haematol.196, 31–44 (2022). - PubMed
    1. Canna, S. W. & Marsh, R. A. Pediatric hemophagocytic lymphohistiocytosis. Blood135, 1332–1343 (2020). - PMC - PubMed

MeSH terms

LinkOut - more resources