. 2025 Jul 26;16(1):6896.
doi: 10.1038/s41467-025-62230-x.

Programming of refractive functions

Affiliations

Programming of refractive functions

Md Sadman Sakib Rahman et al. Nat Commun. .

Abstract

Snell's law dictates the phenomenon of light refraction at the interface between two media. Here, we demonstrate arbitrary programming of light refraction through an engineered material where the direction of the output wave can be set independently for different directions of the input wave, covering arbitrarily selected permutations of light refraction between the input and output apertures. Formed by a set of cascaded transmissive layers with optimized phase profiles, this refractive function generator (RFG) spans only a few tens of wavelengths in the axial direction. In addition to monochrome RFG designs, we also report wavelength-multiplexed refractive functions, where a distinct refractive function is implemented at each wavelength through the same engineered material volume, i.e., the permutation of light refraction is switched from one desired function to another function by changing the illumination wavelength. As experimental proofs of concept, we demonstrate permutation and negative refractive functions at the terahertz part of the spectrum using 3D-printed materials. Arbitrary programming of refractive functions enables new design capabilities for optical materials, devices and systems.


Conflict of interest statement

Competing interests: The authors declare no competing interests.

Figures
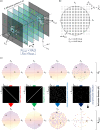
Fig. 1
Fig. 1. Programming refractive functions.
a An RFG comprising K transmissive surfaces in air with an axial separation of zll between the successive surfaces (e.g., zll ~ 6λ). The RFG refracts an input wave along the direction k^in into the direction k^out, where k^outk^target=f(k^in) and f is the target refractive function of interest. b The set of all k^ vectors of interest for a given maximum angle θmax and a finite aperture width of Da, represented by the dots. c The mapping of the k^ vectors under different refractive functions f represented by the binary matrices R. The mapping is encoded in the color of the dots. For visual aid, the mappings of three k^ vectors are also highlighted with a triangle, a circle, and a square to guide the eye.
Fig. 2
Fig. 2. Arbitrarily permuted refractive function implementation with a K = 8 RFG design.
a The matrix R representing the arbitrarily permuted refractive function, the same as the one depicted in Fig. 1c, 3rd column. b The error in output angles for all the input directions. c The optimized phase profiles of the RFG surfaces. Here zll6λ, giving a total axial thickness of z1K50λ between the first and the last surfaces.
Fig. 3
Fig. 3. Wavelength sensitivity and compactness of RFGs.
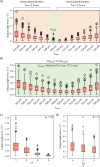
a Distribution of the output angle error as a function of the test wavelength λtest, for the same RFG of Fig. 2, which was trained for an illumination wavelength of 750μm, i.e., λtrain=750μm. The distributions arise from the values corresponding to all the input directions. b Distribution of the output angle error as a function of the test wavelength λtest, for an RFG design “vaccinated” against changes in wavelength. c Distribution of the output angle errors as a function of K, while zll is kept constant at ~6λ. d Distribution of the output angle errors as a function of zll, while K is kept constant at 4.
Fig. 4
Fig. 4. Enhancement of the output diffraction efficiency of an RFG designed for an arbitrarily permuted refractive function.
a Output angle errors and diffraction efficiencies of three different RFG designs trained with different values of the hyperparameter η (see Eq. (12)). Here, the target refractive function is the one shown in Fig. 2a. b Distribution of output angle errors and diffraction efficiencies as a function of η. Each value of the training hyperparameter η corresponds to a separately optimized RFG design. For all the designs, K=8 and zll6λ.
Fig. 5
Fig. 5. Arbitrarily filtered and permuted refractive function implementation with a K = 8 RFG design.
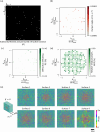
a The matrix R representing an arbitrarily filtered and permuted refractive function. The ratio of the filtered directions is ~90%. b Output angle error ε for all the unfiltered input directions. c Output diffraction efficiency DE for all the unfiltered input directions. d Relative residual power RRP for the filtered input directions. e The optimized phase profiles of the RFG surfaces.
Fig. 6
Fig. 6. Negative refractive function (θtarget = θin, φtarget = φin + 180° for all θin < θmax = 60°) using a K = 5 RFG design.
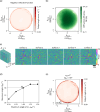
a Output angle error for all the input directions, sampled densely. b Diffraction efficiency for all the input directions. c The optimized phase profiles of the RFG surfaces. The distance zll between consecutive surfaces is ~6λ, giving an axial distance of z1K30λ between the first and the last transmissive surfaces. d The operating curve of the RFG design, showing θM (the maximum acceptable θin) as a function of the maximum acceptable angle error, εM. e When εM=1, θM=58, i.e., for all the input directions with θin<58, the output angle error is less than 1.
Fig. 7
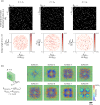
Fig. 7. Wavelength multiplexing of arbitrarily permuted refractive functions with an RFG.
a The matrices representing the targeted arbitrarily permuted refractive functions at three distinct wavelengths (top row). The bottom row shows, for a K=8 RFG design, the error in the output angle as a function of the input direction at these three wavelengths. b The optimized thickness profiles of the RFG surfaces. The distance zll between consecutive surfaces is ~6λ2, giving an axial distance of z1K50λ2 between the first and the last transmissive surfaces.
Fig. 8
Fig. 8. Experimental demonstration of the negative refractive function at λ = 0.75 mm.
a The optimized phase profiles of a K=3 RFG for implementing negative refractive function with θmax=30. Also shown are the output angle errors and the diffraction efficiencies obtained in simulation. b The RFG hardware, assembled from the structured surfaces and input/output apertures, fabricated using 3D-printing. c The THz setup comprising the source and the detector, together with the 3D-printed RFG.
Fig. 9
Fig. 9. Visualization and quantitative analysis of the experimental RFG results.
Each panel corresponds to the input direction defined by θin,φin and compares the simulated and experimental diffraction patterns measured at a distance of z=80mm from the output aperture of the RFG (see Fig. 9c). The green dot marks the center 0, 0 of the FOV and the red dot marks the first moment of the diffracted intensity pattern; also see Supplementary Fig. S1b. In each panel, the mismatch between the numerical simulation and the experimental result, defined as the angle εsimexp between the simulated output wave and the experimentally measured output wave, is also reported.
Fig. 10
Fig. 10. Design, fabrication, and experimental validation of an RFG implementing a permutation refractive function.
a Top: a permutation refractive function (left) and the learned phase profiles of the three diffractive surfaces used to implement this permutation refractive function (right). Bottom: numerically evaluated output angle error and diffraction efficiency for each input direction. b Fabricated diffractive surfaces (top) and the 3D-printed assembly used for experimental testing (bottom). The assembly comprises the fabricated surfaces aligned between the input and output apertures. c Comparison between simulated and experimentally measured output intensity patterns 160 mm away from the output aperture for the five different input directions. The green dot marks the center 0, 0 of the FOV, and the red dot marks the first moment of the diffracted intensity pattern. The measured angular deviation εsimexp remains below 1.4° in all cases, demonstrating close agreement between the simulations and experimental results.

References

    1. Born, M. & Wolf, E. Principles of Optics: Electromagnetic Theory of Propagation, Interference and Diffraction of Light (Elsevier, 2013).
    1. Hecht, E. Optics (Pearson Education, Incorporated, 2017).
    1. Engheta, N. & Ziolkowski, R. W. Metamaterials: Physics and Engineering Explorations (John Wiley & Sons, 2006).
    1. Wegener, M. & Linden, S. Shaping optical space with metamaterials. Phys. Today63, 32–36 (2010).
    1. Poddubny, A., Iorsh, I., Belov, P. & Kivshar, Y. Hyperbolic metamaterials. Nat. Photonics7, 948–957 (2013).

LinkOut - more resources