. 2025 Jul 25;16(1):6876.
doi: 10.1038/s41467-025-62270-3.

The mechanotransducer Piezo1 coordinates metabolism and inflammation to promote skin growth

Affiliations

The mechanotransducer Piezo1 coordinates metabolism and inflammation to promote skin growth

Yingchao Xue et al. Nat Commun. .

Abstract

The skin has a remarkable ability to grow under constant stretch. Using a controlled tissue expansion system in mice, we identified an enhanced inflammatory-metabolic network in stretched skin via single-cell RNA sequencing, flow cytometry and spatial transcriptomics. Stretched epidermal cells exhibit heightened cellular crosstalk of CXCL, CCL, TNF, and TGF-β signaling. Additionally, skin expansion increases macrophage and monocyte infiltration in the skin while altering systemic immune cell profiles. Glycolysis-related genes, including Glut1 and Aldoa were significantly elevated. We hypothesize that Piezo1, a non-selective calcium-permeable cation channel, senses tension in stretched skin, driving these responses. The epidermal-Piezo1 loss-of-function animals show reduced skin growth, tissue weight, tissue thickness, macrophage infiltration, and glycolysis activity. Conversely, animals with a pharmacological Piezo1 gain of function exhibit an increase in these factors. Our findings highlight the coordinating role of Piezo1 for metabolic changes and immune cell infiltration in tension-induced skin growth.


Conflict of interest statement

Competing interests: L.A.G. has received grant support paid to his institution, Johns Hopkins University from Sun Pharma Advanced Research Company (SPARC). This grant is to investigate intellectual property where Johns Hopkins University is the owner, L.A.G. is one of several inventors, is under a licensing agreement with SPARC, and has resulted in royalty payments to inventors. This grant and royalty payments are not related to the research presented in this manuscript. The remaining authors declare no competing interests.

Figures
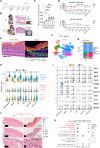
Fig. 1
Fig. 1. Tension activates an inflammatory-metabolic molecular network in the skin.
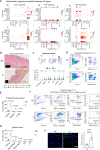
A tissue expansion (TE) protocol. I-#, injection day #; PI-#, post-last injection day #. B Representative images of pre- and post-TE, along with skin histology. C Skin weight changes post-expansion. (n = 3–7). D Quantification of skin layer thickness. (n = 3–8). E Spatial clustering of expanded skin with post-xenium HE. NE has one piece of tissue; E has 2 pieces of tissue. F Integrated UMAP of cell clusters from Xenium assay. Cells include both NE and E samples. G Identified cell type fractions from Xenium assay. H Pathway scores from Xenium assay. I Representative Genes’ expression of different pathways among different cellular populations. J Upper: spatial heatmap of angiogenesis pathway; middle: spatial plot of angiogenesis genes in skin; lower: high-resolution spatial map of angiogenesis genes in NE and E skin. K Gene Set Enrichment Analysis (GSEA) of scRNA-seq, grouped by cell type. To perform univariate statistical analysis, the two-sided Student’s t-test was used. For multivariate analyses, the one-way ANOVA test was used. The Wilcoxon rank-sum test was used for all violin plots in this manuscript. Abbreviations: E the skin overlying the inflated expander, NE the skin overlying the expander in mice where the expander was not inflated. NES normalized enrichment score, HF hair follicle, SG sebaceous gland.
Fig. 2
Fig. 2. Mechanical tension induces immune cell infiltration in the skin.
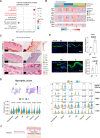
A The heatmap quantification of signaling communication probability across distinct cell types. Boxes mark the differential crosstalk between cells. Arrows on the left panel show basal-immune interactions. B Spatial plot of selected cytokines from xenium assay. C The upper UMAP shows immune_score based on the expression of the cytokine panel list in (B). The below violin plot showed immune_scores across various cell types between E and NE. D, E Flow cytometry for T-Myeloid sorting among isolated single cells from skin samples of PI-14. Cells in the left square are selected as single live cells. Immune cells are gated as CD45+. The FITC lineage antibody is a cocktail of FITC anti-mCD3ε/FITC anti-mGr-1/FITC anti-mCD11b/FITC anti-mCD45R(B220)/FITC anti-mTer-119. The lineage antibody mix reacts with major hematopoietic cell lineages, such as T lymphocytes, B lymphocytes, monocytes/macrophages, granulocytes, NK cells, and erythrocytes. The Lin+ Thy1 cells are myeloid cells. The majority of Lin+ Thy1+ cells are T cells. NE, n = 5, E, n = 3. F, G Flow cytometry analysis of Myeloid cells. Gate for CD45+ lineage (Siglec-F, CD3e, CD19, and NK1.1) to exclude eosinophils, T cells, B cells, and NK cells. Lineage CD11b+ Ly6G/6 C+ cells are identified as monocytes/neutrophils (Ly6G/6C+) and macrophages (CD64+). From the CD11b+ Ly6cgate, macrophages (EpCAMCD64+), Langerhans cells (LC, CD64EpCAM+ MHC II+), and dermal dendritic cells (DC, CD64EpCAMMHC II+CD11c+) are identified. (n = 3). H CD68+ macrophages accumulate in expanded skin samples as measured by immunofluorescence. Dashed lines were used to separate the epidermis and dermis. (n = 3). To perform univariate statistical analysis, the two-sided Student’s t-test was used. For multivariate analyses, the one-way ANOVA test was used. Wilcoxon rank-sum test was used for all violin plot in this manuscript.
Fig. 3
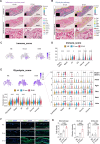
Fig. 3. Tension enhances the glycolysis pathway in the skin.
A Glucose metabolic-related pathway enrichment analyses of stretched keratinocytes versus controls. Pathways with a positive score are increased after stretch. B Heatmap of glycolysis pathway-related gene expression levels. C upper: spatial heatmap of glycolysis pathway; middle: spatial plot of glycolysis-related genes; lower: high-resolution spatial map of glycolysis genes in NE and E skin. D The upper UMAP shows Glycolysis_score based on the expression of the gene panel list in (C). The left below violin plot shows Glycolysis_scores across various cell types between E and NE. The right violin plot shows the expression of the representative glycolysis genes in xenium clusters. E Immunofluorescence of glycolysis-related genes Glut1/Slc2a1 and Aldoa in the E and NE samples of the epidermis. Followed by expression level quantification. (n = 3). F Running summary. To perform univariate statistical analysis, the two-sided Student’s t-test was used. For multivariate analyses, the one-way ANOVA test was used. The Wilcoxon rank-sum test was used for all violin plots in this manuscript.
Fig. 4
Fig. 4. Loss of Epidermal-Piezo1 inhibits tissue expansion in vivo.
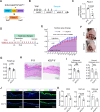
A Breeding strategy to delete Piezo1 in Krt5+ skin stem cells using Cre-Loxp recombination. B workflow of tamoxifen injections for K5-cre;Piezo1-flox (K5;P1f) mice to induce gene knockout. C RT-PCR reveals Piezo1 knockout efficiency in K5;P1f strain compared to P1f control strain. (n = 3). D Tissue expansion workflow in K5;P1f strain and control strain. E Surface area quantification shows that Piezo1 knockout in the epidermis significantly decreases stretch-induced skin growth. The area under curve comparison was used. F Representative image of expanded P1f and K5;P1f mice at PI-14. G Skin weight changes. (n = 6). H, I Epidermal-Piezo1 knockout decreases stretch-induced skin weight and epidermal thickness after skin stretch. (n = 6). J, K Immunofluorescence staining of macrophage marker CD68, and glycolysis markers Glut1 and Aldoa, followed by quantification. CD68 is quantified in the dermis, and Glut1 and Aldoa are quantified in the epidermis. (n = 3). To perform univariate statistical analysis, the two-sided Student’s t-test was used. For multivariate analyses, the one-way ANOVA test was used.
Fig. 5
Fig. 5. Piezo1 activation promotes tissue expansion in vivo.
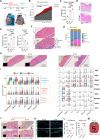
A Timeline of Piezo1 activator Yoda1 topical application during tissue expansion in mice, with representative images of expanded skin on PI-7. BE Increase in skin surface area, weight, and epidermal thickness, and decreased dermal thickness in Yoda1-treated mice during tissue expansion. (n = 3). F Spatial clustering of expanded skin with post-xenium HE. NE has one piece of tissue, E-con has two pieces of tissue, and E-Yd1 has two pieces of tissue. G Identified cell type fractions from Xenium assay. H Mapping Xenium cell cluster location with HE staining. I Left: Pathway scores from Xenium assay. Right: Representative Genes’ expression of different pathways among different cellular populations. Significant test results between E-con and E-Yd1 samples were labeled on the violin plot. Detailed comparison results can be found in supplementary datasets. J upper: spatial heatmap of angiogenesis pathway; lower: spatial plot of angiogenesis-related genes. K, L Immunofluorescence staining of proliferation marker Ki67 and Hippo pathway effector YAP protein, followed by quantification. Ki67 and YAP are quantified in the epidermis. (n = 3). M Running summary. Abbreviations—E-con: expanded mice, serve as a control for Yoda1-treated mice. E-Yd1: expanded mice with Yoda1 treatment. For multivariate analyses, the one-way ANOVA test was used. For two-group comparisons, the two-sided Student’s t-test was used. Wilcoxon rank-sum test was used for all violin plots in this manuscript.
Fig. 6
Fig. 6. Piezo1 activation increases the inflammation and glycolysis pathways.
A upper: spatial heatmap of cytokine panel genes in E-con and E-Yd1 skin; middle: spatial plot of cytokines; lower: high-resolution spatial map of cytokines. B upper: spatial heatmap of glycolysis pathway in E-con and E-Yd1 skin; middle: spatial plot of glycolysis-related genes; lower: high-resolution spatial map of glycolysis genes. C The UMAP shows immune_score based on the expression of the cytokine panel list in (A). D The violin plot showed immune_scores across various cell types. E The upper left UMAP shows Glycolysis_score based on the expression of the gene panel list in Fig. 3C. The lower left violin plot showed Glycolysis_scores across various cell types among samples. The right violin plot shows the expression of the representative glycolysis genes in xenium clusters. Significant test results between E-con and E-Yd1 samples were labeled on the violin plot. Detailed comparison results can be found in supplementary datasets. F, G Immunofluorescence staining of macrophage marker CD68, and glycolysis markers Glut1 and Aldoa, followed by quantification. CD68 is quantified in the dermis, and Glut1 and Aldoa are quantified in the epidermis. (n = 3). In multivariate analyses, the one-way ANOVA test was used. Wilcoxon rank-sum test was used for all violin plots in this manuscript.
Fig. 7
Fig. 7. Graphical summary.
Tension activates an inflammatory-metabolic molecular network in the skin, including inflammatory signal activation, immune cell infiltration, circulating myeloid cell mobilization, and metabolic changes. Piezo1 orchestrates stretch-induced skin growth, inflammation, and metabolic changes.

References

    1. Sachs, D. et al. Sustained physiological stretch induces abdominal skin growth in pregnancy. Ann. Biomed. Eng.52, 1576–1590 (2024). - PMC - PubMed
    1. Wagh, M. S. & Dixit, V. Tissue expansion: concepts, techniques and unfavourable results. Indian J. Plast. Surg.46, 333–348 (2013). - PMC - PubMed
    1. Radovan, C. Tissue expansion in soft-tissue reconstruction. Plast. Reconstr. Surg.74, 482–492 (1984). - PubMed
    1. De Filippo, R. E. & Atala, A. Stretch and growth: the molecular and physiologic influences of tissue expansion. Plast. Reconstr. Surg.109, 2450–2462 (2002). - PubMed
    1. Takei, T., Mills, I., Arai, K. & Sumpio, B. E. Molecular basis for tissue expansion: clinical implications for the surgeon. Plast. Reconstr. Surg.102, 247–258 (1998). - PubMed

LinkOut - more resources