. 2025 Jul 26;16(1):6895.
doi: 10.1038/s41467-025-62254-3.

PIEZO1 drives trophoblast fusion and placental development

Affiliations

PIEZO1 drives trophoblast fusion and placental development

Yang Zhang et al. Nat Commun. .

Abstract

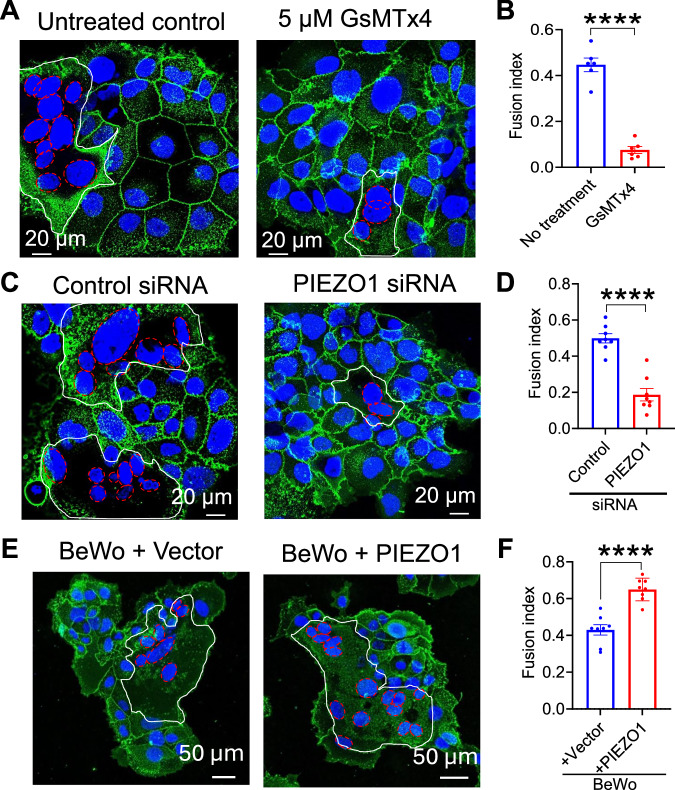
PIEZO1, a mechanosensor in endothelial cells, plays a critical role in fetal vascular development during embryogenesis. However, its expression and function in placental trophoblasts remain unexplored. Here, we demonstrate that PIEZO1 is expressed in placental villus trophoblasts, where it is essential for trophoblast fusion and placental development. Mice with trophoblast-specific PIEZO1 knockout exhibit embryonic lethality without obvious vascular defects. Instead, PIEZO1 deficiency disrupts the formation of the syncytiotrophoblast layer in the placenta. Mechanistically, PIEZO1-mediated calcium influx activates TMEM16F lipid scramblase, facilitating the externalization of phosphatidylserine, a key "fuse-me" signal for trophoblast fusion. These findings reveal PIEZO1 as a crucial mechanosensor in trophoblasts and highlight its essential role in regulating trophoblast fusion and placental development, expanding our understanding of PIEZO1's functions beyond endothelial cells during pregnancy.


Conflict of interest statement

Competing interests: The authors declare no competing interests.

Figures

Fig. 1
Fig. 1. PIEZO1 is expressed in placental trophoblasts.
A Immunofluorescence staining of PIEZO1 (green) and nuclei (Hoechst, blue) in human first-trimester placenta villi with higher magnification shown on the right. B Immunofluorescence staining of PIEZO1 (green) in BeWo cells. C Representative single channel mechanosensitive currents from BeWo cells. Currents were elicited by −60 mmHg pressure and recorded at voltage steps from −100 mV to −40 mV in 20 mV increments with holding potential at 0 mV. D The current-voltage (I-V) relationship for the currents in (C). The data were fitted with linear regression, obtaining a single-channel conductance of 29.3 ± 1.8 pS (n = 5 individual cells). E Representative cell-attached pressure-clamp recording of control-siRNA and PIEZO1-siRNA treated BeWo cells (left). The macroscopic current was elicited by pressure steps ranging from 0 to −60 mmHg with a holding potential at −80 mV. F The current-pressure relationship for the mechanosensitive current recorded from BeWo cells treated with control-siRNA and PIEZO1-siRNA. G PIEZO1 current amplitudes at –60 mmHg in (F). Unpaired 2-sided Student t-test. ∗∗∗∗: p = 0.0000044338. In F and G, n = 10 and 11 for control siRNA and PIEZO1 siRNA treated cells, respectively. H Representative Ca2+ (red) imaging of control and PIEZO1 siRNA knockdown BeWo cells stimulated with 10 µM Yoda1. I Time course quantification of Ca2+ levels in control (n = 21) and PIEZO1 siRNA (n = 25) knockdown BeWo cells following 10 µM Yoda1 stimulation (indicated by the arrow). Data are presented as mean ± s.e.m from 7 biological replicates. J Immunofluorescence of tdTomato (magenta), MCT1 (a marker for SynT-1 layer, green), MCT4 (a marker for SynT-2 layer, red), and DAPI (blue) for the placenta from Piezo1-td-Tomato transgenic mouse at E13.0. Left: schematic of mouse placental labyrinth showing the maternal-fetal interface. Circular tdTomato+ and MCT1+ signals are red blood cells. n = 4 biological replicates. Source data are provided as a Source Data file.
Fig. 2
Fig. 2. Trophoblast-specific knockout of Piezo1 causes embryonic lethality in mice.
A Breeding scheme for the generation of Piezo1 conditional knockout (cKO) mice. B Genotype distribution of wild-type (WT), heterozygous (HET), and cKO pups compared to the expected Mendelian inheritance ratio. The numbers of animals with specific genotypes over 105 pups were shown in the parentheses. C Representative embryos and placentas from Piezo1 WT, HET, and cKO mice at embryonic day 13.0 (E13.0). Images of the complete litter can be found in Fig. S5B.
Fig. 3
Fig. 3. Piezo1 deficiency in trophoblast impairs fusion without affecting angiogenesis.
CD31 immunohistochemical staining of PIEZO1 WT (A) and cKO (B) placentas at E13.0 with enlarged areas shown on the right. n = 3 biological replicates for WT and 3 biological replicates for cKO. MCT1 and MCT4 immunofluorescence staining of the PIEZO1 WT (C) and cKO (D) placentas (upper panels) with enlargement (lower panels) at E12.5. n = 5 biological replicates for WT and 6 biological replicates for cKO.
Fig. 4
Fig. 4. PIEZO1 is required for trophoblast fusion in vitro.
Representative images (A) and fusion index quantification (B) of untreated control (n = 6) and 5 μM GsMTx4 treated (n = 6) BeWo cells after 48-h forskolin treatment. Unpaired 2-sided Student t-test. ****: p = 0.000000576. Representative images (C) and fusion index quantification (D) of control (n = 8) and PIEZO1 siRNA knockdown (n = 8) BeWo cells after forskolin treatment for 48-h to induce fusion. Unpaired 2-sided Student t-test. ****: p = 0.00000384529. Representative images (E) and fusion index quantification (F) of BeWo cells that were overexpressed with empty vector (n = 8) and PIEZO1 (n = 8) after 48-h forskolin treatment. Unpaired 2-sided Student t-test. ****: p = 0.00002456791. Each dot represents fusion indexes averaged from six random fields of one coverslip. Data are presented as mean ± s.e.m. Source data are provided as a Source Data file.
Fig. 5
Fig. 5. PIEZO1-TMEM16F coupling regulates trophoblast fusion.
A Representative images of Ca2+ and PS exposure in WT (left) and TMEM16F KO (right) BeWo cells stimulated with 10 μM Yoda1. B Time course quantifications of Yoda1-induced PS exposure in WT (n = 25) and TMEM16F KO (n = 18) BeWo cells. C Representative images of Ca2+ and PS exposure in control (left) and PIEZO1 siRNA knockdown (right) BeWo cells stimulated with 10 μM Yoda1. D Time course quantifications of Yoda1-induced PS exposure control (n = 21) and PIEZO1 siRNA (n = 25) knockdown BeWo cells. E Representative images of TMEM16F KO BeWo overexpressed with empty vector and PIEZO1 after forskolin treatment for 48 h. F Fusion index quantification in WT (the same data in Fig. 4F) and TMEM16F KO BeWo cells, which were overexpressed with an empty vector or PIEZO1 (n = 8 each) after forskolin treatment for 48 hrs. Data are presented as mean ± s.e.m. n.s. non-significant; ****P < 0.0001 (BeWo WT+ empty vs. BeWo WT+ Piezo1 WT: P = 0.000000028606201; BeWo WT+ empty vs. BeWo 16FKO+ empty, P = 0.000000000000011; BeWo WT+ empty vs. BeWo 16FKO+ Piezo1 WT: P = 0.000000000000011), one-way ANOVA with Tukey’s multiple comparisons test). G Cartoon illustration (Created in BioRender. Shan, Z. (2025) https://BioRender.com/jkftvy7) of PIEZO1-TMEM16F coupling in regulating trophoblast fusion. Source data are provided as a Source Data file.

Update of

References

    1. Huang, H., Gao, S. & Bao, M. Exploring mechanical forces shaping self-organization and morphogenesis during early embryo development. Annu. Rev. Cell Dev. Biol.40, 75–96 (2024). - PubMed
    1. Gomez-Galvez, P., Anbari, S., Escudero, L. M. & Buceta, J. Mechanics and self-organization in tissue development. Semin. Cell Dev. Biol.120, 147–159 (2021). - PubMed
    1. Goodwin, K. & Nelson, C. M. Mechanics of development. Dev. Cell56, 240–250 (2021). - PMC - PubMed
    1. Burton, G. J., Charnock-Jones, D. S. & Jauniaux, E. Regulation of vascular growth and function in the human placenta. Reproduction138, 895–902 (2009). - PubMed
    1. Khorami-Sarvestani, S. et al. Placenta: an old organ with new functions. Front. Immunol.15, 1385762 (2024). - PMC - PubMed