. 2025 Jul 25;16(1):6861.
doi: 10.1038/s41467-025-62172-4.

Tumour initiated purinergic signalling promotes cardiomyocyte RBFOX1 degradation and cardiotoxicity from DNA damaging anticancer agents

Affiliations

Tumour initiated purinergic signalling promotes cardiomyocyte RBFOX1 degradation and cardiotoxicity from DNA damaging anticancer agents

Saymon Tejay et al. Nat Commun. .

Abstract

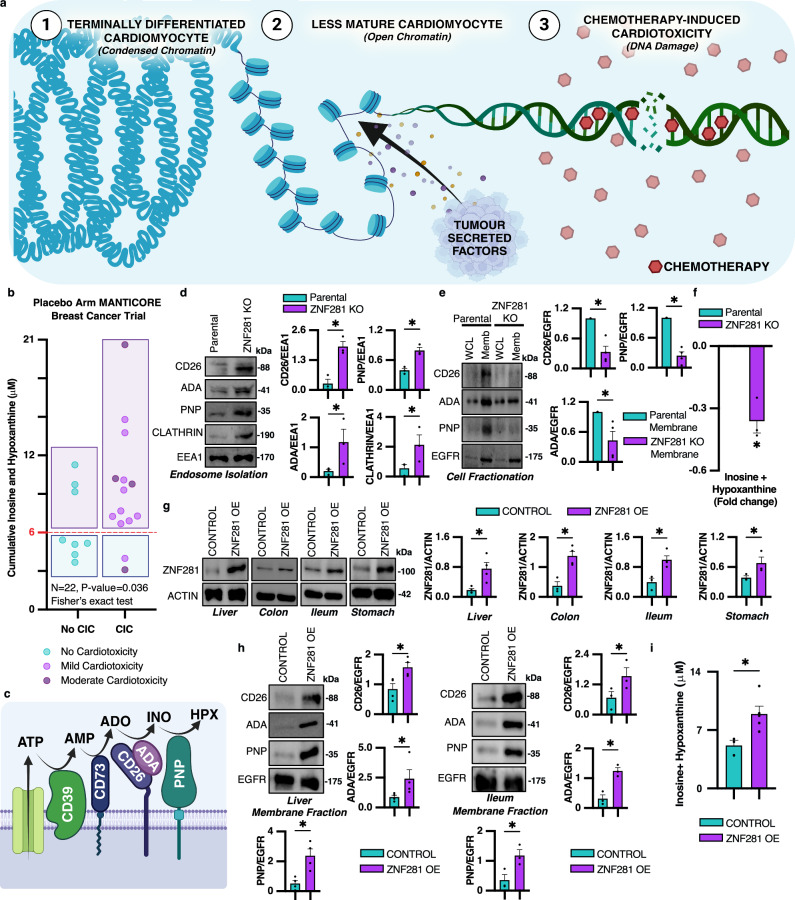
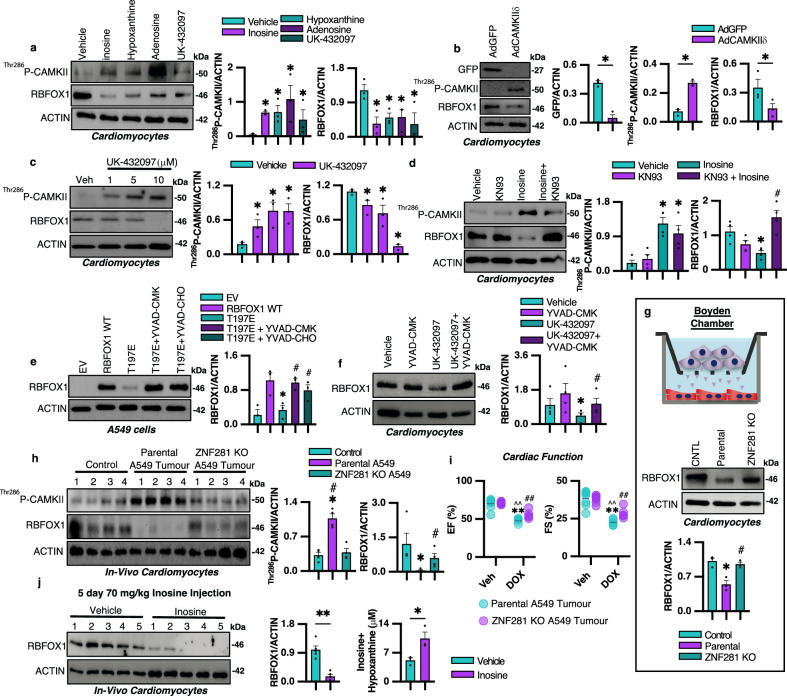
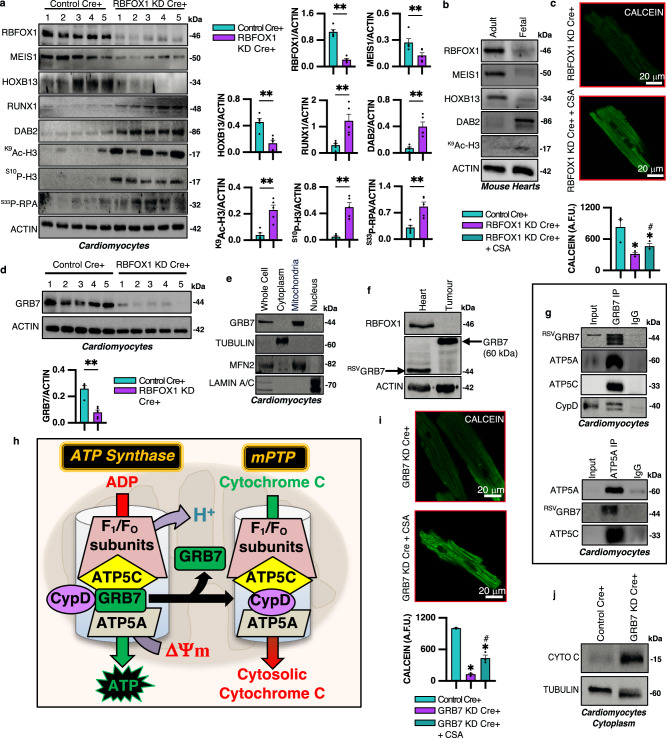
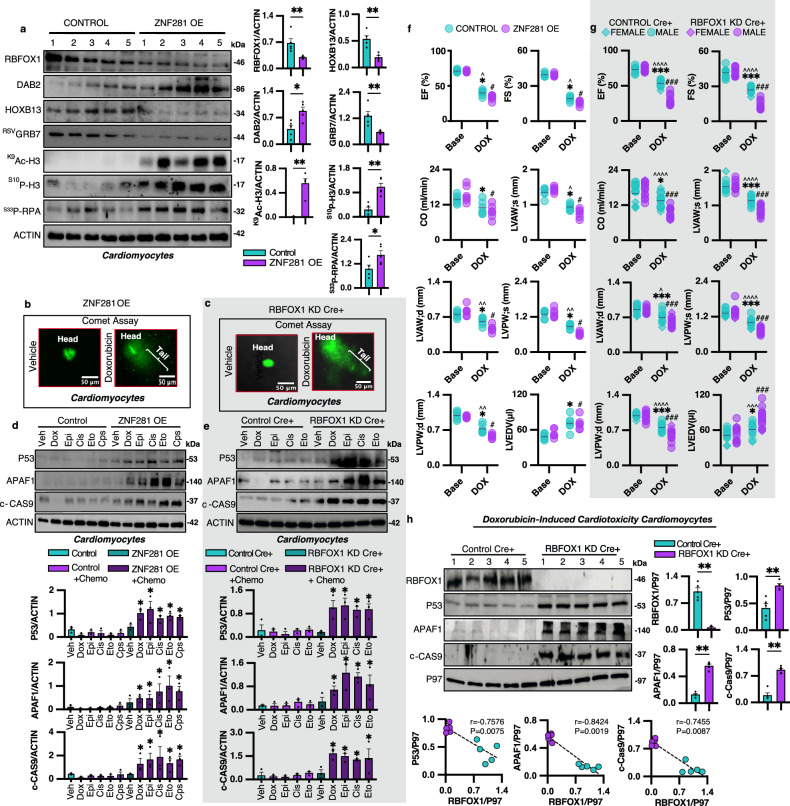
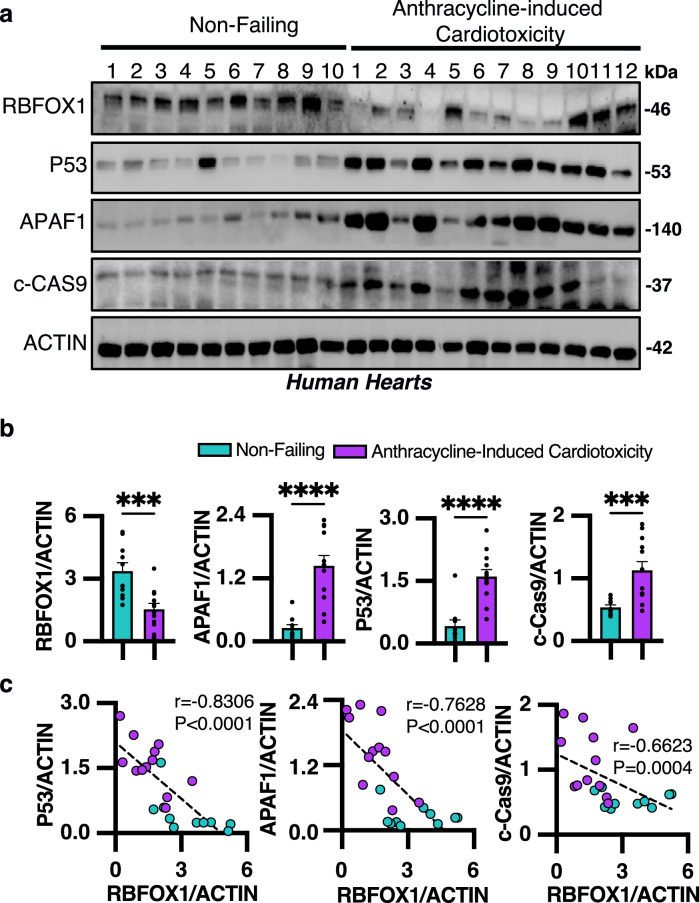
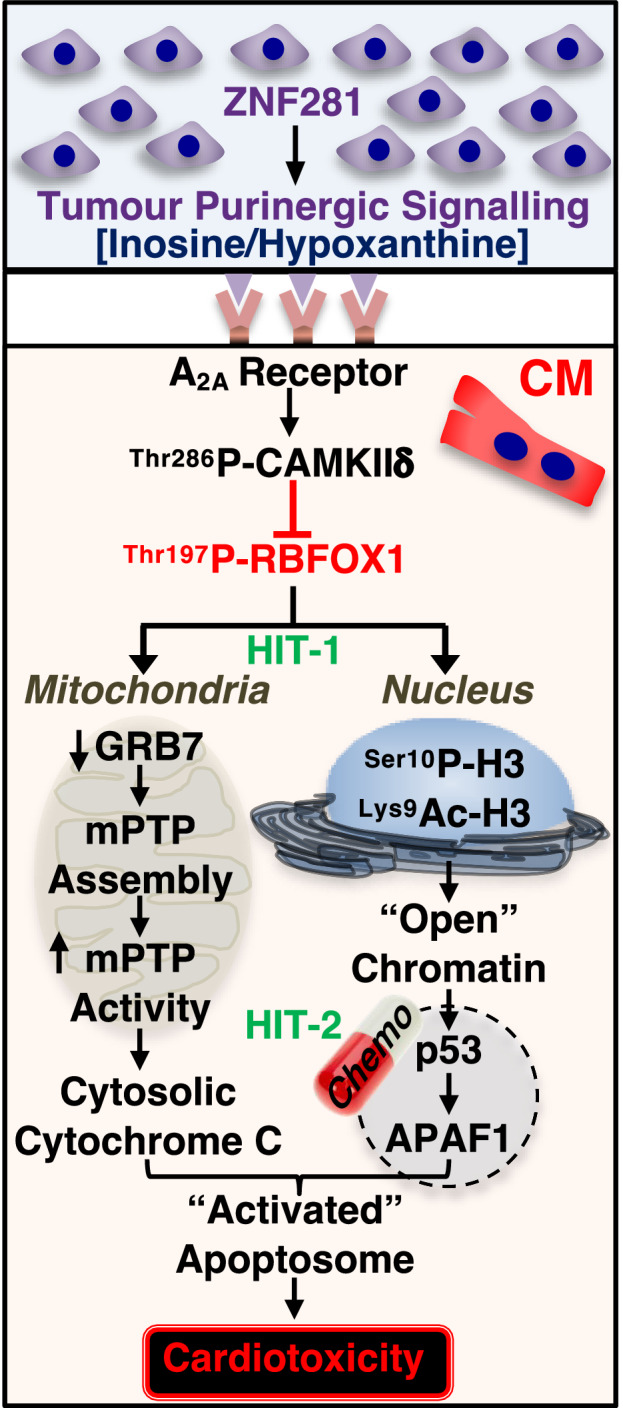
It is well established tumour cells secrete signalling factors affecting distant normal tissues. What remains unresolved is whether these factors initiate a signalling cascade rendering terminally differentiated cardiomyocytes susceptible to apoptosis, a feature of chemotherapy-induced cardiotoxicity (CIC). Here we show in MANTICORE trial cancer patients, cumulative baseline plasma levels of the nucleoside inosine and its derivative hypoxanthine predict cardiotoxicity. We found the Zn2+ finger transcription factor ZNF281 increases synthesis and release of inosine and hypoxanthine, which bind the A2A receptor on cardiomyocytes, activating CAMKIIδ which phosphorylates the postnatal mRNA splicing factor RBFOX1, resulting in its caspase-dependent degradation. RBFOX1 loss reverts cardiomyocytes to a less mature state with open chromatin and susceptibility to DNA damage, apoptosis or CIC, when treated with DNA intercalating or alkylating anticancer agents. These findings suggest cumulative inosine and hypoxanthine levels may be a biomarker predicting patient susceptibility to DNA damaging anti-cancer agents.


Conflict of interest statement

Competing interests: The authors declare no competing interests.

Figures

Fig. 1
Fig. 1. Inosine and hypoxanthine can predict cardiotoxicity susceptibility in cancer patients and its levels can be regulated by the stemness transcription factor ZNF281 which can stabilize several purinergic factors on the cell membrane of cancer cells.
a Under normal conditions, (1) terminally differentiated cardiomyocytes have condensed inaccessible chromatin that we hypothesise becomes (2) more accessible by tumour secreted factors, promoting loss of cardiomyocyte maturity and (3) intercalation of DNA damaging chemotherapeutics into now accessible chromatin resulting in DNA breaks and cardiotoxicity (BioRender Lorenzana (2025) https:// BioRender.com/2dyaqis). b Graph shows baseline cumulative inosine and hypoxanthine plasma levels in breast cancer patients from the MANTICORE trial placebo arm. Patients are grouped above or below a threshold of 6 μM: no cardiotoxicity (teal), mild cardiotoxicity (lilac) and moderate cardiotoxicity (purple), n = 22 patients, *P = 0.036 comparing CIC and no CIC above and below a post-hoc analysis determined threshold of 6 μM in a 2 × 2 contingency table, P-value is based on Fisher’s exact two-sided test. c Extracellular purinergic signalling and synthesis of inosine and hypoxanthine (BioRender). d Immunoblots show CD26, ADA, PNP, CLATHRIN in isolated endosomes in parental and ZNF281 KO A549 cells, n = 3 biological replicates, *P = 0.05 compared to parental endosomes. EEA1 used as a loading control. e Immunoblots show CD26, ADA, PNP in membrane cell fractionation of parental and ZNF281 KO A549 cells, n = 4 biological replicates, *P = 0.0143 compared to parental membrane fraction. EGFR was as a loading control. f Inosine and hypoxanthine measured in cell supernatant, n = 3 biological replicates, *P = 0.05 compared to parental supernatant. g Immunoblots show ZNF281 in control and ZNF281 overexpressing (OE) mouse liver (n = 4), colon (n = 3, control and n = 4, ZNF281 OE), ileum (n = 3, control and n = 4, ZNF281 OE) and stomach (n = 3) mice, *P = 0.0143, 0.0286, 0.0286, 0.05 respectively compared to control tissue. ACTIN used as a loading control. h Immunoblots show CD26, ADA, PNP in isolated membrane fractions from control and ZNF281 OE liver n = 4 and ileum n = 3 mice, *P = 0.0143 and *P = 0.05 compared to control tissue. EGFR was used as a loading control. i Mouse serum inosine and hypoxanthine in control vs. ZNF281 OE mice, n = 3 control and n = 5 ZNF281 OE mice, *P = 0.0357 compared to control mice. Unless otherwise stated, targets are run on the same gel and quantification values are expressed as mean ± SEM, P values based on one-sided Mann-Whitney Test. Source Data file is provided.
Fig. 2
Fig. 2. Inosine and hypoxanthine can bind and activate the A2A receptor on cardiomyocytes to promote a CAMKIIδ-mediated RBFOX1 phosphorylation and caspase-1-mediated degradation.
a Immunoblots show T286P-CAMKIIδ and RBFOX1 after A2A agonists treatment, n = 3 biological replicates, *P = 0.05 compared to vehicle. b Immunoblots show GFP, T286P-CAMKIIδ and RBFOX1 after adenovirus treatment overexpressing GFP or CAMKIIδ, n = 3 biological replicates, *P = 0.05 compared to GFP. c Immunoblots show T286P-CAMKIIδ and RBFOX1 after A2A agonist UK-432097 dose-response, n = 3 biological replicates, *P = 0.05 compared to vehicle. d Immunoblots show T286P- CAMKIIδ and RBFOX1 after CAMKII inhibitor KN93 ± inosine, *P = 0.0143 compared to vehicle, #P = 0.0143 compared to inosine. e Immunoblots show RBFOX1 in A549 cells transfected with empty vector, RBFOX1 WT, T197E RBFOX1 ± caspase 1 inhibitor (YVAD-CMK) or pan-caspase inhibitor (YVAD-CHO), n = 3 biological replicates, *P = 0.05 compared to WT, #P = 0.05 compared to T197E. f Immunoblots show RBFOX1 after UK-432097 ± YVAD-CMK treatment, *P = 0.0286 compared to vehicle, #P = 0.0143 compared to UK-432097. g Boyden chamber with A549 cancer cells plated above cardiomyocytes separated by inlets allowing only metabolite transfer. Immunoblots show RBFOX1 in these cardiomyocytes, n = 3 biological replicates, *P = 0.05 compared to control, #P = 0.05 compared to parental. h Immunoblots show T286P- CAMKIIδ and RBFOX1 ran on separate gels processed in parallel from non-tumour control, parental and ZNF281 KO A549 tumour mice, n = 4 mice, *P = 0.0143 compared to control, #P = 0.0143 compared to ZNF281 KO. i Cardiac function assessed by echocardiography showing ejection fraction (EF) and fractional shortening (FS). Values expressed as median ± IQR. n = 7 for untreated groups and n = 5 for doxorubicin treated groups **P = 0.013 compared to untreated parental tumour mice, ^^P = 0.0040 compared to doxorubicin-treated ZNF281 KO tumour mice, ##P = 0.0013, ##P = 0.0025 compared to untreated ZNF281 KO tumour mice for EF and FS respectively. j Immunoblots show RBFOX1 from inosine injected mice compared to controls. Graph depicts serum inosine+ hypoxanthine serum levels. n = 5 mice for immunoblots, **P = 0.004 compared to vehicle and n = 3 mice for serum, *P = 0.05 compared to vehicle. Unless otherwise stated, all treatments in isolated mouse cardiomyocytes for 72 h and targets run on the same gel. Quantification values expressed as mean ± SEM, n = 4 biological replicates. P < 0.05 for Kruskal Wallis test if multiple comparisons, P values based on one-sided Mann-Whitney Test. ACTIN used as a loading control for each blot. Source Data file is provided.
Fig. 3
Fig. 3. Loss of RBFOX1 in cardiomyocytes can promote a less mature state and GRB7 loss mediated activation of the mitochondrial permeability transition pore.
a Immunoblots show RBFOX1, MEIS1, HOXB13, RUNX1, DAB2, K9Ac-H3, S10P-H3, and S33P- RPA in control Cre+ and RBFOX1 KD Cre+, n = 5 mice, all comparisons **P = 0.004 except MEIS1, **P = 0.0079 compared to control Cre+ where RBFOX1 and MEIS1, HOXB13, RUNX1, DAB2 and K9Ac-H3, S10P-H3, S33P- RPA are ran on separate gels and processed in parallel. b Immunoblots show RBFOX1, MEIS1, HOXB13, DAB2, and K9Ac-H3 in adult compared to foetal mouse heart tissue, n = 2 mice where RBFOX1 and MEIS1, HOXB13, DAB2 and K9Ac-H3 are ran on separate gels and processed in parallel. c mPTP assay measuring calcein AM fluorescence (green) in adult control Cre+ and RBFOX1 KD Cre+ cardiomyocytes ± cyclosporin A for 30 minutes (CSA, a mPTP inhibitor), n = 3 biological replicates, *P = 0.05 compared to control Cre+, #P = 0.05 compared to RBFOX1 KD Cre+. d Immunoblots show GRB7 in cardiomyocytes isolated from control Cre+ and RBFOX1 KD Cre+ mice, n = 5 mice, **P = 0.004 compared to control Cre+. e Immunoblots show RSVGRB7, TUBULIN, MFN2, LAMIN A/C in cellular fractionation in isolated cardiomyocytes, n = 2 mice. f Immunoblots show RBFOX1 and GRB7 in heart and tumour samples depicting RSVGRB7 is distinct from the full-length tumour form, n = 2 mice. g Co-immunoprecipitation of RSVGRB7 and F1-ATP5α shows RSVGRB7, CypD, FO-ATP5c, F1- ATP5α in isolated wildtype cardiomyocytes, n = 3 mice. h Mitochondrial RSVGRB7 sequesters CypD from binding ATP synthase components allowing for efficient ATP production and membrane potential. RSVGRB7 loss now allows CypD binding to ATP synthase components to ‘hijack’ this channel and produce a functional mPTP. i mPTP assay measuring calcein AM (green) in control compared to GRB7-deficient cardiomyocytes ± cyclosporin A for 30 minutes. n = 3 biological replicates, *P = 0.05 compared to control Cre + , #P = 0.05 compared to GRB7 KD Cre+. j Immunoblot shows cytochrome c and TUBULIN in cytosolic fraction of isolated control Cre+ and GRB7-deficient cardiomyocytes, n = 2 mice. Unless otherwise stated, targets are run on the same gel and quantification values are expressed as mean ± SEM, P values are based on one-sided Mann-Whitney Test and ACTIN was used as a loading control for each blot. Source Data file is provided.
Fig. 4
Fig. 4. Klkb1-ZNF281 overexpression transgenic or cardiomyocyte-specific RBFOX1- deficient mice develop more severe cardiotoxicity and dilated cardiomyopathy, compared to controls.
a Immunoblots show RBFOX1, DAB2, HOXB13, RSVGRB7, K9Ac-H3, S10P-H3, and S33P-RPA from Control and ZNF281 OE, n = 5 mice, *P = 0.0159 for DAB2, *P = 0.0278 for S33P-RPA and **P = 0.004 for all others compared to Control where each target is run on a separate gel and processed in parallel except RBFOX1, HOXB13 and S10P-H3, S33P-RPA. b Comet assay in control vs. ZNF281 OE or (c) control Cre+ vs. RBFOX1 KD Cre+ cardiomyocytes treated with doxorubicin (1 μM) for 72 h (mean data in Supplementary Fig. 14). d Immunoblots show P53, APAF1, cleaved caspase 9 (c-CAS 9) from control and ZNF281 OE or (e) Control Cre+ and RBFOX1 KD Cre+ mice after chemotherapies: doxorubicin (1 μM), epirubicin (1 μM), cisplatin (500 nM), etoposide (500 nM), cyclophosphamide (500 nM), n = 3 biological replicates, *P = 0.05 compared to paired Control or control Cre+ chemotherapy. f Control and ZNF281 OE or (g) Control Cre+ and RBFOX1 KD Cre+ mice received doxorubicin and cardiac function was assessed via echocardiography using ejection fraction (EF), fractional shortening (FS), cardiac output (CO), systolic LV anterior/posterior wall thickness (LVAW;s, LVPW;s), diastolic LV anterior/posterior wall thickness (LVAW;d, LVPW;d), and end-diastolic volume (LVEDV). Values are expressed as median ± IQR. n = 6 mice for both control and ZNF281 OE *P = 0.0156 compared to baseline Control for all parameters except CO (*P = 0.0312), #P = 0.0156 compared to baseline ZNF281 OE, ^P = 0.013, ^^P = 0.0043 compared to DOX ZNF281 OE. n = 12 for control Cre+ and n = 13 for RBFOX1 KD Cre+ *P = 0.032, ***P = 0.0002 compared to baseline control Cre+, ###P = 0.0001 compared to baseline RBFOX1 KD Cre+, ^P = 0.0149, ^^^P = 0.001,^^^^P < 0.0001 compared to DOX RBFOX1 KD Cre+, P values are based on Mann-Whitney Test. h Immunoblots show RBFOX1, P53, APAF1, c-CAS9 from control Cre+ vs. RBFOX1 KD Cre+ treated with doxorubicin, n = 10 mice, **P = 0.004 compared to control Cre+. P97 was used as a loading control. Spearman’s rank order correlation shows RBFOX1 correlates negatively to P53 r = -0.7576, P = 0.0075), APAF1 r = -0.8424, P = 0.019), and c- CAS9 (r = -0.7455, P = 0.0087). Unless otherwise stated, targets are run on the same gel and quantification values are expressed as mean ± SEM, P values are based on one-sided Mann-Whitney Test and ACTIN was used as a loading control. Source Data file is provided.
Fig. 5
Fig. 5. Loss of RBFOX1 and activation of the apoptosome are features in explanted myocardial tissues of anthracycline-induced cardiotoxicity patients.
a Immunoblots show RBFOX1, P53, APAF1, c-CAS9 in a well characterised cohort of non- failing and AIC human patient explanted heart tissues. b Quantification values are expressed as mean ± SEM, n = 10 and 12 different patients. ***P = 0.0006 for RBFOX1, ***P = 0.0002 for c-CAS9,****P < 0.0001 for P53 and APAF1 compared to non-failing patients, P values are based on one-sided Mann-Whitney Test. Individual ACTIN was used as a loading control for each target run on different gels and processed in parallel. c Spearman’s rank order correlation shows RBFOX1 correlates to P53 negatively r = -0.8306, P < 0.0001, to APAF1 negatively r = -0.7628, P < 0.0001, to c-CAS9 negatively r = -0.6623, P = 0.0004. Source Data file is provided.
Fig. 6
Fig. 6. Mechanism for inosine and hypoxanthine mediated cardiomyocyte RBFOX1 degradation and loss of maturity.
Tumour ZNF281 mediates purinergic signalling and secreted inosine and hypoxanthine can bind and activate the cardiomyocyte A2A receptor, which results in phosphorylation and activation of CAMKIIδ, which can phosphorylate and promote caspase-1 mediated degradation of RBFOX1 (HIT 1). RBFOX1 loss results in decreased levels of RSVGRB7 and increased mPTP assembly and activity and release of cytosolic cytochrome c, as well as epigenetic remodelling via phosphorylated and acetylated H3, resulting in an open chromatin state. At this stage, several DNA damaging agents can intercalate with cardiomyocyte DNA, causing DNA breaks and induction of the pro-apoptotic transcription factor P53, along with its downstream transcriptional target APAF1 (HIT 2). Cytosolic cytochrome c can now bind APAF1 to initiate apoptosis and cardiomyocyte cell death, resulting in cardiotoxicity.

Similar articles

References

    1. Tisdale, M. J. Cachexia in cancer patients. Nat. Rev. Cancer2, 862–871 (2002). - PubMed
    1. Lenihan, D. J. & Cardinale, D. M. Late cardiac effects of cancer treatment. J. Clin. Oncol.30, 3657–3664 (2012). - PubMed
    1. Moslehi, J. J. Cardiovascular toxic effects of targeted cancer therapies. N. Engl. J. Med. 375, 1457–1467 (2016). - PubMed
    1. Sheppard, R. J., Berger, J. & Sebag, I. A. Cardiotoxicity of cancer therapeutics: current issues in screening, prevention, and therapy. Front Pharm.4, 19 (2013). - PMC - PubMed
    1. Ahuja, P., Sdek, P. & MacLellan, W. R. Cardiac myocyte cell cycle control in development, disease, and regeneration. Physiol. Rev.87, 521–544 (2007). - PMC - PubMed

MeSH terms