. 2025 Jul 26;15(1):27280.
doi: 10.1038/s41598-025-09771-9.

Clinical and molecular epidemiology of chikungunya outbreaks during 2019-2022 in India

Affiliations

Clinical and molecular epidemiology of chikungunya outbreaks during 2019-2022 in India

Naren Babu N et al. Sci Rep. .

Abstract

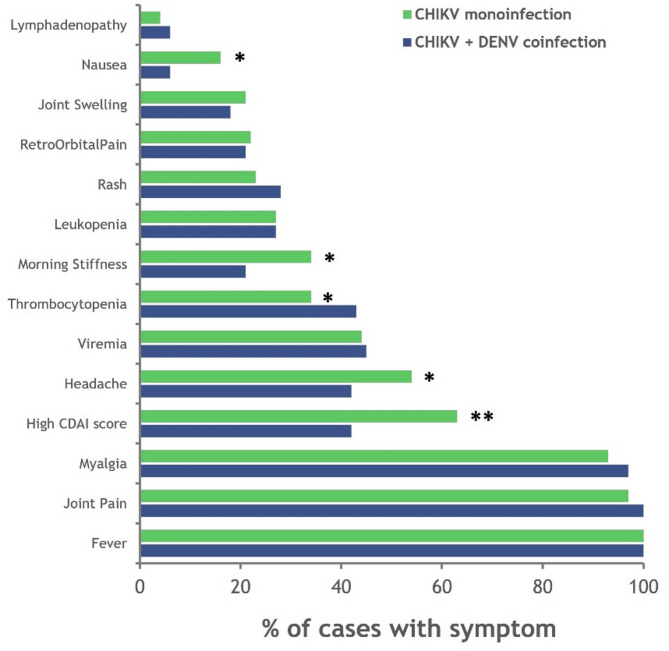
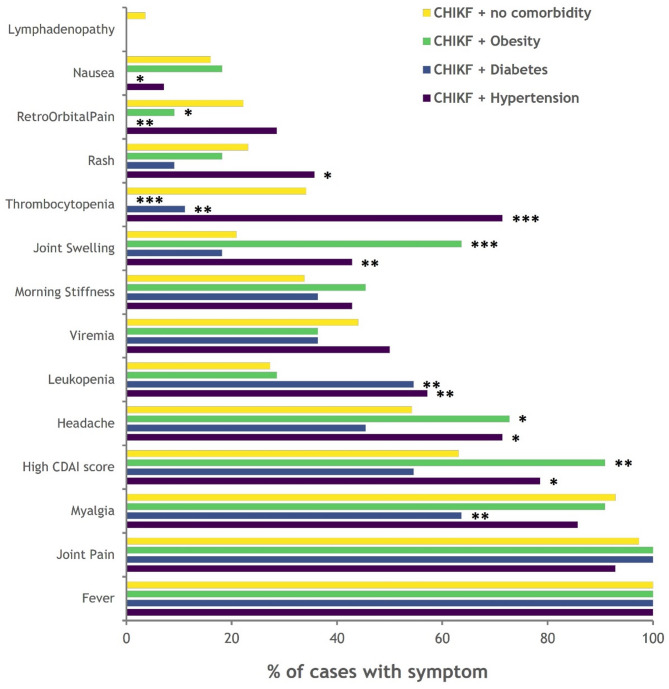
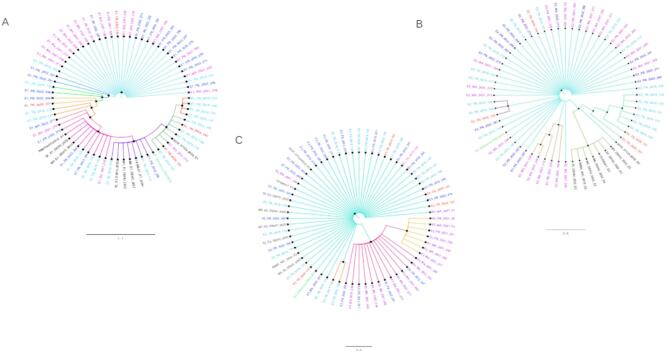
Chikungunya fever (CHIKF) is endemic in India, with multiple outbreaks occurring across the country since its reemergence in 2005. Suspected CHIKF patients were recruited from four clinical sites during 2019-2022, with data collected on sociodemographic, clinical, and epidemiological aspects. Sera samples were screened for IgM, IgG antibodies and viral RNA along with their neutralizing capacity. Envelope genes of Chikungunya virus (CHIKV) isolated were sequenced and further analysed. A total of 1312 suspected patients were screened during the study period; 258 patients were laboratory-confirmed with CHIKV infection. Severe clinical manifestation was observed in the patients during the viremic phase of infection. The neutralization potential was found to be increasing proportionally with the onset of illness, coinciding with the rise of IgG antibodies. Three of the four clinical sites had reported CHIKF outbreaks at different time points during the study period, and a distinct pattern of clinical presentation was observed across the sites. Phylogenetic and network analyses of E1, E2 and E3 genes from 62 CHIKV isolates demonstrated their evolution within the country. This study provides preliminary evidence of spatial and temporal variation in the clinical presentation and molecular evolution of virus in CHIKF outbreaks across India.

Keywords: CHIKV outbreaks; Chikungunya fever; Clinical epidemiology; Comorbidities; Dengue coinfection; Good health and well being; Molecular epidemiology; Spatial variation.


Conflict of interest statement

Declarations. Competing interests: The authors declare no competing interests.

Figures

Fig. 1
Fig. 1
Seasonality of Chikungunya patients identified in India during the study period (Aug 2019–Dec 2022). The number of suspected cases is presented in the background as an area graph referring to the Y-axis on the right (Grey shading). The month-wise numbers of laboratory-confirmed CHIKF cases are presented as a multicolour stacked column chart referring to the Y-axis on the left (The blue-Krishnagiri district of Tamilnadu, the orange-Mumbai district of Maharashtra, the yellow-Chandigarh district of Punjab and the green-Khordha district of Odisha).
Fig. 2
Fig. 2
Clinical symptoms of chikungunya were recorded at the time of enrolment. (a) The proportions (0 to 1) of patients who presented with clinical symptoms are presented in a heatmap. The scale at the right top corner represents the proportion of patients with symptoms occurring in the increasing shade of orange (mildest shade: 0 and darkest shade: 1). (b) The proportions (0 to 1) of patients identified as reactive to the laboratory assays are presented in a heatmap. The scale at the right top corner represents the proportion of patients with symptoms occurring in the increasing shade of orange (mildest shade: 0 and darkest shade: 1). (c) The proportions (0 to 1) of patients identified with CHIKF categorically based on their socio-economic status are presented in a heatmap. The scale at the right top corner represents the proportion of patients with symptoms occurring in the increasing shade of orange (mildest shade: 0 and darkest shade: 1).
Fig. 3
Fig. 3
Clinical symptoms of patients with dengue coinfection. The line graph represents the differences in the percentage (0 to 100) of clinical symptoms between CHIKV mono-infections (Green) and coinfections with DENV (Blue). The statistical significance was estimated using Fisher’s exact test (p-value presented in the graphs: <0.05-* and < 0.01-**).
Fig. 4
Fig. 4
Clinical symptoms of CHIKF patients with comorbidity. The line graph represents the differences in the percentage (0 to 100) of clinical symptoms between CHIKF + no comorbidity (Yellow), CHIKF + Obesity (Green), CHIKF + diabetes (Blue), and CHIKF + Hypertension (Purple). The statistical significance was estimated using Fisher’s exact test (p-value presented in the graph: <0.05-*, < 0.01-** and < 0.001-∗∗∗).
Fig. 5
Fig. 5
Mid-point rooted Maximum likelihood phylogenetic tree for E1, E2 and E3 sequences. Lab generated datasets has been highlighted in different colours on collection year basis. Sequence from year 2019 are highlighted in sky blue colour. Sequences which were collected in 2020 are highlighted in red colour. Sequences from year 2021 are highlighted in magenta colour while reference genome from 2006 (FJ000068), the very first sequence which were submitted to the database after re-emergence of chikungunya in India is highlighted in green colour. 2022 sequences are highlighted in blue colour. Sequences which are collected from database has been remained in black colour. Taxon labels include gene name, collection state, collection year and virus strain (pool number). The scale bar indicates percent divergence between sequences (A) Phylogenetic tree showing the clustering of E1 sequences. (B) Phylogenetic tree showing the evolutionary relationship between E2 sequences. (C) Evolutionary relatedness between E3 sequences from 2019–2022.
Fig. 6
Fig. 6
Genetic network analysis of E gene region of Indian CHIKV isolates. Nomenclature includes state name, collection year and lab generated virus strain name. Networks are labelled by years of sample collection (2019–2022) and by geographic origin (Maharashtra, Tamil Nadu, Punjab, Gujrat). The length of network connections reflects the number of mutations.

References

    1. Jagadesh, A. et al. Current status of Chikungunya in India. Front. Microbiol.12, 1–21 (2021). - PMC - PubMed
    1. Chaudhary, S. et al. Chikungunya virus molecular evolution in India since its re-emergence in 2005. Virus Evol.10.1093/ve/veab074 (2021). - PMC - PubMed
    1. Facts about Chikungunya. Directorate of national vector borne disease control program. Ministry of Health and Family Welfare, Govt. of India. p. 6. https://nvbdcp.gov.in/WriteReadData/l892s/Facts_about_Chikungunya17806.pdf
    1. Suhrbier, A. Rheumatic manifestations of chikungunya: emerging concepts and interventions. Nat. Rev. Rheumatol.15 (10), 597–611. 10.1038/s41584-019-0276-9 (2019). - PubMed
    1. Simon, F., Javelle, E., Oliver, M., Leparc-Goffart, I. & Marimoutou, C. Chikungunya virus infection. Curr. Infect. Dis. Rep.13 (3), 218–228 (2011). - PMC - PubMed

MeSH terms

LinkOut - more resources