. 2025 Jul 26;11(1):82.
doi: 10.1038/s41540-025-00563-5.

Unraveling regulatory feedback mechanisms in adult neurogenesis through mathematical modelling

Affiliations

Unraveling regulatory feedback mechanisms in adult neurogenesis through mathematical modelling

Diana-Patricia Danciu et al. NPJ Syst Biol Appl. .

Abstract

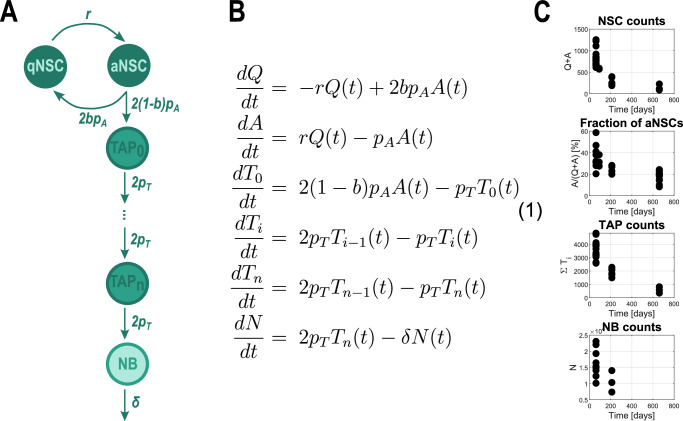
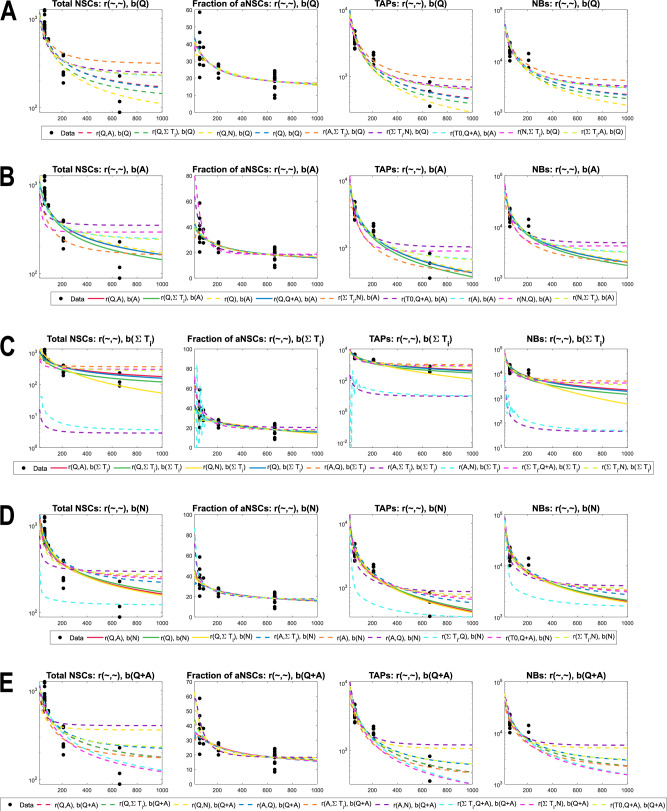
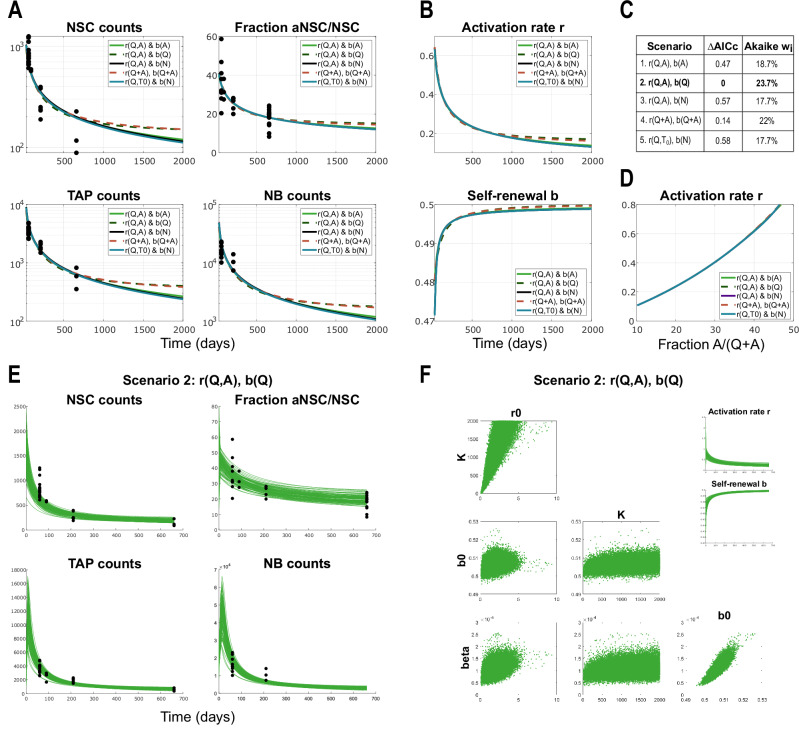
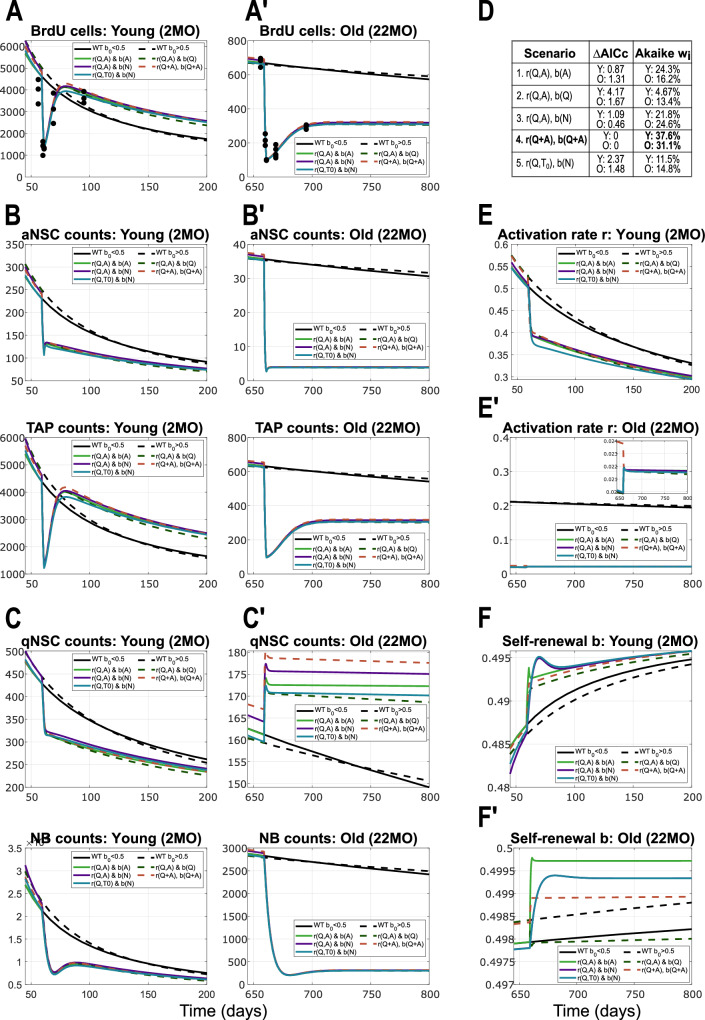
Adult neurogenesis is defined as the process by which new neurons are produced from neural stem cells in the adult brain. A comprehensive understanding of the mechanisms that regulate this process is essential for the development of effective interventions aimed at decelerating the decline of adult neurogenesis associated with ageing. Mathematical models provide a valuable tool for studying the dynamics of neural stem cells and their lineage, and have revealed alterations in these processes during the ageing process. The present study draws upon experimental data to explore how these processes are modulated by investigating regulatory feedback mechanisms among neural populations through the lens of nonlinear differential equations models. Our observations indicate that the time evolution of the neural lineage is predominantly regulated by neural stem cells, with more differentiated neural populations exerting a comparatively weaker influence. Furthermore, we shed light on the manner in which different subpopulations govern these regulations and gain insights into the impact of specific perturbations on the system.


Conflict of interest statement

Competing interests: The authors declare no competing interests.

Figures

Fig. 1
Fig. 1. Mathematical model and data of cell population dynamics.
A Schematic of the transitions among neural cell types, represented in the mathematical model. The arrows and rates depicted represent the inflow from the previous compartment. B Mathematical model. System of ODEs describing the time dynamics of the neural populations depicted in A. The number of amplification steps n = 3, corresponding to 4 TAP compartments Ti. C Existing data from refs. ,: total number of NSCs; fraction of active cells among label retaining cells, confirmed to be a good approximation of the fraction of active neural stem cells among all neural stem cells; total number of TAPs and total number of NBs in the ventricular-subventricular zone. Each data point corresponds to one mouse.
Fig. 2
Fig. 2. Identifying the time-dependence of system parameters.
A Results of the various scenarios considered in ref.  and reviewed in ref. . The system parameters are given by time-dependent functions r(t)=rmaxeβrt and b(t)=12(1+eβbt(2bmin1)) introduced in refs. ,, which are basic examples of decaying activation and increasing self-renewal. Plots adapted from ref. . B System parameters, i.e., activation rate r and fraction of self-renewal b from the linear model plotted against values of various neural lineage populations (scaled up to 1000 cells). C 3D plot of the activation rate r with respect to various combinations of neural cell subpopulations.
Fig. 3
Fig. 3. Comparison among various scenarios for the regulation of activation rate, grouped by the inhibitor of the self-renewal.
A Self-renewal inhibited by qNSC, b(Q). B Self-renewal inhibited by aNSC, b(A). C Self-renewal inhibited by TAPs, b(∑Ti). D Self-renewal inhibited by NBs, b(N). E Self-renewal inhibited by total number of NSCs, b(Q + A). As a notation rule, r(c1, c2) corresponds to activating Hill functions (1) in which c1 promotes (is in the numerator) and c2 inhibits (denominator) r. Here, NSC counts represent Q(t) + A(t), fraction of active corresponds to A(t)/(Q(t) + A(t)), TAP counts is considered the sum i=03Ti(t) and NB counts is given by N(t). Solid lines represent scenarios in which the estimated parameter b0 < 0.5 and the system only admits the trivial equilibrium. Dotted lines correspond to scenarios in which b0 > 0.5 and thus a stable positive steady state exists. X-axis represents Time, i.e., the age of mice in days. Y-axis is on log-scale in all except the plot depicting the fraction of active cells. For readability, in the plot legends, we write the multivariate functions r(c1) ≔ r(c1, c1).
Fig. 4
Fig. 4. Model results and comparison among the five scenarios considered, applied to data from WT mice.
A Results showing the dynamics of lineage cell subpopulations in time, from the parameter estimation for five different scenarios in which the system parameters are regulated by lineage cell populations. Here NSC counts represent Q(t) + A(t), fraction of active corresponds to A(t)/(Q(t) + A(t)), TAP counts is considered the sum i=0nTi(t) and NB counts is given by N(t). The scenarios considered in these plots are described by equations (2)-(6). Solid lines represent scenarios in which the estimated parameter b0 < 0.5 and the system only admits the trivial equilibrium. Dotted lines correspond to scenarios in which b0 > 0.5 and thus a stable positive steady state exists. X-axis represents Time, i.e., the age of mice in days. Y-axis is in logarithmic scale in all plots except for the one depicting the fraction of active cells. For readability, in the plot legends we write the multivariate functions r(Q + A) ≔ r(Q + A, Q + A). B Dynamics in time of the system parameters, activation rate r and fraction of self-renewal b, from the five scenarios considered in panel A, described by Eqs. (2–6). C Model comparison based on AICc values and their respective Akaike weights. The best-scoring model according to Akaike metrics is Scenario 2, Eq. (3) with r(Q, A), b(Q). D Activation rate r plotted against the fraction of active NSCs A/(Q + A) for the five scenarios, showing an almost linear correlation. X-axis is A/(Q + A), y-axis is r. E Trajectories of the solutions to Scenario 2, r(Q, A), b(Q) (Eq. (3)) corresponding to initial conditions sampled from a Gaussian distribution with mean and variance extrapolated from the available data, and parameter estimates from 250000 MCMC chain samples. The Y-axis is linear scale. F Posterior distributions of model parameters and their correlation plots from the 250000 MCMC chain samples. Right-hand side insets show the time-course of system feedback functions r and b computed for the selected parameter values from the MCMC chain.
Fig. 5
Fig. 5. Model results and comparison among the five scenarios considered, applied to data from TMZ treatment.
Panels are split into young (letter X) and old (letter X'). AA'. Results showing the recovery of proliferating cells (BrdU positive, consisting of aNSCs and TAPs) after TMZ treatment, in young (2MO) and old (22MO) mice. Throughout Fig. 4, black (solid and dotted) lines correspond to 2 scenarios of the WT unperturbed dynamics. More specifically, the two WT scenarios depicted are: r(Q, A), b(A) (solid line) and r(Q, A), b(Q) (dotted line). Solid lines (both WT and perturbed) correspond to models where b0 < 1/2 (with trivial steady state), and dotted lines to scenarios in which b0 > 1/2 (having a stable positive steady state). BB' Dynamics of aNSCs (top) and TAPs (bottom), which together form the BrdU cells from panel A, in young (B) and old (B') mice. CC' Dynamics of the populations of qNSCs (top) and NBs (bottom) in time, as a result of TMZ intervention on BrdU cells, in young (C) and old (C') mice. D Table comparing the five scenarios based on AICc values, and their Akaike weights quantifying the individual probabilities for selection. The model in which the entire population of NSCs (Q + A) regulates both r and b scores the highest (Scenario 4, Eq. (5), “r(Q + A, Q + A), b(Q + A)''). EE' Activation rates r in the case of TMZ treatment compared to the WT setting, in young (E) and old (E') mice. FF' Fraction of self-renewal b upon TMZ treatment in comparison to the case of the unperturbed WT setting, in young (F) and old (F') mice. For readability, in the plot legends, we write the multivariate functions r(Q + A) ≔ r(Q + A, Q + A).
Fig. 6
Fig. 6. Model results and comparison among the five scenarios considered, applied to data from IFNAGR KO mice.
A Simulation results showing the dynamics of lineage cell subpopulations in time, from fitting to the IFNAGR KO data, for the five different scenarios. The scenarios considered in these plots are given by Eqs. (8–12). Parameter estimation finds b0 > 0.5 in all five scenarios and thus the system has a stable positive steady state to which it converges. X-axis represents Time, i.e., the age of mice in days. Y-axis is in logarithmic scale in all plots except the one depicting the fraction of active cells. B Dynamics in time of the system parameters, activation rate r and fraction of self-renewal b, from the five scenarios considered in panel A. C Comparison between WT and IFNAGR KO fits to their respective data for two scenarios: r(Q, A), b(A) (solid lines, for WT b0 < 0.5) and r(Q, A), b(Q) (dotted lines, for WT b0 > 0.5). D Dynamics of the activation rate and fraction of self-renewal for comparing IFNAGR KO with WT, for the scenarios considered in C. E Table with AICc values for model selection and their respective Akaike weights, for the model of IFNAGR KO dynamics. F Overview table with AICc scores and Akaike weights for each scenario, computed separately for WT, TMZ and IFNAGR KO, as well as combined for all settings and data together ("Overall''). For readability, in the plot legends, we write the multivariate functions r(Q + A) ≔ r(Q + A, Q + A).
Fig. 7
Fig. 7. Model results and comparison among the two best-scoring scenarios and the Delta-Notch-Wnt scenario “r(Q, Q + A), b(Q)”, applied to data from WT and IFNAGR KO mice.
A Simulation results showing the dynamics of lineage cell subpopulations in time, from fitting to the WT data, for the three different scenarios. The scenarios considered in these plots are given by equations (9, 11), and (15). Parameter estimation finds b0 > 0.5 in all three scenarios and thus the system has a stable positive steady state to which it converges. X-axis represents Time, i.e., the age of mice in days. Y-axis is in logarithmic scale in all plots except the one depicting the fraction of active cells. For readability, in the plot legends, we write the multivariate functions r(Q + A) ≔ r(Q + A, Q + A). B Simulation results showing the dynamics of lineage cell subpopulations in time, from fitting to the IFNAGR KO data, for the three different scenarios. C Table with AICc values for model selection and their respective Akaike weights, for the three model scenarios depicted in AB. D Simulation results of the three scenarios showing the recovery of the population of BrdU cells after treatment with TMZ, in young (left) and old (right) mice. EE'. Plots of posterior distributions of model parameters and their correlation plots from the samples of the MCMC chain, in WT (E) and IFNAGR KO (E') mice. The insets show the dynamics of the solutions corresponding to initial conditions sampled from a Gaussian distribution with mean and variance extrapolated from the available data points, and parameters sampled from their posteriors.

Similar articles

Cited by

  • Cross-species comparison reveals therapeutic vulnerabilities halting glioblastoma progression.
    Foerster LC, Kaya O, Wüst V, Danciu DP, Akcay V, Bekavac M, Ziegler KC, Stinchcombe N, Tang A, Kleber S, Tang J, Brunken J, Lois-Bermejo I, Gesteira-Perez N, Ma X, Sadik A, Le PU, Petrecca K, Opitz CA, Liu H, Wirtz CR, Goncalves A, Marciniak-Czochra A, Anders S, Martin-Villalba A. Foerster LC, et al. Nat Commun. 2025 Aug 6;16(1):7250. doi: 10.1038/s41467-025-62528-w. Nat Commun. 2025. PMID: 40770193 Free PMC article.

References

    1. Kempermann, G. & Gage, F. H. New nerve cells for the adult brain. Sci. Am.280, 48–53 (1999). - PubMed
    1. Encinas, J. M. et al. Division-coupled astrocytic differentiation and age-related depletion of neural stem cells in the adult hippocampus. Cell Stem Cell8, 566–579 (2011). - PMC - PubMed
    1. Ming, G.-l & Song, H. Adult neurogenesis in the mammalian brain: significant answers and significant questions. Neuron70, 687–702 (2011). - PMC - PubMed
    1. Seib, D. R. et al. Loss of Dickkopf-1 restores neurogenesis in old age and counteracts cognitive decline. Cell Stem Cell12, 204–214 (2013). - PubMed
    1. Conover, J. C. & Todd, K. L. Development and aging of a brain neural stem cell niche. Exp. Gerontol.94, 9–13 (2017). - PMC - PubMed

LinkOut - more resources