. 2025 Jul 25;15(1):27136.
doi: 10.1038/s41598-025-09220-7.

Podocyte dysfunction driven by heme in sickle-cell nephropathy

Affiliations

Podocyte dysfunction driven by heme in sickle-cell nephropathy

Chloé Ben Ali et al. Sci Rep. .

Abstract

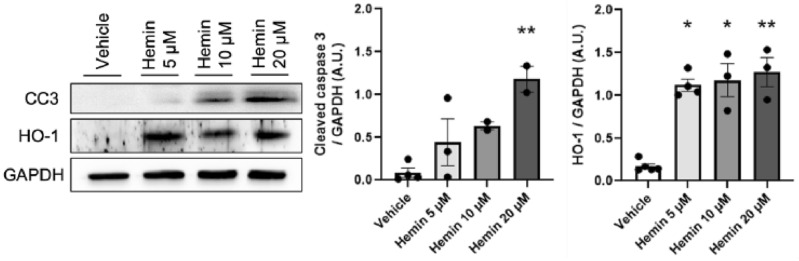
Sickle-cell disease (SCD) is characterized by vaso-occlusive crises and chronic hemolytic anemia, leading to tissue damage affecting various organs, including the kidneys. Hemolysis contributes to sickle-cell nephropathy (SCN) but the molecular mechanisms underlying the intravascular hemolysis and heme release involved in podocyte damage leading to proteinuria and chronic kidney disease remain uncertain. This study explored the impact of heme on podocyte function by exposing human podocytes cell line to hemin (5 μM hemin for 4 and 24 h), with or without the antioxidant N-acetyl cysteine (NAC). We then assessed the relevance of in vitro studies on renal biopsy specimens from controls with primary and secondary forms of focal segmental glomerulosclerosis (FSGS) and patients with SCD-related FSGS. After 4 h of hemin exposure, podocyte cytoskeleton alterations and increased apoptosis were observed. At 24 h, heme oxygenase-1 (HO-1) expression increased, alongside oxidative stress, DNA damage, and mitochondrial and endoplasmic reticulum dysfunctions. NF-κB pathway activation suggested an adaptive response. NAC partially reduced these effects, indicating oxidative stress's central role while implicating additional mechanisms in apoptosis induction. Renal biopsies from patients with focal segmental glomerulosclerosis (FSGS), including SCD-related cases, showed elevated HO-1 and BiP in podocytes compared to normal glomeruli, along with reduced synaptopodin, indicating damage. In conclusion, this study highlights the molecular mechanisms underlying heme-induced podocyte damage in SCN. Oxidative stress appears to play a key role, but other pathological pathways are also involved. These results open up new perspectives for understanding and treating SCN.

Keywords: Cellular stress; Heme; Hemolysis; Oxidative stress; Podocyte.


Conflict of interest statement

Declarations. Competing interests: The authors declare no competing interests.

Figures

Fig. 1
Fig. 1
Hemin (5 µM, exposure for 4 h and 24 h) induces major cytoskeletal modifications and the death of podocytes after 4 h of exposure (A) Light microscopy of podocytes. Scale bar = 1 mm. (B) Immunostaining of actin (green) stained with phalloidin and its quantification with Kruskal–Wallis test. Nuclei are stained in blue. Scale bar = 50 µm. (C) Percent viability determined with trypan blue. (D) Western-blot analysis of cleaved caspase 3 (CC3) and its quantification with normalization against GAPDH. Veh = Vehicle. * p < 0.05; ** p < 0.01; *** p < 0.001 in two-way ANOVA and Tukey tests.
Fig. 2
Fig. 2
Study of podocyte cytoskeleton and slit diaphragm proteins after hemin exposure (5 µM, 4 h). (A, C). Immunostaining for α-actinin 4 (red), tubulin (green), nephrin (green), podocin (red), and synaptopodin (green) (A) and WT1 (red) (C) and their quantification with Mann–Whitney tests. Nuclei are stained in blue. Scale bar = 100 µm. (B, D). Western-blot analysis of phosphorylated nephrin, nephrin, podocin, α-actinin 4 (B) and WT1 (D), and their quantification relative to GAPDH. Veh = Vehicle. Statistical analysis was performed with Mann–Whitney tests.
Fig. 3
Fig. 3
Oxidative stress induced by hemin exposure (5 µM, 4 h and 24 h) in podocytes. (A) Western-blot analysis of HO-1 and its quantification against GAPDH. (B) Immunostaining of HO1 (red) and nuclei (blue) and its quantification with Kruskal–Wallis test. (C) Flow-cytometry analysis of DCFDA probe fluorescence intensity on podocytes exposed to hemin for 4 h and 24 h, with quantification. The blue line represents vehicle, hemin is shown in red, and the positive control, H2O2, is shown in black. (D) Western-blot analysis of γH2AX and its quantification relative to GAPDH. E. Immunostaining of γH2AX (red), 8-OH-dG (green) and nuclei (blue) and their quantification with Kruskal–Wallis test. Scale bar = 100 µm and 50 µm for γH2AX. Veh = Vehicle, * p < 0.05 and ** p < 0.01 in two-way ANOVA and Tukey tests.
Fig. 4
Fig. 4
Hemin exposure (5 µM, 4 h and 24 h) leads to cellular stress in podocytes. (A-B) Flow cytometry analysis of Mitotracker Green (A) and Mitotracker Red (B) staining intensity, with quantification. (C) Western-blot analysis of BiP and GADD153, with quantification and normalization against GAPDH. (D) Immunostaining for BiP (red) and CHOP (green) and their quantification with Kruskal–Wallis test. Nuclei are stained in blue. Scale bar = 100 µm. Veh = Vehicle, * p < 0.05 and ** p < 0.01 in two-way ANOVA and Tukey tests.
Fig. 5
Fig. 5
Study of a regulator of cell-stress responses in podocytes after exposure to hemin (5 µM, 4 h and 24 h). (A) Western-blot analysis of p-NF-κB and NF-κB and their quantification, with normalization against GAPDH. Veh = Vehicle, * p < 0.05 in two-way ANOVA and Tukey tests. (B) Immunostaining of p-NF-κB (green) and its quantification with Kruskal–Wallis test. Nuclei are stained in blue. Scale bar = 100 µm.
Fig. 6
Fig. 6
The antioxidant NAC (5 mM, 4 h) attenuates the effect of hemin on podocytes (5 µM, 4 h). (A-B) Immunostaining for actin (green), stained with phalloidin, and γH2AX (red) and their quantification with Kruskal–Wallis test. Nuclei are stained in blue. Scale bar = 100 µm. (C) Flow-cytometry analysis of DCFDA probe fluorescence intensity on podocytes exposed to hemin for 4 h in the presence or absence of NAC, with quantification. (D) Western-blot analysis of CC3, HO-1 and γH2AX, with quantification and normalization against GAPDH. Veh = Vehicle, NAC = N-acetylcysteine. * p < 0.05 and ** p < 0.01 in Kruskal–Wallis tests.
Fig. 7
Fig. 7
Hemosiderin deposits on renal biopsy specimens from patients with FSGS related to sickle-cell disease (SCD-FSGS). (A-B) Perls’ Prussian blue staining on renal biopsy specimens from control patients: the tubular epithelium (A) and glomerulus (B). Scale bar = 20 µm. (C-D) Perls’ Prussian blue staining on renal biopsy specimens from patients with SCD-FSGS showing hemosiderin deposits in the tubular epithelium (A) and podocytes (B), Scale bar = 5µm. Arrows show hemosiderin deposits on glomerulus.
Fig. 8
Fig. 8
Immunofluorescence analysis of renal biopsy specimens. (A-B) Immunostaining for synaptopodin (green) and HO-1 (red) (A) or BiP (red) (B) on renal biopsy specimens from normal human kidney (NHK), patients with FSGS with another etiology (control FSGS) and FSGS related to sickle-cell disease (SCD-FSGS). Nuclei are stained in blue. Scale bar = 50 µm, viewed with a × 40 objective. (C) Quantification of the fluorescence intensity of synaptopodin, HO-1 and BiP reported per glomerulus on renal biopsy specimens with Kruskal–Wallis test.
Fig. 9
Fig. 9
Hemin concentration range for determination of the optimal concentration (24 h) – Western-blot analysis of CC3 and HO-1, with quantification and normalization against GAPDH. * p < 0.05, ** p < 0.01 in Kruskal–Wallis tests.
Fig. 10
Fig. 10
Uncropped images from Western blot analyses used in Fig. 1 and 2 – (A.) CC3 and GAPDH and their molecular weight marker in Fig. 1D. B. α-Actinin-4, p-nephrin, nephrin, podocin and GAPDH and their molecular weight marker in Fig. 2B. (C.) WT1 and GAPDH and their molecular weight marker in Fig. 2D.
Fig. 11
Fig. 11
Uncropped images from Western blot analyses used in Fig. 3 and 4 – A. HO-1 and GAPDH and their molecular weight marker in Fig. 3A. B. γH2AX and GAPDH and their molecular weight marker in Fig. 3D. C. BIP, CHOP and GAPDH and their molecular weight marker in Fig. 4C. D. p-NF- κB, NF- κB and GAPDH and their molecular weight marker in Fig. 5A.
Fig. 12
Fig. 12
Uncropped images from Western blot analyses used in Fig. 5, 6 and Appendix Fig. 9 – A. p-NF- κB, NF- κB and GAPDH and their molecular weight marker in Fig. 5A. B. HO-1, CC3 and GAPDH and their molecular weight marker in Fig. 6D. C. CC3, HO-1 and GAPDH Appendix Fig. 9.

References

    1. Kato, G. J. et al. Sickle cell disease. Nat. Rev. Dis. Primers4, 18010. 10.1038/nrdp.2018.10 (2018). - PubMed
    1. Derebail, V. K. et al. Progressive decline in estimated GFR in patients with sickle cell disease: an observational cohort study. Am. J. Kidney Dis.74, 47–55. 10.1053/j.ajkd.2018.12.027 (2019). - PMC - PubMed
    1. Guasch, A., Navarrete, J., Nass, K. & Zayas, C. F. Glomerular involvement in adults with sickle cell hemoglobinopathies: prevalence and clinical correlates of progressive renal failure. J. Am. Soc. Nephrol.17, 2228–2235. 10.1681/ASN.2002010084 (2006). - PubMed
    1. Gérardin, C. et al. Survival and specific outcome of sickle cell disease patients after renal transplantation. Br. J. Haematol.187, 676–680. 10.1111/bjh.16113 (2019). - PubMed
    1. Nielsen, L. et al. Morbidity and mortality of sickle cell disease patients starting intermittent haemodialysis: a comparative cohort study with non- Sickle dialysis patients. Br. J. Haematol.10.1111/bjh.14040 (2016). - PubMed

MeSH terms

LinkOut - more resources