. 2025 Jul 26;15(1):27236.
doi: 10.1038/s41598-025-10852-y.

Modeling monkeypox transmission with a compartmental framework to evaluate testing, isolation and public awareness strategies

Affiliations

Modeling monkeypox transmission with a compartmental framework to evaluate testing, isolation and public awareness strategies

Akindele Akano Onifade et al. Sci Rep. .

Abstract

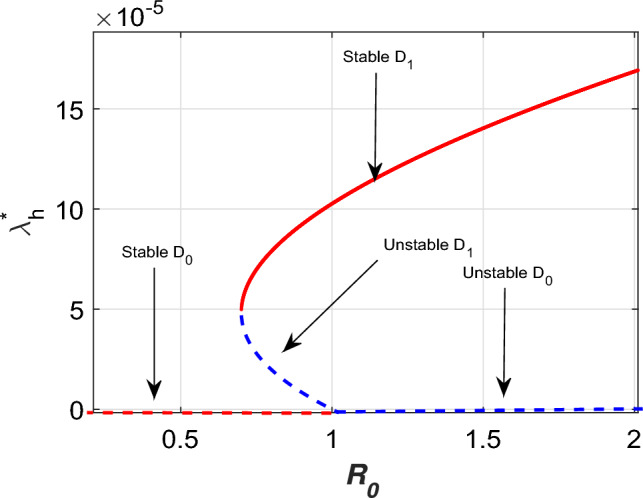
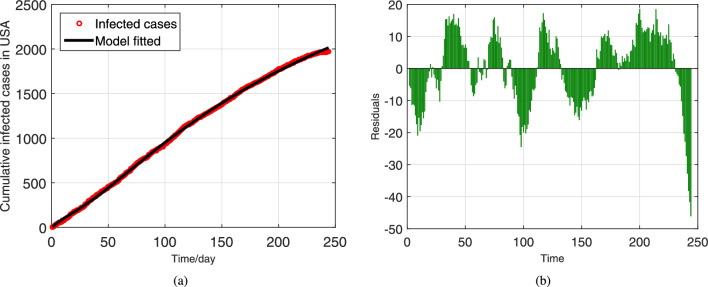
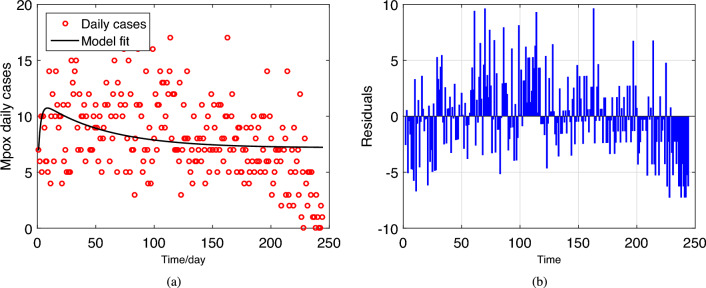
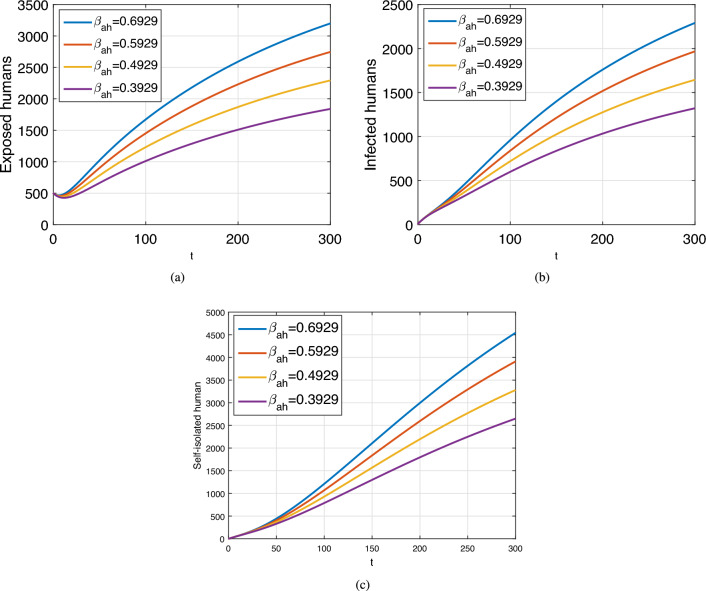
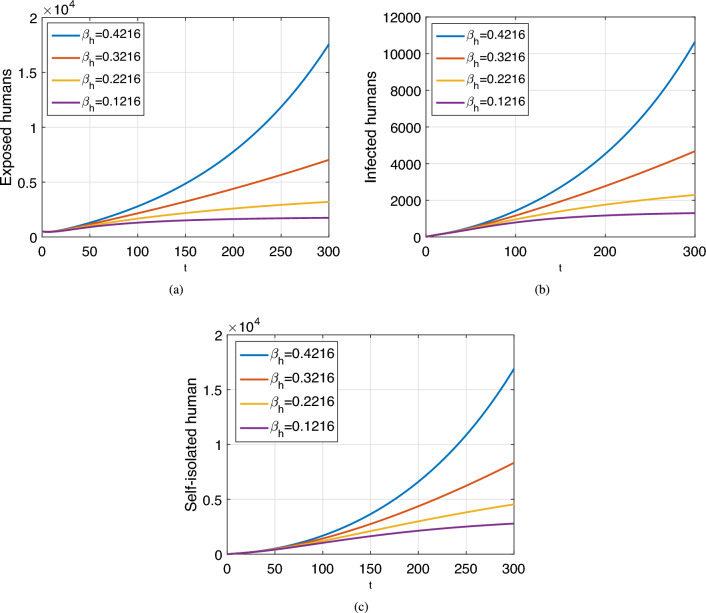
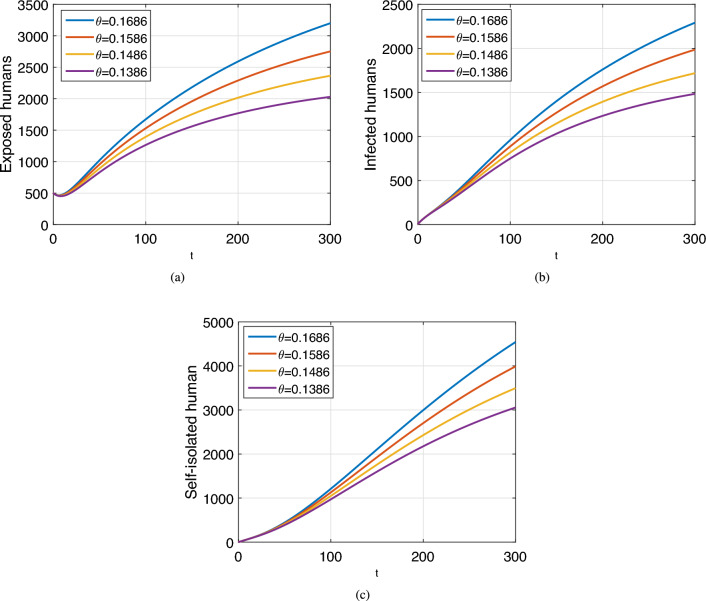
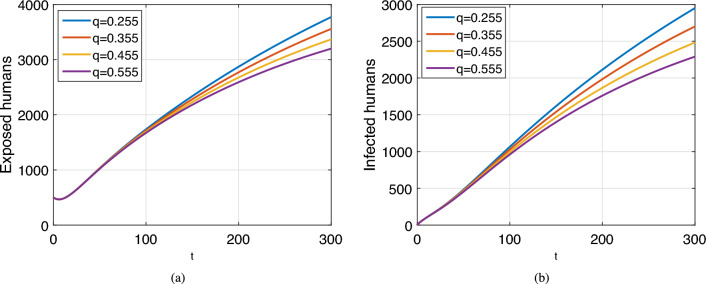
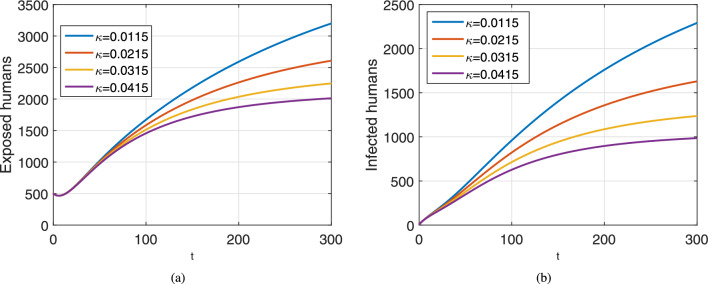
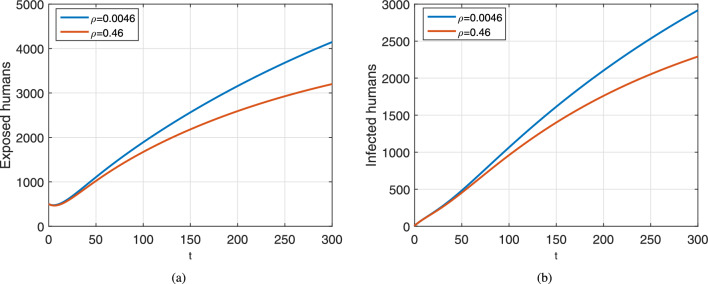
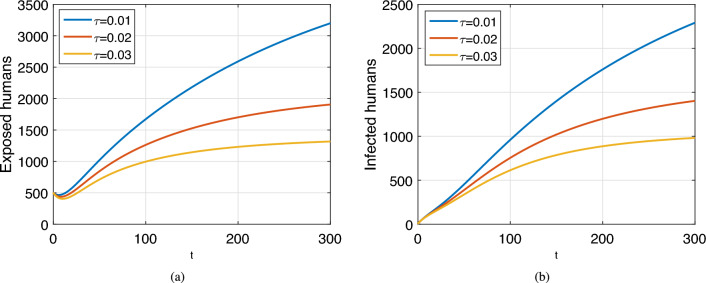
Monkeypox (mpox), a viral infectious disease affecting both humans and non-human primates, has posed significant public health challenges, particularly in light of recent global outbreaks. This study develops a deterministic mathematical model to analyze the transmission dynamics of mpox, with a focus on the effects of self-isolation, testing, and public awareness in mitigating the spread of the virus. The model is calibrated using incidence data from the United States and employs a nonlinear least squares fitting method to reflect the observed epidemic trends accurately. The analysis identifies key parameters influencing the spread of mpox, including the transmission probabilities between human to human and mammal to human, as well as the effectiveness of public awareness campaigns. Stability analysis of the model reveals that the mpox-free equilibrium is locally asymptotically stable (LAS) when the basic reproduction number [Formula: see text] is less than 1, indicating disease elimination. Conversely, when [Formula: see text], the presence of a stable endemic equilibrium suggests the potential for sustained transmission if control measures are not adequately implemented. Sensitivity analysis reveals that factors like transmission rates, public awareness levels, and isolation rates significantly impact the disease's spread, providing insights into which interventions may be most effective. Numerical simulations demonstrate the potential of targeted strategies, showing that even partial adherence to isolation and public awareness strategies can significantly reduce new infections. A comprehensive approach combining effective isolation, expanded testing, and targeted awareness campaigns is crucial in managing mpox outbreaks. This approach provides valuable guidance for public health strategies, supporting the design of interventions that can prevent the spread of mpox and ensure better preparedness for future outbreaks.


Conflict of interest statement

Declarations. Competing interests: The authors are declared that they no potential conflict of interest regarding the publication of this work.

Figures

Fig. 1
Fig. 1
Flow diagram illustrating the transmission dynamics of the mpox model, incorporating key factors such as self-isolation in the human compartment, testing for the mpox virus, and public awareness measures.
Fig. 2
Fig. 2
The plot describes the backward bifurcation diagram for model (3). The bold red line indicates the stable endemic equilibrium formula image, the red dashed line on the x-axis shows the stable disease-free equilibrium formula image, the blue dashed line on the x-axis represents the unstable formula image, while the blue dashed line on the vertical y-axis indicates the unstable formula image
Fig. 3
Fig. 3
The plot shows the data fitting to the model. In subfigure (a), the model is compared to the data, with the bold line representing the model’s solution and the circles denoting the actual reported cases from the USA. Subfigure (b) presents the corresponding residuals.
Fig. 4
Fig. 4
The plot shows the data fitting to the model. In subfigure (a), the model is compared to the daily cases, with the bold line representing the model’s solution and the circles denoting the actual reported cases from the USA. Subfigure (b) presents the corresponding residuals.
Fig. 5
Fig. 5
The normalized forward sensitivity analysis of formula image.
Fig. 6
Fig. 6
The plot describes the dynamics of the exposed, infected and self-isolated humans individuals under varying values of formula image. Subfigures (ac) show the trajectories of the exposed, infected and self-isolated people, respectively.
Fig. 7
Fig. 7
The plot describes the dynamics of the exposed, infected, and self-isolated human individuals under varying values of formula image. Specifically, subfigures (a), (b), and (c) depict the temporal changes in the numbers of exposed, infected, and self-isolated people, respectively. Variations in formula image represent changes in the human-to-human transmission rate, demonstrating how this parameter influences disease progression across the compartments.
Fig. 8
Fig. 8
The plot describes the dynamics of exposed, infected, and self-isolated individuals for different values of formula image. Subfigures (a), (b), and (c) display the temporal changes in the number of exposed, infected, and self-isolated people, respectively.
Fig. 9
Fig. 9
The plot describes the dynamics of the exposed, infected, and self-isolated human individuals with different values of formula image. Subfigures (ac) indicate the exposed, infected, and self-isolated people.
Fig. 10
Fig. 10
The plot describes the dynamics of the exposed and infected human individuals for different values of q. Subfigures (a) and (b) show the temporal evolution of the exposed and infected individuals, respectively.
Fig. 11
Fig. 11
The plot describes the dynamics of the exposed and infected human individuals with different values of formula image. Subfigures (a) and (b) indicate the exposed and the infected individuals, respectively.
Fig. 12
Fig. 12
The plot describes the dynamics of the exposed and infected human individuals with different values of formula image. Subfigures (a) and (b) indicate the exposed and the infected individuals, respectively.
Fig. 13
Fig. 13
The plot describes the dynamics of the exposed and infected human individuals with different values of formula image. Subfigures (a) and (b) indicate the exposed and the infected individuals, respectively.

References

    1. World health organization (WHO). mpox fact sheet. https://www.who.int/news-room/fact-sheets/detail/mpox. Accessed on September 20, (2024).
    1. Mpox (mpox)-cdc, 2023. https://www.cdc.gov/poxvirus/mpox/if-sick/transmission.html. Accessed on August 08, (2024).
    1. Africa cdc, center for disease control and prevention, Africa cdc epidemic intelligence weekly report. https://africacdc.org/download/africa-cdc-weekly-event-based-surveillanc... Accessed on August 17, (2024).
    1. Who recommended the new name-mpox. https://news.un.org/en/story/2022/11/1131082. Accessed on August 18, (2024).
    1. Bulletin of the atomic scientist (bas). A new mpox variant is taking off in Africa. The who plan for stopping it isn’t realistic.

LinkOut - more resources