. 2025 Jul 26;8(1):1108.
doi: 10.1038/s42003-025-08507-9.

Single-cell antigen receptor sequencing in pigs with influenza

Affiliations

Single-cell antigen receptor sequencing in pigs with influenza

Weihong Gu et al. Commun Biol. .

Abstract

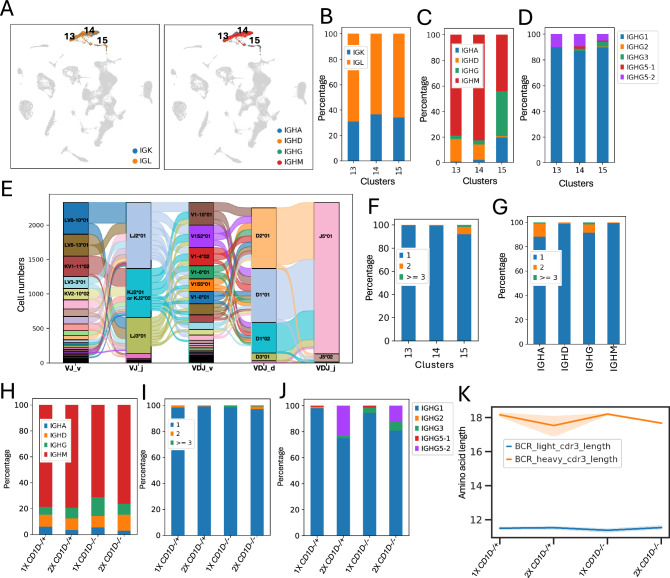
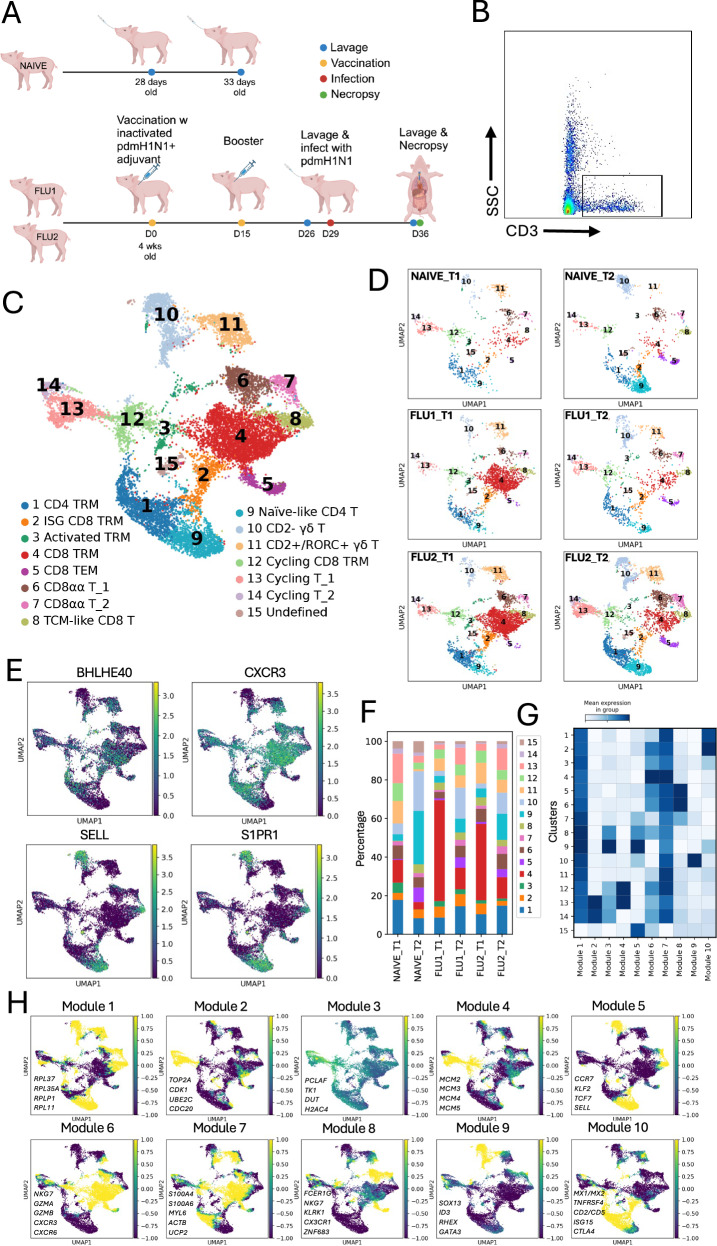
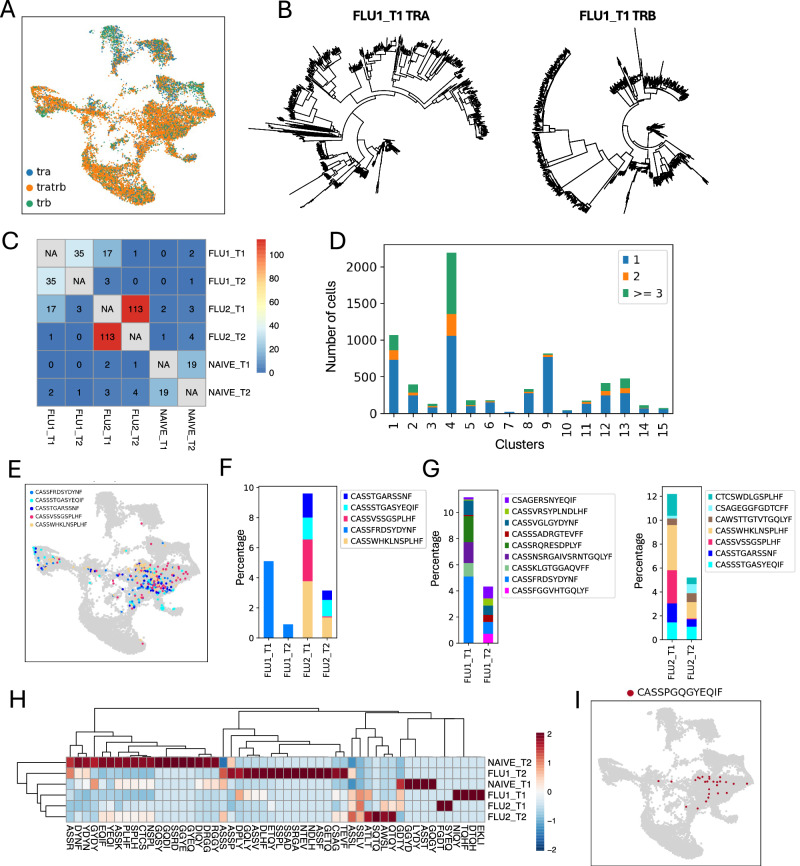
Single-cell RNA sequencing (scRNAseq) has accelerated characterizing cellular phenotypes in pigs under healthy and diseased conditions. To pair scRNAseq with immune receptor profiling, we developed porcine-specific T cell receptor (TCR) and B cell receptor (BCR) enrichment primers that are compatible with the 10 × Genomics VDJ sequencing protocol. Using these assays, we profiled the immune repertoire of cryopreserved lung cells from CD1D-expressing and CD1D-deficient pigs after one or two infections with influenza A virus (IAV) to examine whether natural killer T (NKT) cells influence pulmonary TCR and BCR receptor repertoires. We also profiled T cells longitudinally sampled from the lung fluid of IAV-vaccinated and -infected pigs to track clonal expansion. While all pigs presented highly diverse repertoires, pigs re-exposed to IAV had more expanded T cell clonotypes with activated phenotypes, suggesting potential IAV-reactive clones. Our results demonstrate the utility of high throughput single cell TCR and BCR sequencing in pigs.


Conflict of interest statement

Competing interests: The authors declare no competing interests.

Figures

Fig. 1
Fig. 1. Single-cell transcriptomic analysis of IAV-infected CD1D−/− and CD1D−/+ pig lungs.
A Overview of experiment setup. 3 CD1D−/− and 3 CD1D−/+ pigs were infected with pdmH1N1 IAV. Fourteen days later, the same 6 pigs were infected with H1N1 A/Missouri/CS20N08/2020 (MO20) IAV (designated 2X pigs) along with an additional 3 CD1D−/− and 3 CD1D−/+ pigs (designated 1X pigs). Necropsies were performed 5 days after the MO20 infection to collect lung tissue for single-cell immune profiling. Created with BioRender. B Uniform manifold approximation and projection (UMAP) visualization of lung leukocyte populations colored by cell clusters. Clusters were identified using the graph-based Louvain algorithm at a resolution of 0.5. C The average frequency of each cell type is presented for each treatment. D Bar graphs displaying the number of upregulated and downregulated differentially expressed genes (DEGs) in 2X compared to 1X CD1D−/+ and CD1D−/− pigs. E Bar graphs displaying the number of DEGs in CD1D−/+ versus CD1D−/− pigs after 1X or 2X infections. The DEGs were selected using a threshold of adjusted p-value < 0.05 (Data file 1). F Ingenuity Pathway Analysis (IPA) using 2X versus 1X NK cell (cluster 11) DEGs in CD1D−/+ and CD1D−/− pigs. G IPA analysis using CD1D−/+ versus CD1D−/− monocyte/macrophage (cluster 17) DEGs in 1X and 2X infected pigs. A z score of −2.0 < Z  >  2.0 and p < 0.05 were considered significant. The y-axis displays the top 20 pathways. The dot size displays significance [−log10 (P value)] of gene sets. Dot color saturation represents the z score. Data file 1 contains a complete list of significantly enriched cluster 11 and 17 IPA pathways.
Fig. 2
Fig. 2. Characterization of T cell clonotypes from lung tissue.
A UMAP plot of cells expressing one (tra, trb) or both (tratrb) TCR α and TCR β chains. B UMAP plot of cells with paired TCRα and TCRβ chains that were used for downstream analysis. C Relationship between TRBV and TRBJ usage in T cell receptor rearrangements by treatment. Cell barcode counts for TRBV and TRBJ gene segments were normalized by cell numbers across treatments and scaled by TRBV segments. D Principal component analysis of TRBV and TRBJ gene usages by individual pig. E, F Heatmaps showing row-scaled mean expression of the 10 highest differentially expressed SLA class I (E) and SLA class II (F) genes per pig. G Heatmap of overlapping clonotypes defined by identical CDR3β region sequences between pigs. H Proportion of clonotypes by treatment with 1, 2, ≥ 3 cells per clonotype. I Abundance of clonotypes by cluster with 1, 2, ≥ 3 cells per clonotype in the combined dataset. J Expression of naive and activation T cell markers in expanded and non-expanded clonotypes in the combined dataset. K UMAP plot displaying the five most expanded clonotypes in the combined dataset. L, M Number of cells in each of the five most expanded clonotypes by treatment (L) and cluster (M). The percentage values displayed in the (M) figure legend represent the proportion of each clonotype relative to the total number of TCR+ cells used in the analysis, as shown in (B). See Fig. 1B for cluster annotations for (I) and (M).
Fig. 3
Fig. 3. B cell receptor repertoire profiling of lung tissue B cells.
A UMAP plots of cells expressing IGK and IGL chains and IGHM, IGHD, IGHG, and IGHA chains. B Proportion of cells expressing IGK and IGL in each B cell cluster. C Percentage of cells expressing IGHM, IGHD, IGHG, and IGHA in each B cell cluster. D Percentage of IGHG+ cells expressing different porcine IGHG subclasses in each B cell cluster. E Number of cells expressing light and heavy chain V(D)J gene segments. F Percentage of clonotypes by cluster with 1, 2, ≥ 3 cells per clonotype. G Percentage of clonotypes by IGH chain with 1, 2, ≥ 3 cells per clonotype. H Proportion of cells expressing IGHM, IGHD, IGHG, and IGHA by treatment. I Percentage of clonotypes by treatment with 1, 2, ≥ 3 cells per clonotype. J Percentage of IGHG+ cells expressing different porcine IGHG subclasses by treatment. K Length of light and heavy chain CDR3 sequences by treatment.
Fig. 4
Fig. 4. Single-cell transcriptomic analysis of T cells isolated from lung lavage fluid.
A Overview of experiment setup. T cells were FACS-sorted from the lung lavage fluid of 3 infant pigs: 2 pdmH1N1-vaccinated and -infected pigs (FLU1 and FLU2) and 1 naïve pig (NAÏVE). FLU pigs were sampled 3 days before IAV infection (T1) and 7 days after infection (T2). The NAÏVE pig was sampled at 28 (T1) and 33 (T2) days of age. Created with BioRender. B FACS plot showing acquisition of lung lavage T cells. C UMAP plot of the combined T cell datasets. D UMAP plots displaying individual samples. E Examples of genes used to identify resident (BHLHE40 and CXCR3) and circulating (SELL and S1PR1) T cells. F Proportions of T cell subsets in individual pigs at T1 and T2 timepoints. G Heatmap of 10 gene modules whose genes had a similar expression pattern across cell clusters. H UMAPs showing select genes from each module.
Fig. 5
Fig. 5. T cell clonotype tracking using VDJ recombination at the TRB locus.
A UMAP plot of cells expressing one (tra, trb) or both (tratrb) TCR α and TCR β chains in the combined dataset. B Phylogenetic trees of TCRα and TCRβ sequences in the FLU1_T1 sample. C Heatmap of overlapping clonotypes between samples. D Abundance of clonotypes by cluster with 1, 2, ≥ 3 cells per clonotype in the combined dataset. See Fig. 4C for cluster annotations. E UMAP plot displaying the five most expanded clonotypes in the combined dataset. F Number of cells in each of the five most expanded clonotypes by sample. G Proportion of the most abundant clonotypes in FLU1 and FLU2 pigs by sample time. H Heatmap displaying the most abundant CDR3β 4-mer motifs in each pig normalized by cell numbers in each sample. I T cell clones expressing the CDR3β sequence ASSPGQGYEQ that matches a human CDR3β sequence recognizing the human HLA-A*0201 M1 epitope GILGFVFTL.

Update of

References

    1. Gomes, T., Teichmann, S. A. & Talavera-López, C. Immunology driven by large-scale single-cell sequencing. Trends Immunol.40, 1011–1021 (2019). - PubMed
    1. Jovic, D. et al. Single-cell RNA sequencing technologies and applications: a brief overview. Clin. Transl. Med12, e694 (2022). - PMC - PubMed
    1. Miragaia, R. J. et al. Single-cell transcriptomics of regulatory T cells reveals trajectories of tissue adaptation. Immunity50, e497. 493-504 (2019). - PMC - PubMed
    1. Lönnberg, T. et al. Single-cell RNA-seq and computational analysis using temporal mixture modelling resolves Th1/Tfh fate bifurcation in malaria. Sci. Immunol.2, eaal2192 (2017). - PMC - PubMed
    1. Lunney, J. K. et al. Importance of the pig as a human biomedical model. Sci. Transl. Med.13, eabd5758 (2021). - PubMed

MeSH terms

Substances

LinkOut - more resources