. 2025 Jul 25;15(1):27102.
doi: 10.1038/s41598-025-12077-5.

Lipidomic and transcriptomic profiling reveal alterations in the coexistence of gestational diabetes mellitus and preeclampsia impacting maternal and neonatal outcomes

Affiliations

Lipidomic and transcriptomic profiling reveal alterations in the coexistence of gestational diabetes mellitus and preeclampsia impacting maternal and neonatal outcomes

Chenxiao Zhang et al. Sci Rep. .

Abstract

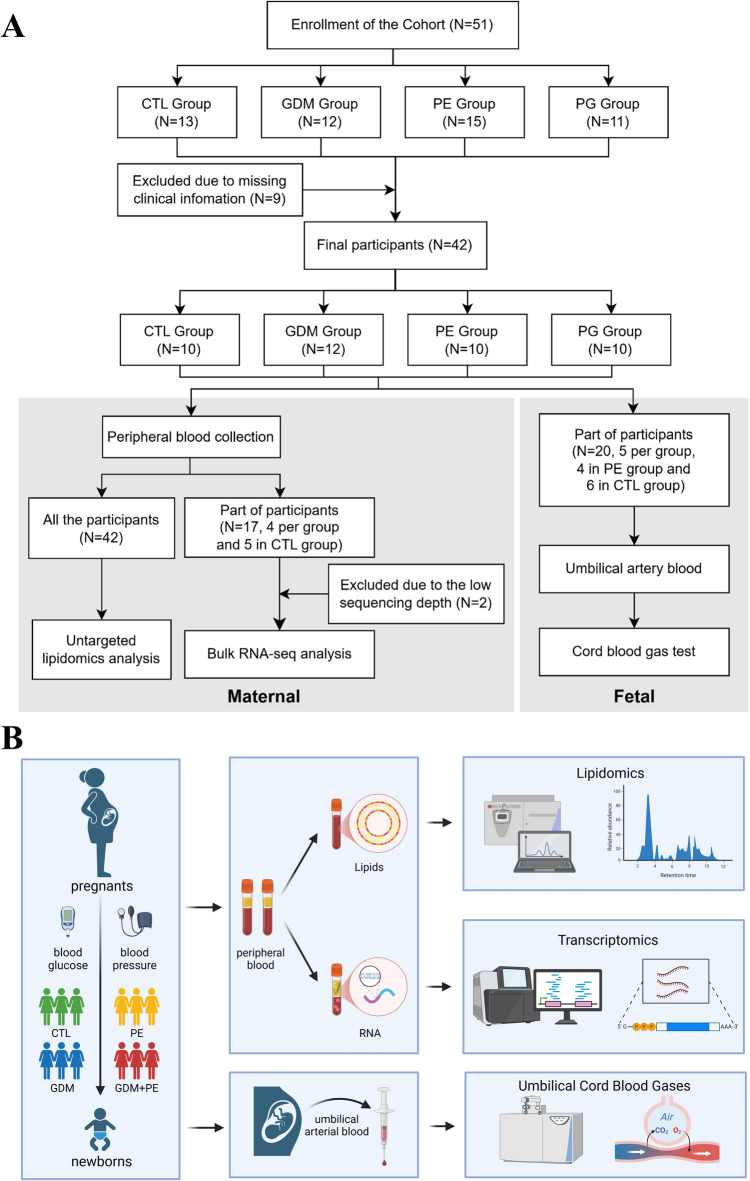
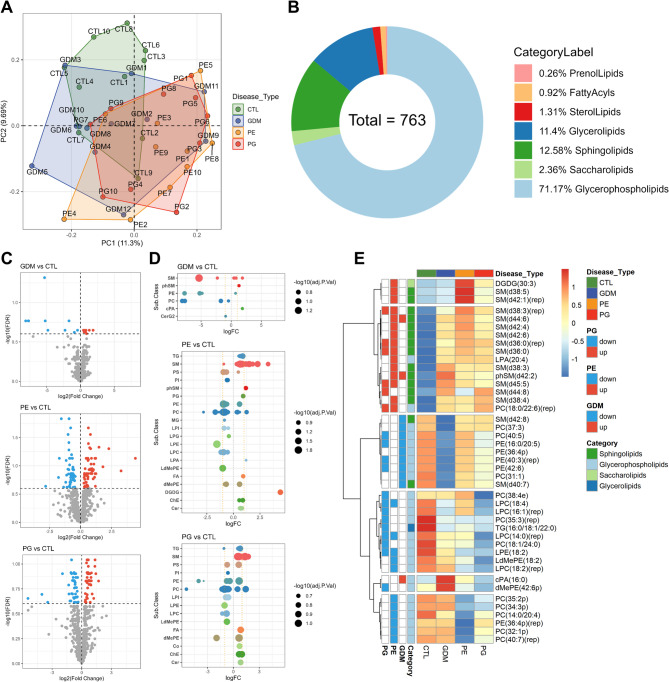
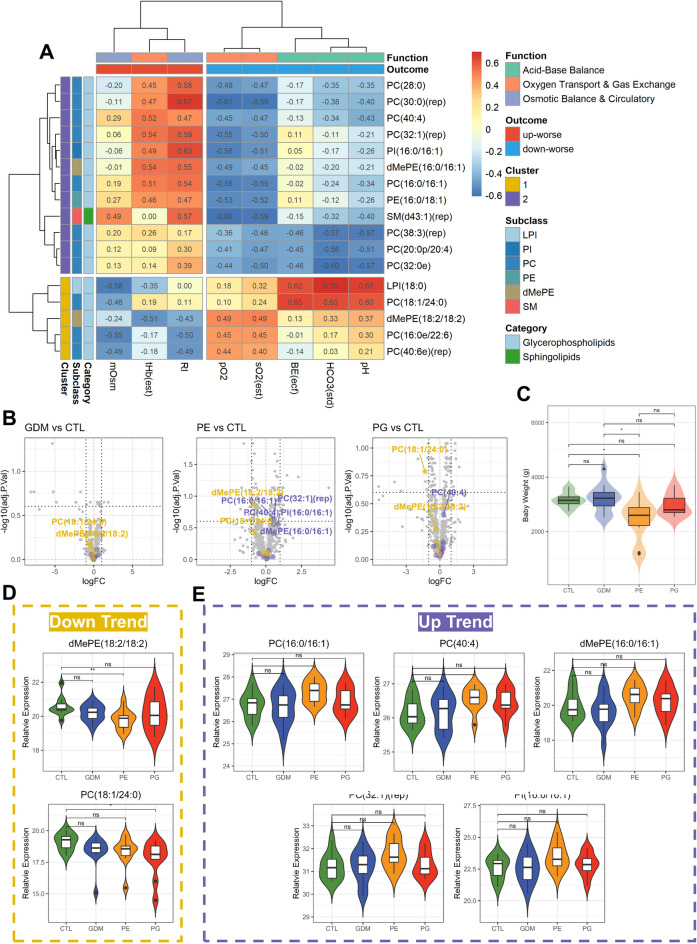
Gestational diabetes mellitus (GDM) and preeclampsia (PE) are common pregnancy complications, with the rising incidence of GDM and the pronounced heterogeneity of PE leading to an increased prevalence of their coexistence, presenting a unique and complex clinical condition. However, the disease characteristics and maternal-neonatal outcomes of this comorbidity remain largely unknown. In this study, we collected peripheral blood samples from 42 pregnant women, including pregnant controls without complications (Control, n = 10), GDM (n = 12), PE (n = 10), and those with coexistence of GDM and PE (PG, n = 10), as well as partial neonatal cord blood samples. Through integrated lipidomic and transcriptomic analyses, we identified distinct lipid and gene expression features associated with PG state and explored their correlations with clinical maternal characteristics and neonatal outcomes. Our findings indicate that PE and PG groups exhibit more pronounced lipidomic alterations, which are associated with adverse neonatal outcomes, while GDM and PG groups show more significant transcriptomic changes related to maternal neuronal and immune dysfunction, potentially increasing the risk of postpartum depression (PD). The elevated risk of PD was further supported by independent analyses of the UK Biobank and FinnGen cohorts. Despite the limitation of a modest sample size, the study provides evidence that subclinical alterations in maternal peripheral blood lipidomic and transcriptomic profiles, along with aberrations in cord blood gas (CBG) parameters, may exert adverse effects on both maternal and neonatal health. These findings highlight the need for further mechanistic and longitudinal investigations to elucidate the underlying pathophysiological processes.

Keywords: Gestational diabetes mellitus; Lipidomics; Neonatal outcomes; Preeclampsia; Transcriptomics.


Conflict of interest statement

Declarations. Competing interests: The authors declare no competing interests.

Figures

Fig. 1
Fig. 1
Study overview and design. (A) Schematic representation of the study flow chart. (B) Diagram showing the Study design and experimental workflow.
Fig. 2
Fig. 2
Lipidomics data analysis. (A) PCA plot of lipidomics data, colored by pregnancy complication groups: CTL (green), GDM (blue), PE (orange) and PG (red). (B) Pie chart showing the percentage distribution of major lipid categories based on the763 identified lipids. (C) Volcano plots displaying DELs between GDM, PE, and PG groups and the CTL group. Up-regulated lipids (FDR < 0.25 & log2(FC) > 0) are shown in red and down-regulated lipids (FDR < 0.25 & log2(FC) < 0) are shown in blue. (D) Bubble plots illustrating subclasses of DELs identified in (C). (E) Heatmap of scaled median lipid expression levels within each group, with an additional cutoff of |log2(FC)| > 1 to identify 43 DELs with higher confidence. Hierarchical clustering was performed using the ward.D2 method based on correlation distance.
Fig. 3
Fig. 3
Correlation of lipid profiles with CBG parameters. (A) Heatmap showing lipids significantly correlated with CBG parameters (pearson correlation, p-value < 0.05). The parameters are grouped into:1) Osmotic Balance and Circulatory (mOsm and RI); 2) Oxygen Transport and Gas Exchange (tHb(est), pO2 and sO2(est)) and 3) Acid-Base Balance (BE(ecf), HCO3-(std) and pH). mOsm: milliosmoles, tHb(est): total hemoglobin (estimated), RI: respiratory index, pO2: partial pressure of oxygen, sO2(est): estimated oxygen saturation, BE(ecf): base excess of extracellular fluid, HCO3-(std): standard bicarbonate concentration, pH: potential of hydrogen. Lipid clusters are indicated as Cluster 1 (gold) and Cluster 2 (purple), where reduced levels in Cluster 1 and elevated levels in Cluster 2 are associated with worse outcomes. (B) Volcano plots highlighting significantly correlated lipids from Cluster 1 (down-worse, gold) and Cluster 2 (up-worse, purple). (C) Violin plot showing birth weight distributions across the four groups. (D and E) Violin plots displaying the expression levels of lipids associated with adverse birth outcome: (D) upregulated and (E) downregulated. Statistical significance was determined using the Wilcoxon rank test (*: p-value < 0.05 and ns: non-significant).
Fig. 4
Fig. 4
Construction of a generalized PE predictive model applicable to PG. (A) Venn diagram showing eight overlapping DELs between the PE and PG groups. (B) Table summarizing the ROC analysis for the eight DELs, including their AUC values and 95% CI. (C) ROC curves for the eight DELs, showing their predictive performance. (D) Scatter plots demonstrating the positive correlation between the PLRS and SBP/DBP, with correlation coefficients (R) and p-values indicated. (E) Box plot showing PLRS distribution across the four groups. Statistical significance between groups were assessed using the Wilcoxon test (****: p-value < 0.0001, ***: p-value < 0.001, **: p-value < 0.01 and ns: non-significant).
Fig. 5
Fig. 5
Transcriptomic data analysis. (A) PCA plot of RNA-seq data colored by pregnancy complications groups: CTL (green), GDM (blue), PE (orange) and PG (red). (B) Volcano plots displaying DEGs between GDM, PE, and PG groups and CTL. Up-regulated genes (FDR < 0.25 and log2(FC) > 0) are shown in red and down-regulated genes (FDR < 0.25 and log2(FC) < 0) are shown in blue. (C) Heatmap showing scaled median expression levels of 776 DEGs for protein coding function across all groups, clustered into six distinct gene clusters. Hierarchical clustering was performed using ward.D2 method based on correlation distance. (D) Bar plots displaying the selected significantly enriched pathways (FDR < 0.1) for each DEG cluster. (E) Violin plots showing expression levels of previously reported genes that associated with GDM and PE. (F) Violin plots highlighting novel DEGs identified in this study as being specifically associated with GDM, PE, or PG. Statistical significance was assessed using the Wilcoxon test (**: p-value < 0.01, *: p-value < 0.5 and ns: non-significant).
Fig. 6
Fig. 6
Association of transcriptomic data with adverse birth outcomes and maternal defects. Heatmap displaying scaled median values of blood gas parameters across the four groups. Hierarchical clustering was performed using the ward.D2 method based on correlation distance. (B) Trend plots showing the fitted trends of blood gas parameters across the four groups, with colors representing different function categories of the parameters. (C) Enlarged heatmap highlighting genes Cluster 4, which is specifically up-regulated in the PG group. (D) Violin plots showing the expression levels of genes associated with muscle weakness (SPSB2 and LRRC56), neuronal defects (PDZD4 and GFRA2), and birth outcomes (TTN and MPO). Statistical significance was determined using the Wilcoxon test (*: p-value < 0.5 and ns: non-significant). (E) Forest plot summarizing the association between GDM, PE, PG and PD using data from in the UKB and FinnGen databases. Results are presented as odds ratios (OR) with 95% CI (UKB) and hazard ratios (HR) with 95% CI (FinnGen), along with p-values.

Similar articles

References

    1. McElwain, C. J., Tuboly, E., McCarthy, F. P. & McCarthy, C. M. Mechanisms of endothelial dysfunction in Pre-eclampsia and gestational diabetes mellitus: windows into future cardiometabolic health? Front. Endocrinol. (Lausanne). 11, 655 (2020). - PMC - PubMed
    1. Chorell, E. et al. Pregnancy to postpartum transition of serum metabolites in women with gestational diabetes. Metabolism72, 27–36 (2017). - PubMed
    1. Jiang, L. et al. A global view of hypertensive disorders and diabetes mellitus during pregnancy. Nat. Rev. Endocrinol.18 (12), 760–775 (2022). - PMC - PubMed
    1. Xie, Y., Zhou, W., Tao, X., Lv, H. & Cheng, Z. Early gestational blood markers to predict preeclampsia complicating gestational diabetes mellitus. Diabetes Metab. Syndr. Obes.16, 1493–1503 (2023). - PMC - PubMed
    1. Diboun, I. et al. Metabolic profiling of pre-gestational and gestational diabetes mellitus identifies novel predictors of pre-term delivery. J. Transl Med.18 (1), 366 (2020). - PMC - PubMed

LinkOut - more resources