. 2025 Jul 25;15(1):27094.
doi: 10.1038/s41598-025-12839-1.

The role of glucocorticoids in hepatocellular carcinoma through integrated bioinformatics analysis and experimental validation

Affiliations

The role of glucocorticoids in hepatocellular carcinoma through integrated bioinformatics analysis and experimental validation

Ao Wang et al. Sci Rep. .

Abstract

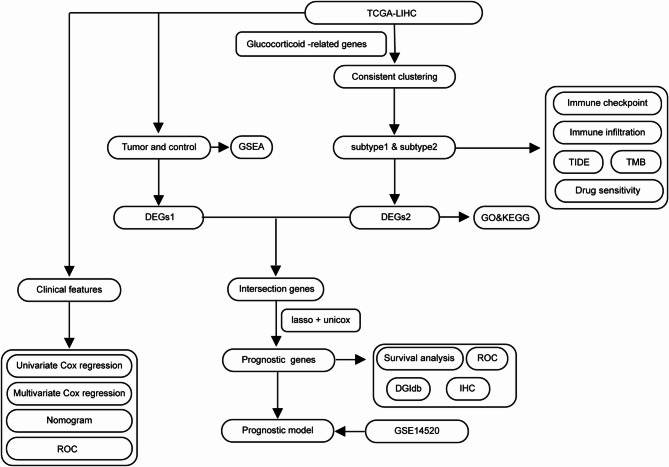
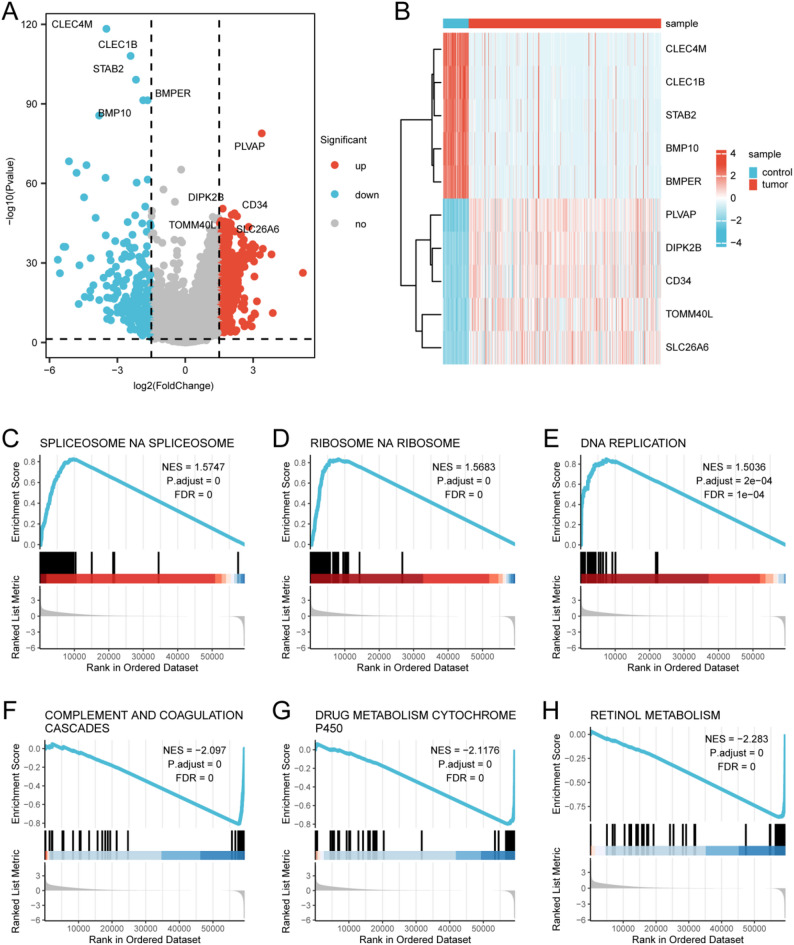
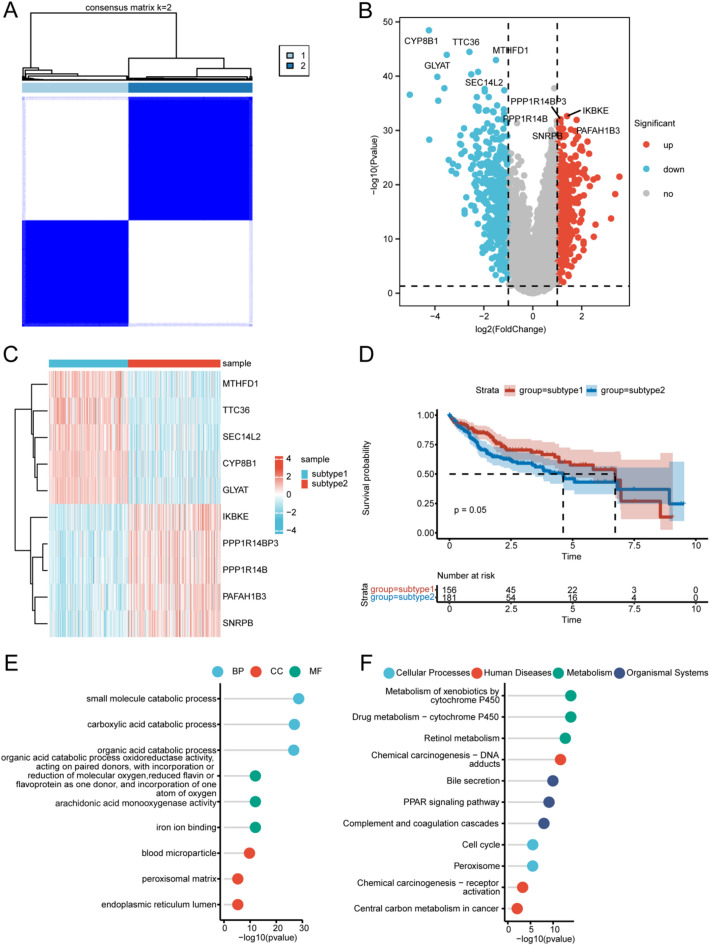
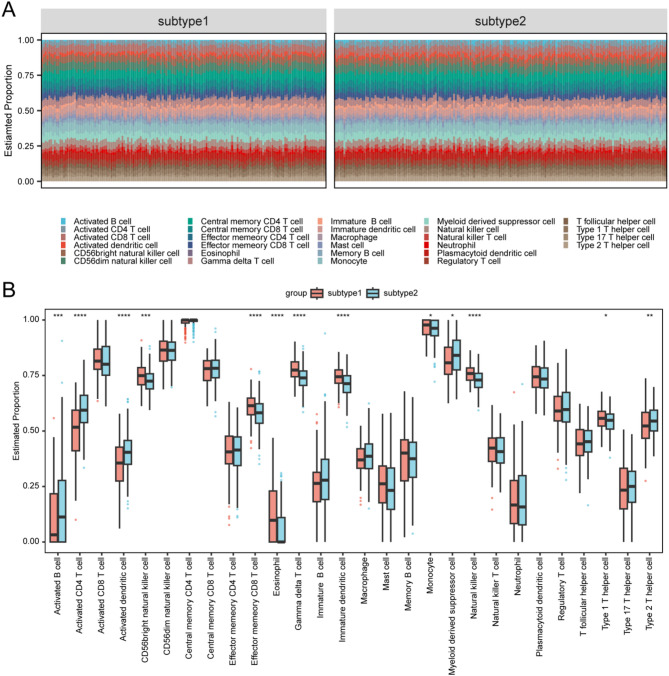
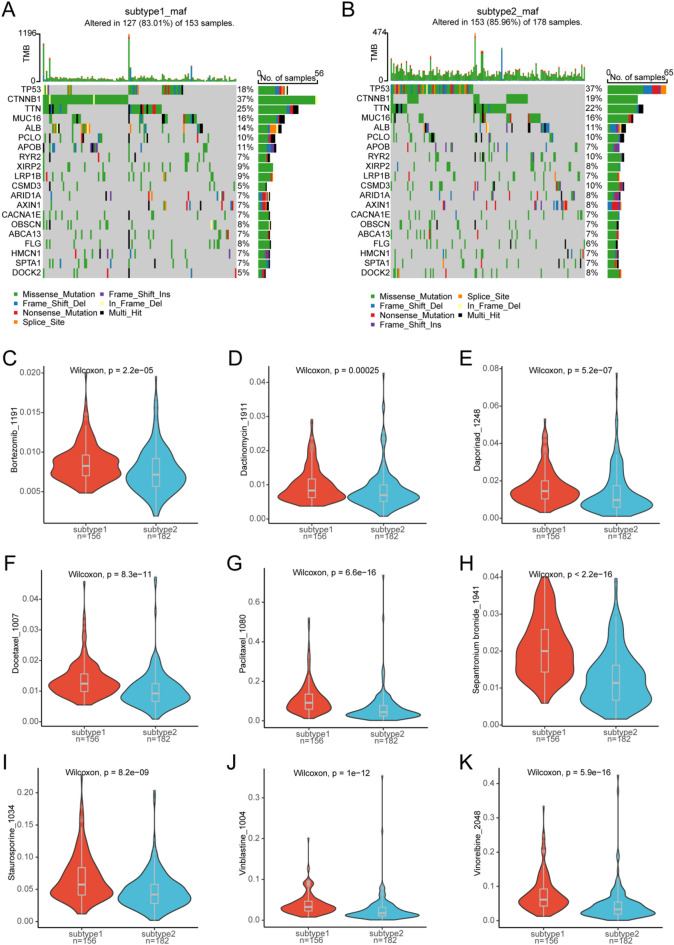
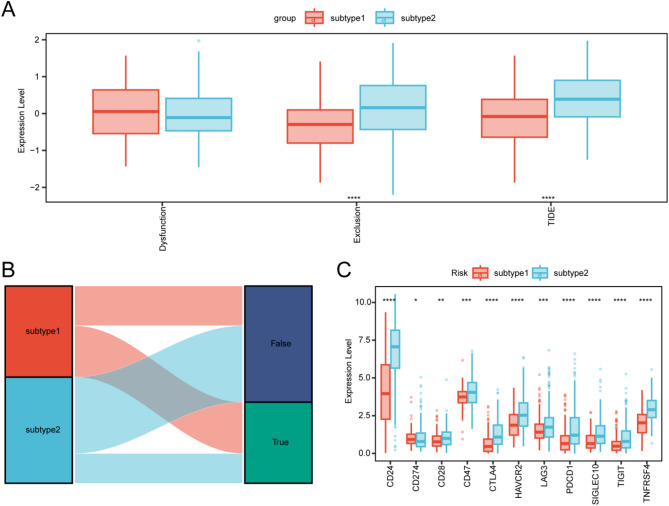
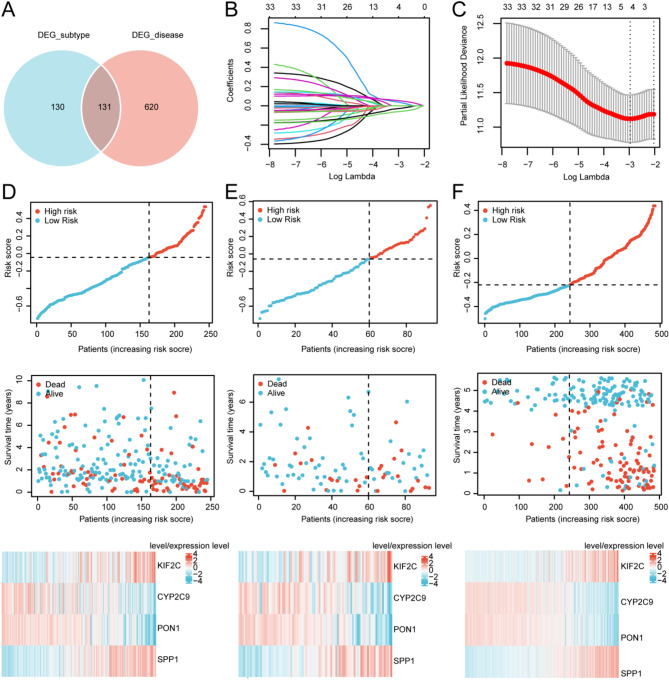
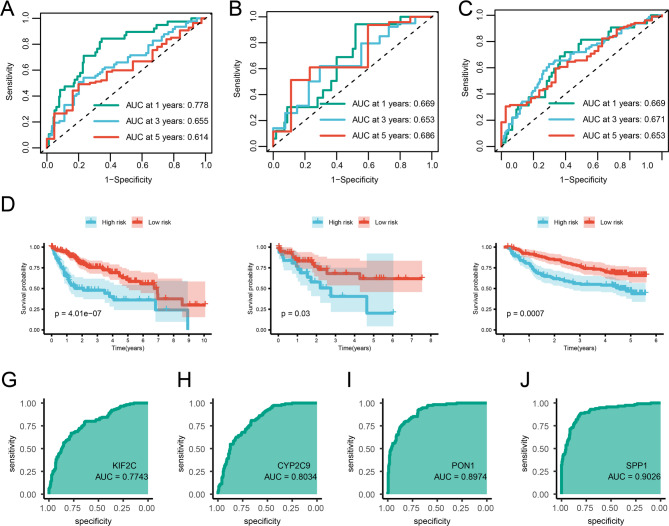
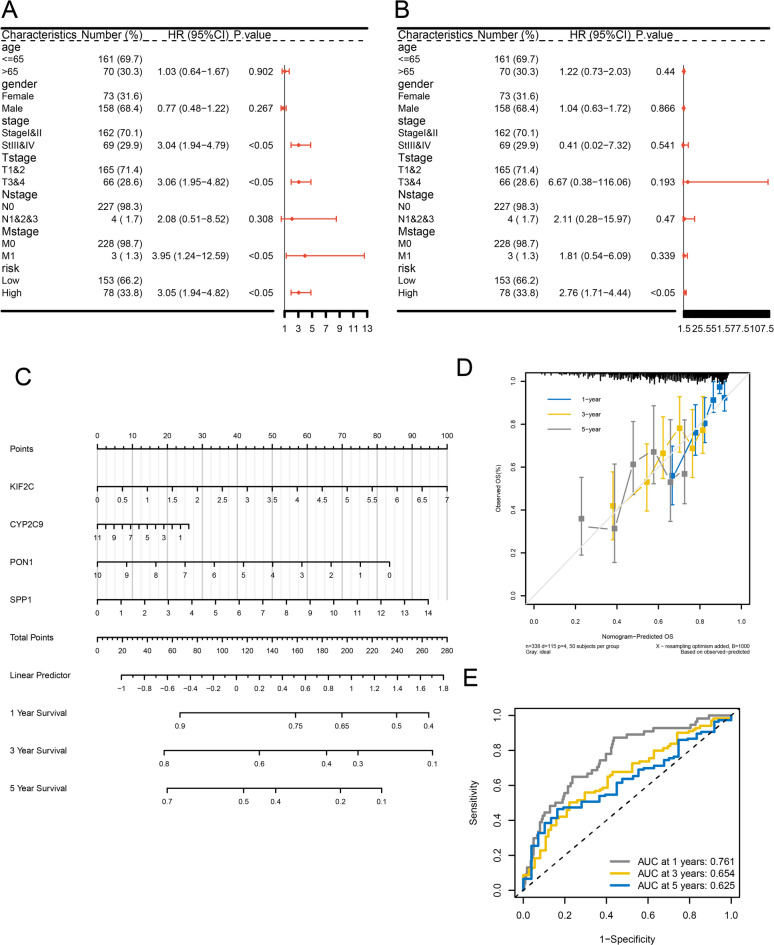
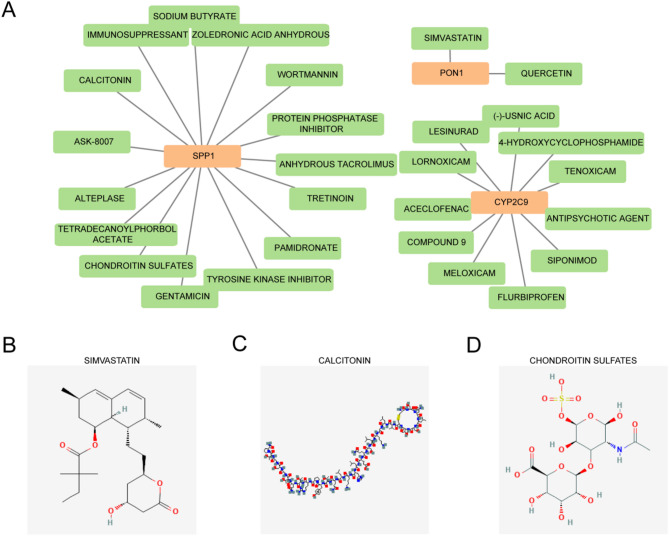
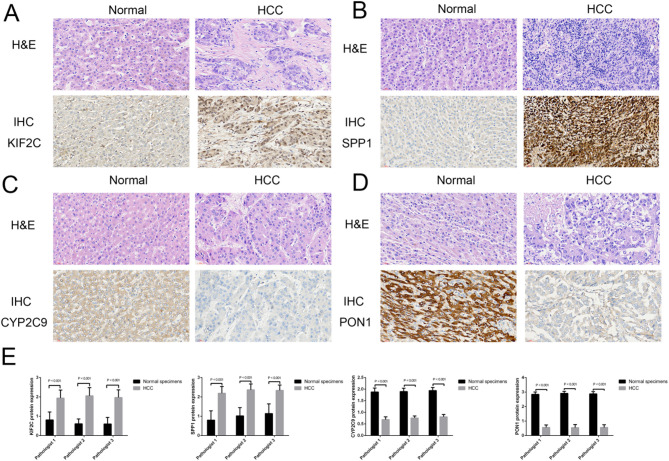
The most widespread primary liver cancer around the world is hepatocellular carcinoma (HCC), and its rising incidence and mortality rates are major challenges for public health. This study investigates the role of glucocorticoids in HCC, focusing on their associated phenotypic genes and their impact on patient prognosis. Utilizing comprehensive bioinformatics approaches, a total of 751 differentially expressed genes were identified, with 470 showing increased expression and 281 showing decreased expression in tumor samples. Gene set enrichment analysis (GSEA) indicated that tumor samples showed significant enrichment in spliceosome, ribosome, and DNA replication pathways, while control samples were enriched in complement and coagulation cascades and drug metabolism pathways. Furthermore, based on glucocorticoid-related genes, consensus clustering categorized HCC samples into two subtypes, with subtype 2 exhibiting poorer prognosis. Immune infiltration analysis indicated significant differences in various immune cell types between the two subtypes, suggesting potential immune evasion mechanisms. Drug sensitivity analysis from the Genomics of Drug Sensitivity in Cancer (GDSC) database revealed that subtype 2 patients may be more responsive to certain drugs, such as Bortezomib and Dactinomycin. Furthermore, based on the established prognostic model, a total of four genes (KIF2C, CYP2C9, PON1, SPP1) were identified. These genes are both glucocorticoid-related receptors and closely associated with the development of hepatocellular carcinoma, and they have reliable diagnostic and prognostic value. DGIdb drug prediction shows that a variety of drugs and compounds can target these four genes. Finally, immunohistochemistry revealed that in contrast to normal liver tissues, KIF2C and SPP1 were highly expressed in tumor tissues, while CYP2C9 and PON1 were expressed at lower levels in tumor tissues. This study highlights the importance of glucocorticoid-related genes in the development and prognosis of HCC, providing insights for future experimental validation and clinical applications.

Keywords: Bioinformatics; Glucocorticoid-related genes; Glucocorticoids; Hepatocellular carcinoma; Prognostic genes.


Conflict of interest statement

Declarations. Competing interests: The authors declare no competing interests.

Figures

Fig. 1
Fig. 1
The study’s process flow.
Fig. 2
Fig. 2
Analysis of differences between umor and control groups and GSEA enrichment. A The differences in gene distribution between tumor and control samples are represented by volcanic maps. Gene expression levels are shown by red, blue, and gray dots, indicating up-regulation, down-regulation, and no significant change, respectively. B Five up-regulated and five down-regulated genes, each with high P values, are represented in the heat map. GSEA analysis showed that SPLICEOSOME (C), RIBOSOME (D), DNA_REPLICATION (E) were significantly enriched in tumor group. The control group had a significant enrichment of Complem_and_coagulation_cascades (F), DRUG_METABOLISM_CYTOCHROME_P450 (G), RETINOL_METABOLISM (H).
Fig. 3
Fig. 3
Based on glucocorticoid-related genotyping, differential expression analysis and enrichment analysis. A Consensus cluster maps based on sample typing of glucocorticoid-associated genes. B Volcano maps describing the distribution of differential genes between subtype2 and subtype1 samples. Red, blue, and gray dots indicate gene expression levels associated with up-regulated, down-regulated, and no significant expression, respectively. C Five genes with increased expression and five with decreased expression, both having high P values, were represented in heat maps. D KM survival curve between subtypes. E Differential gene GO enrichment analysis among various subtypes. F Differential gene KEGG enrichment analysis among various subtypes.
Fig. 4
Fig. 4
Evaluation of immune infiltration in Subtype1 compared to Subtype2. A Stack diagram of estimated proportions of subtype1 to subtype2 of immune cells in TCGA tumor samples. B Estimated differences in the proportion of immune cell infiltration between subtypes.
Fig. 5
Fig. 5
Analysis of TMB and drug sensitivity among subtypes. A In the subtype1 group, the top 20 genes exhibit the highest mutation rates and B in the subtype2 group, the top 20 genes exhibit the highest mutation rates. Bortezomib_1191 (C), Dactinomycin_1911 (D), IDaporinad_1248 (E), Docetaxel_1007 (F), Paclitaxel_1080 (G), Se between subtype1 and subtype2 groups Drug sensitivity differences of pantronium bromide_1941 (H), Staurosporine_1034 (I), Vinblastine_1004 (J) and Vinorelbine_2048 (K).
Fig. 6
Fig. 6
Intersubtype immunotherapy response (TIDE) and immune checkpoint analysis. A The TIDE prediction algorithm assessed differences in immunotherapy response between subtypes. B TIDE prediction algorithm to evaluate immunotherapy response between subtypes. C The expression of immune checkpoints among subtypes is depicted using box plots.
Fig. 7
Fig. 7
In TCGA-LIHC, Cox and LASSO regression analysis was conducted for the creation and validation of a prognostic model. A Venn diagram of intersecting genes. B LASSO regresses the change trajectory of the independent variable. The logarithm of the independent variable lambda is plotted on the abscissa, and the coefficient that is independently available is represented on the vertical axis. C Each lambda in LASSO regression has a confirmation interval. D Risk triptych for the training cohort. E Risk triplets for validation of the cohort. F Risk triplets for external validation queues. The high-risk group is indicated by red, while the low-risk group is indicated by blue.
Fig. 8
Fig. 8
Survival curve and ROC curve of prognostic model and ROC curve of prognostic gene. A Training cohort’s ROC curve. B Verify the queue’s ROC curve. C External validation queue’s ROC curve. D Training cohort’s Kaplan–Meier survival curve. E Validation set’s K–M survival curve. F External validation set’s Kaplan–Meier survival graph. G KIF2C’s ROC curve. H CYP2C9’s ROC curve. I PON1’s ROC curve. J SPP1’s ROC curve.
Fig. 9
Fig. 9
Univariate COX and multivariate COX results and validation. A Combining clinical information with risk scores in forest maps through univariate Cox analysis. B Combining clinical information with risk scores in a multivariate Cox analysis of forest maps. C A nomogram of the forecast model. Clinical factors’ impact on the outcome event is shown by the line segments, each variable value’s individual scores are summed to form the total score, and each value point’s 1-, 3-, and 5-year survival prognosis is depicted by the bottom three lines. D Calibration curves for the nomogram model at 1, 3, and 5 years. E ROC curves for the nomogram model at 1, 3, and 5 years.
Fig. 10
Fig. 10
Drug prediction of prognostic genes. A mRNA-drugs interaction network of prognostic genes. The green rectangles are drugs and the orange rectangles are prognostic genes. Two-dimensional structures of SIMVASTATIN (B), CALCITONIN (C), CHONDROITIN SULFATES (D).
Fig. 11
Fig. 11
Validation of prognostic genes expression in clinical sample by IHC. A Visual representation of KIF2C expression through IHC in HCC and normal tissues. B Visual representation of SPP1 expression through immunostaining in HCC and normal tissues. C Visual representation of CYP2C9 expression through immunostaining in HCC and normal tissues. D Visual representation of PON1 expression through immunostaining in HCC and normal tissues. E The levels of KIF2C and SPP1 proteins were upregulated in HCC; the levels of CYP2C9 and PON1 proteins were lower in HCC; N = 10 per group (All the P values were less than 0.001).

Similar articles

References

    1. Siegel, R. L., Giaquinto, A. N. & Jemal, A. Cancer statistics, 2024. CA Cancer J. Clin.74, 12–49. 10.3322/caac.21820 (2024). - PubMed
    1. Gujarathi, R., Klein, J. A., Liao, C. Y. & Pillai, A. The changing demographics and epidemiology of hepatocellular carcinoma. Clin. Liver Dis.29, 1–15. 10.1016/j.cld.2024.08.001 (2025). - PubMed
    1. Vogel, A., Meyer, T., Sapisochin, G., Salem, R. & Saborowski, A. Hepatocellular carcinoma. Lancet400, 1345–1362. 10.1016/s0140-6736(22)01200-4 (2022). - PubMed
    1. Singal, A. G., Kanwal, F. & Llovet, J. M. Global trends in hepatocellular carcinoma epidemiology: implications for screening, prevention and therapy. Nat. Rev. Clin. Oncol.20, 864–884. 10.1038/s41571-023-00825-3 (2023). - PubMed
    1. Vutien, P., Kim, N. J. & Nguyen, M. H. The diagnosis and staging of hepatocellular carcinoma: a review of current practices. Clin. Liver Dis.29, 33–48. 10.1016/j.cld.2024.08.007 (2025). - PubMed

MeSH terms