Comparative Study
. 2025 Jul 26;15(1):27263.
doi: 10.1038/s41598-025-12873-z.

Comparative and pharmacological investigation of bEVs from eight Lactobacillales strains

Affiliations
Comparative Study

Comparative and pharmacological investigation of bEVs from eight Lactobacillales strains

Seoah Park et al. Sci Rep. .

Abstract

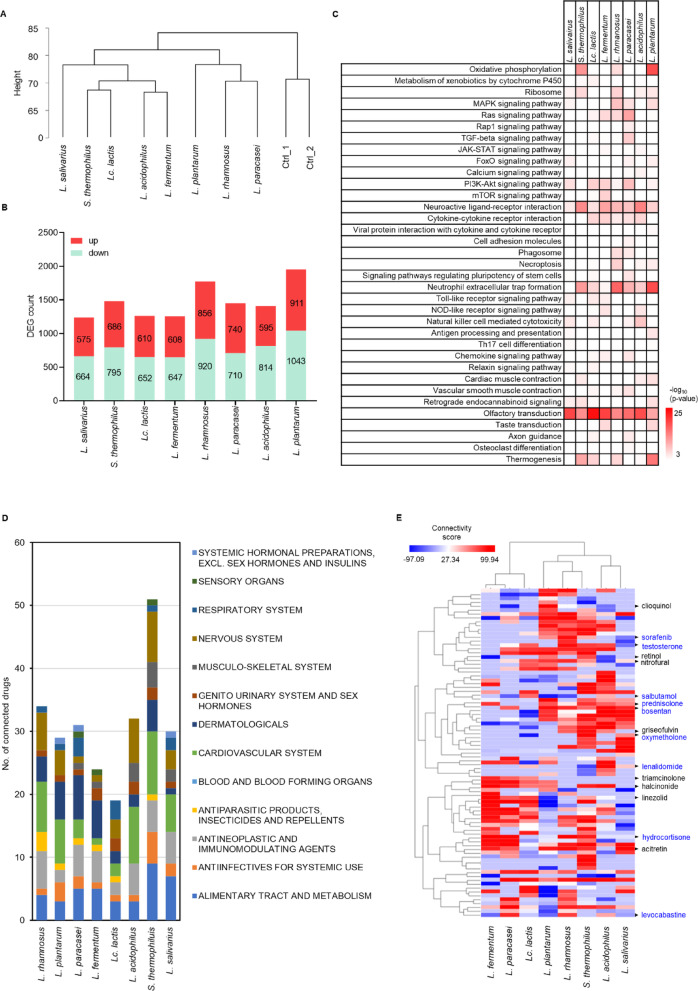
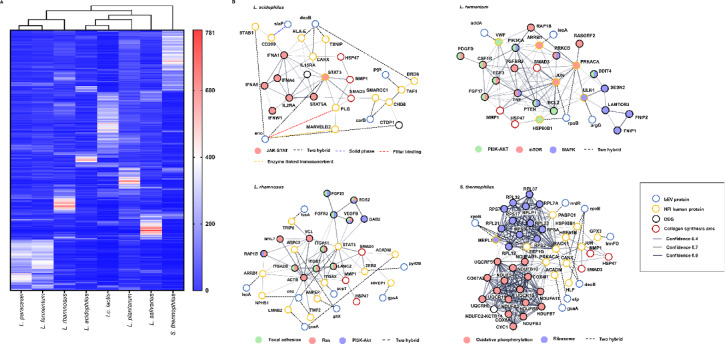
Bacterial extracellular vesicles (bEVs) have therapeutic potential by mimicking the effects of the microbiome. Here, we characterized bEVs from eight gram-positive Lactobacillales strains, evaluating their therapeutic potential. In primary characterization, Lactobacillus paracasei produced the largest bEVs (82.5 nm), while Lactococcus lactis yielded the highest number (3.2 × 10⁹ particles/mL). Lactobacillus plantarum had the highest protein content (0.124 pg/particle), while Lactobacillus salivarius had the greatest lipid content (16.3 µg/particle). Lipid content significantly influenced cytotoxicity in HEK293T cells (r² = 0.366, p = 0.037). Connectivity Map (CMap) analysis revealed correlations between bEVs from Lactobacillus rhamnosus, Lactobacillus fermentum, Lactobacillus acidophilus, and Streptococcus thermophilus and approved drugs for skin health. Experimentally, these bEVs enhanced collagen synthesis in fibroblasts by up to 1.25-fold (p < 0.001). Proteomic analysis identified distinct protein sets for each bEV. Further analysis demonstrated interaction networks between bEV proteins and human proteins that promote collagen production through the JAK-STAT, PI3K-AKT, and focal adhesion pathways. In conclusion, this study highlights the strain-specific characteristics and therapeutic potential of bEVs in promoting collagen production, presenting a novel approach to discovering new indications for bEVs in potential skin care applications.

Keywords: Collagen; Skin health; Therapeutic indications; bEV; bEV-host interaction.


Conflict of interest statement

Declarations. Competing interests: H.-M.Y., H.-J.A., G.-H.C., Y.-S.L., K.-J.K., S.-J.C., and S.-J.K. are employees of HK inno.N. The remaining authors state that they have no conflicts of interest.

Figures

Fig. 1
Fig. 1
Strain-wide characterization of bEVs. A. bEV size distribution and yield. The 3D graph depicts bEV secretion by the bacterial strain. X-axis: bEV diameter (nm), y-axis: bEV strain, z-axis: total bEV yield. B. Protein content of each bEV. C. Lipid content of each bEV. D. bEV morphology by TEM. Scale bar = 100 nm. E. Protein profile and LTA expression of each bEV. The upper panel shows Coomassie blue-stained protein profiles of bEVs, and the lower panel presents LTA expression levels. M: molecular weight marker, E: bEV, C: cell lysate. F. Correlations of bEV protein and lipid contents with cytotoxicity. X-axis: MTD of bEVs; y-axis: lipid amount (left) and protein amount in bEVs (right). G. bEV uptake in KEL FIB cells. Immunofluorescence images of cells show PKH26-labeled bEVs in red, actin in green, and nuclei in blue. Ctrl: vehicle control. Scale bar = 20 μm. The graph results depict bEV uptake efficiency (top) and the correlation between bEV size and uptake (bottom). The data are presented as the means ± SDs; n = 11, ap < 0.05 vs. L. rhamnosus, bp < 0.05 vs. S. thermophilus, cp < 0.05 vs. L. plantarum; one-way ANOVA followed by Dunnett’s test.
Fig. 2
Fig. 2
Identification of putative indications for bEVs. A. Hierarchical clustering of the bEV-induced transcriptome. The dendrogram presents clustering results inferred from the Euclidean distance between bEV-induced transcriptomes. B. bEV-induced DEGs. Each stacked bar represents the number of genes upregulated (red) or downregulated (green) by bEVs. Fold change cutoff = 1.5. C. KEGG pathway enrichment analysis. The heatmap depicts the log-transformed p values of KEGG pathways enriched with bEV-induced DEGs. D. CMap analysis of bEVs. The stacked bar shows the number of drugs classified at ATC level 1 connected to each bEV. The indications of ATC level 1 drugs are presented by color on the right side of the graph. E. Hierarchical clustering of bEV-connected drugs. The heatmap represents the connectivity scores between bEVs and drugs, ranging from 99.98 (red) to -97.09 (blue). Drugs in black text indicate skin health therapeutics, and drugs in blue text indicate nonskin health therapeutics.
Fig. 3
Fig. 3
Enhanced collagen production by bEVs. A. Collagen staining in bEV-treated NIH3T3 cells. Collagen is stained with Sirius Red. Scale bar = 200 μm. B. Collagen quantification in NIH3T3 cells. C. Dose-dependent collagen production in NIH3T3 cells by selected bEVs. The extracted and quantified Sirius Red is shown on the left, and the amount of collagen is measured by ELISA on the right. D. Collagen synthesis and key molecules involved in collagen homeostasis in NIH3T3 cells. TGF-β is used as a positive control. E: Collagen staining in bEV-treated LX-2 cells. Scale bar = 200 μm. F: Collagen quantification in LX-2 cells. G. Dose-dependent collagen production in LX-2 cells by selected bEVs. H. Collagen synthesis and homeostasis axis activity in LX-2 cells. H, M, and L indicate high, middle, and low concentrations of bEVs, respectively, corresponding to three times, one time, and one-third of MTD. The data are presented as the means ± SDs; n = 3 ~ 8; *p < 0.05. **p < 0.01, ***p < 0.001 vs. vehicle control (Ctrl), one-way ANOVA followed by Dunnett’s test.
Fig. 4
Fig. 4
Molecular mechanisms of bEV proteins in collagen synthesis. A. Hierarchical clustering of bEV proteins. The dendrogram presents clustering results inferred from the Euclidean distance between bEV proteins. The heatmap represents the abundances of total bEV proteins from 0 (blue) to 781 (red). B. Interacting networks of bEV proteins with their human counterparts for collagen synthesis. bEV proteins are depicted as blue empty circles, human proteins interacting with bEV proteins are depicted as yellow empty circles, collagenogenic pathway-enriched bEV-induced DEGs are depicted as black empty circles, and proteins in the collagen synthesis axis are depicted as red empty circles. Each filled circle represents a collagenogenic pathway regulated by bEVs, and the dashed lines represent the experimental methods used to determine the interaction of bEV proteins with human proteins. The solid lines indicate the confidence of protein interactions on the basis of their thickness.

References

    1. Zhang, K. & Cheng, K. Stem cell-derived exosome versus stem cell therapy. Nat. Rev. Bioeng. 1–2. 10.1038/s44222-023-00064-2 (2023). - PMC - PubMed
    1. Jin, Y., Li, S., Yu, Q., Chen, T. & Liu, D. Application of stem cells in regeneration medicine. MedComm (2020). 4, e291. 10.1002/mco2.291 (2023). - PMC - PubMed
    1. Pinho, A. G., Cibrao, J. R., Silva, N. A., Monteiro, S. & Salgado, A. J. Cell secretome: basic insights and therapeutic opportunities for CNS disorders. Pharmaceuticals (Basel). 13. 10.3390/ph13020031 (2020). - PMC - PubMed
    1. Joseph, A. et al. Mesenchymal stem cell-conditioned media: A novel alternative of stem cell therapy for quality wound healing. J. Cell. Physiol.235, 5555–5569. 10.1002/jcp.29486 (2020). - PubMed
    1. Muthu, S., Bapat, A., Jain, R., Jeyaraman, N. & Jeyaraman, M. Exosomal therapy-a new frontier in regenerative medicine. Stem Cell. Investig. 8, 7. 10.21037/sci-2020-037 (2021). - PMC - PubMed

Publication types

LinkOut - more resources