. 2025 Aug;26(8):1287-1298.
doi: 10.1038/s41590-025-02217-4. Epub 2025 Jul 25.

Genetic variation in the activity of a TREM2-p53 signaling axis determines oxygen-induced lung injury

Affiliations

Genetic variation in the activity of a TREM2-p53 signaling axis determines oxygen-induced lung injury

Yohei Abe et al. Nat Immunol. 2025 Aug.

Abstract

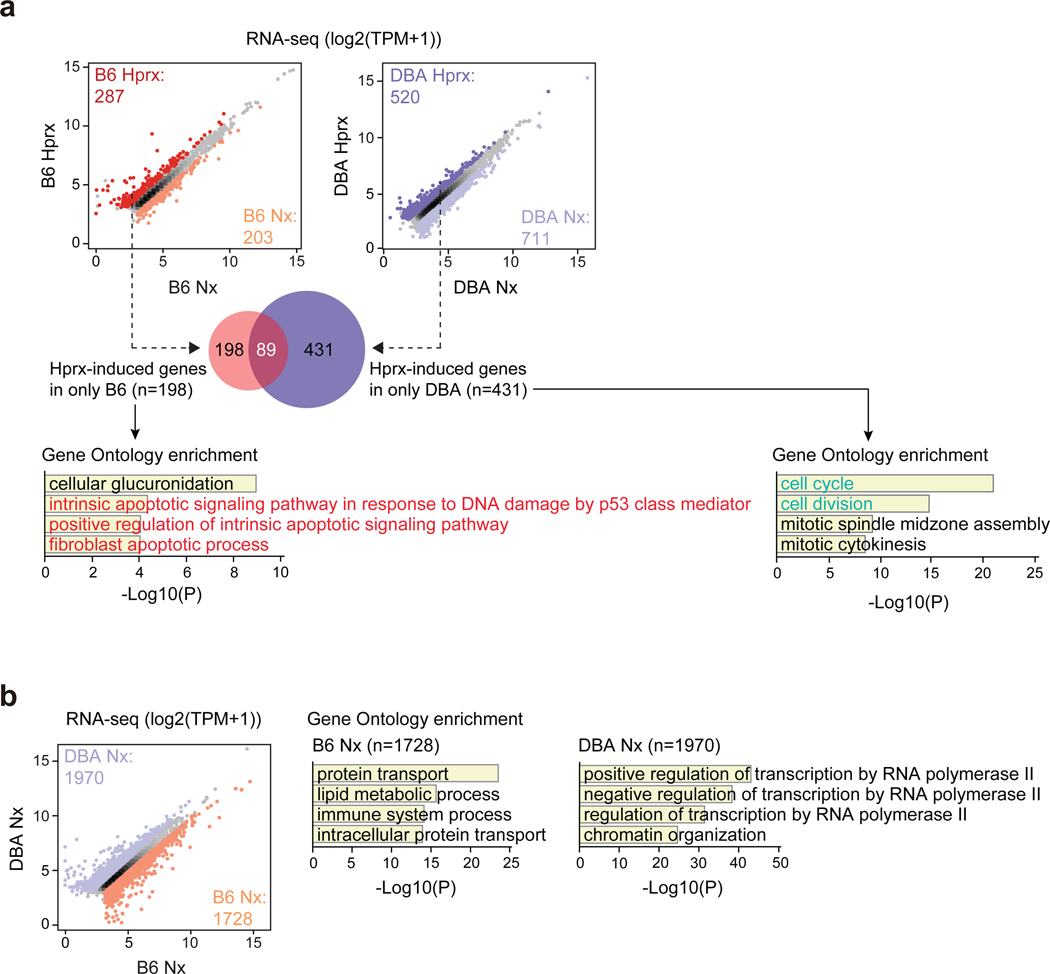
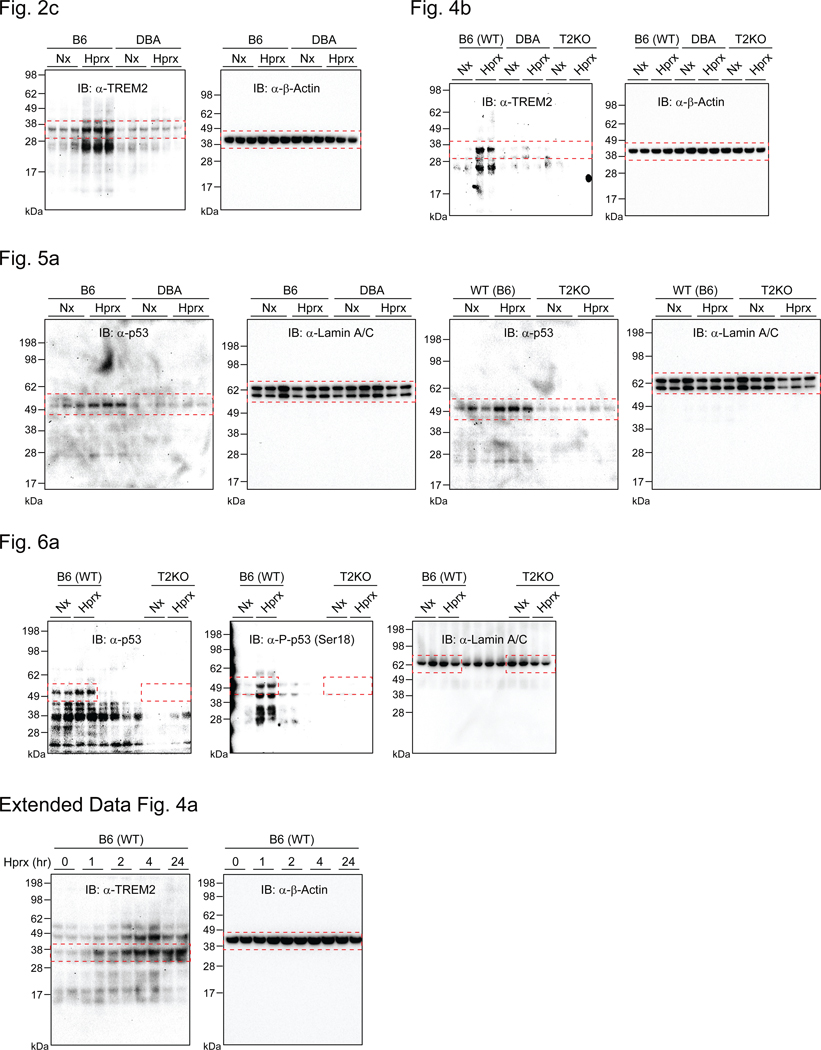
Bronchopulmonary dysplasia is a common complication of preterm birth, driven in part by the inflammatory effects of supplemental oxygen on the immature lung. Although oxygen therapy is essential, it contributes to disrupted lung development but not all infants are equally susceptible. Using genetically diverse mouse models, we found that hyperoxia-sensitive mice exhibit a distinct innate immune response compared to resilient strains. Notably, the hyperoxia-sensitive C57BL/6J strain showed selective upregulation of TREM2 on lung macrophages and monocytes. Deletion of TREM2 in myeloid cells led to reduced inflammation, preserved alveolar structure and sustained cell proliferation in the developing lung following oxygen exposure. Mechanistically, TREM2 loss limited p53 activation, favoring cell-cycle arrest over apoptosis. These results identify TREM2 as a key driver of immune-mediated lung injury in neonatal hyperoxia and suggest it may be a promising therapeutic target for preventing or treating bronchopulmonary dysplasia in vulnerable preterm infants.


Conflict of interest statement

Competing interests: The authors declare no competing interests.

Figures

Extended Data Fig. 1.
Extended Data Fig. 1.. Lung transcriptomic differences between B6 and DBA mice following neonatal hyperoxia and at baseline.
(a) Scatterplots of RNA-seq data in whole lung tissues showing differences in hyperoxia-induced genes in B6 and DBA mice. The left panel (same as Fig. 1e) shows the hyperoxia-regulated genes in B6 mice and right panel shows hyperoxia-regulated genes in DBA mice. Dark red dots in left panel: significant hyperoxia-induced genes in B6 mice, light red dots in left panel: significant hyperoxia-suppressed genes in B6 mice, dark purple dots in right panel: significant hyperoxia-induced genes in DBA mice, light purple dots in right panel: significant hyperoxia-suppressed genes in DBA mice (FC > 1.5; FDR < 0.05). Venn diagram shows the overlap between hyperoxia-induced genes in B6 (n = 287) and hyperoxia-induced genes in DBA mice (n = 520). Gene Ontology enrichment analysis of the 198 genes uniquely induced in B6 or 431 genes uniquely induced in DBA by hyperoxia. (b) Scatterplot of RNA-seq data in whole lung tissues showing baseline differences in gene expression between B6 and DBA mice (FC > 1.5; FDR < 0.05). Gene Ontology enrichment analysis of 1728 genes enriched in the lungs of B6 mice, and 1970 genes enriched in the lungs of DBA mice.
Extended Data Fig. 2.
Extended Data Fig. 2.. Hyperoxia induces Trem2 in lung macrophages and monocytes; Trem2 knockout mice are protected from injury and show reduced inflammation.
(a) Gene Ontology enrichment analysis of hyperoxia-induced genes specific for alveolar macrophages and not shared with interstitial macrophages and classical monocytes. Data reanalyzed from previously published scRNA-seq data . P-values were calculated from hypergeometric distribution. (b) Gene Ontology enrichment analysis of hyperoxia-induced genes specific for interstitial macrophages and not shared with alveolar macrophages and classical monocytes. Data reanalyzed from previously published scRNA-seq data . P-values were calculated from hypergeometric distribution. (c) Gene Ontology enrichment analysis of hyperoxia-induced genes specific for classical monocytes and not shared with interstitial macrophages and alveolar macrophages. Data reanalyzed from previously published scRNA-seq data . P-values were calculated from hypergeometric distribution. (d) Venn diagram showing the overlap between hyperoxia-induced genes (FC > 2; FDR < 0.05) in 3 different myeloid cell subsets; alveolar macrophages (n = 281), interstitial macrophages (n = 275), classical monocytes (n = 215) (left panel). Venn diagram showing the overlap between hyperoxia-induced genes in the three myeloid cell subsets (n = 18) and whole lung tissues (n = 287 in Fig. 1e) (right panel). (e) SNPs in the Trem2 gene between B6 and DBA mice. (f) Body weight in hyperoxia-exposed WT (B6) (same samples as Fig. 1a) and T2KO mice. Data are mean ± SEM (n = 6 for each group). (g) Lung tissues were stained for DAPI (nuclei) and CD45 (pan-leukocyte marker) and the number of CD45-positive cells was quantified. Bar graphs represent the mean ± SEM (WT (B6) Nx, n = 4; WT (B6) Hprx, n = 3; T2KO Nx, n = 5; T2KO Hprx, n = 4). Statistical analysis was performed using one-way ANOVA followed by Tukey’s post hoc test. *p < 0.05 and **p < 0.01. (h) Flow cytometry analysis of lung immune cells in WT (B6) and T2KO mice. Top panel shows the gating strategy used to identify neutrophils and alveolar macrophages (AMs) within live CD45-positive immune cells. Left lower panel shows representative flow cytometry plots for neutrophil populations in lungs from WT (B6) and T2KO mice exposed to either hyperoxia or normoxia. The lower right panel shows representative plots for AMs within the non-neutrophil (CD45-positive, Ly6G-negative) population. Bar graphs quantify neutrophils and AMs as a percentage of total CD45-positive lung immune cells. Data are presented as mean ± SEM (n = 3 for each group). Statistical analysis was performed using one-way ANOVA followed by Tukey’s post hoc test. *p < 0.05 and **p < 0.01. (i) Architecture-defining parameters. Identification of top 5 individual matrix features associated with low pseudotime (normal-like interstitium) and high pseudotime (more aberrant interstitium), based on Pearson correlations. Parameters are displayed as the absolute value of the Pearson coefficient (i.e. magnitude of correlation, as shown by height of arrows on y-axis), with all p < 0.001.
Extended Data Fig. 3.
Extended Data Fig. 3.. Neonatal hyperoxia triggers distinct gene expression responses in sensitive B6 mice versus resistant T2KO and DBA mice.
(a) Scatterplots of RNA-seq data from whole lung tissues showing hyperoxia-regulated gene expression in WT (B6) and T2KO mice. The left panel shows genes significantly regulated by hyperoxia in WT (B6) mice. Dark red dots indicate genes significantly upregulated by hyperoxia; light red dots indicate genes significantly downregulated (FC >2; FDR < 0.05). The right panel shows a comparison of hyperoxia-induced genes between WT (B6) and T2KO mice. Dark red dots represent genes significantly downregulated in T2KO mice; dark blue dots represent genes significantly upregulated in T2KO mice (FC > 2; FDR < 0.05). The Venn diagram illustrates the lack of overlap between hyperoxia-induced genes in T2KO mice and hyperoxia-suppressed genes in WT mice. (b) Principal component analysis (PCA) of RNA-seq in whole lung tissues from B6 (WT), DBA and T2KO mice.
Extended Data Fig. 4.
Extended Data Fig. 4.. Time course of hyperoxia-induced Trem2 expression in BMDMs and differential gene expression in B6, T2KO, and DBA BMDMs.
(a) Immunoblots of TREM2 protein in whole cell lysates of hyperoxia-exposed (1, 2, 4 or 24 h) BMDMs obtained from B6 (WT) mice and normoxic controls (0 h). Data are representative of two experiments. Uncropped images of the blots are shown in Extended Data Fig. 7. (b) Venn diagram showing the overlap between hyperoxia-induced genes in B6 (WT) BMDMs (n = 173) and hyperoxia-suppressed genes in T2KO (n = 570) and DBA (n = 905) BMDMs. Gene Ontology analysis and KEGG pathway analysis were performed on the 386 genes commonly suppressed by hyperoxia in both T2KO and DBA BMDMs, which are not induced in B6 (WT) by hyperoxia.
Extended Data Fig. 5.
Extended Data Fig. 5.. Number of hyperoxia-induced p53 ChIP-seq peaks in the lungs of B6, DBA, and T2KO mice, and genomic distribution of p53 peaks in B6.
(a) Total number of p53 ChIP-seq peaks in whole lung tissues. (b) Distribution of hyperoxia-induced p53 ChIP-seq peaks (n=53) in whole lung tissues of B6 (WT) mice.
Extended Data Fig. 6.
Extended Data Fig. 6.. p53 phosphorylation sites and hyperoxia-induced p53 ChIP-seq peaks in BMDMs from B6, and T2KO mice, with genomic distribution of peaks in B6.
(a) Mouse and human p53 protein amino acid sequences. (b) Total number of p53 ChIP-seq peaks in BMDMs. (c) Distribution of hyperoxia-induced p53 ChIP-seq peaks (n=252) in BMDMs of B6 (WT) mice. (d) Venn diagram showing the intersection of hyperoxia-induced genes in BMDMs of B6 (WT) (n = 173, FC < 1.5; FDR < 0.05, Fig. 4d) and 236 genes found near p53 ChIP-seq peaks (n = 252, Fig. 6b) in BMDMs of B6 (WT) mice.
Extended Data Fig. 7.
Extended Data Fig. 7.. Uncropped immunoblot images.
Uncropped immunoblot images for Fig. 2c, Fig. 4b, Fig. 5a, Fig. 6a and Extended Data Fig. 4a.
Fig. 1.
Fig. 1.. Strain differences in neonatal hyperoxia-induced lung injury.
(a) Neonatal C57BL/6J (B6) and DBA/2J (DBA) mice were exposed to 75% oxygen (Hyperoxia) from P0 to P14 and harvested at P14 for analysis. Littermate controls raised in room air (21% oxygen, Normoxia) were served as controls. Body weights in hyperoxia-exposed B6 and DBA mice. Data are mean ± SEM (n=6 for each group). (b) H&E staining was performed on formalin fixed paraffin embedded lungs to assess the alveolar complexity at P14 in B6 mice (left panels) and DBA mice (right panels) with scale bars denoting 100 μm. The bar graph represents the results of the quantification of alveolar simplification using mean linear intercept. Data are mean ± SEM (B6 Nx, n = 4; B6 Hprx, n = 4; DBA Nx, n = 6; DBA Hprx, n = 6). ANOVA was performed followed by Tukey’s post hoc comparison. **p < 0.01 and ***p < 0.001. (c) Bronchoalveolar lavage (BAL) was performed at P14 in hyperoxia-exposed B6 and DBA mice, and the control mice. Data are mean ± SEM (B6 Nx, n = 7; B6 Hprx, n = 7; DBA Nx, n = 7; DBA Hprx, n = 8). ANOVA was performed followed by Tukey’s post hoc comparison. *p < 0.05. n.s.: not significant. (d) RNA-seq in whole lung tissues of B6 and DBA mice at P14. Heatmap shows the 6201 differentially expressed genes (FC > 1.5; p-adj < 0.05) comparing hyperoxia-exposed B6 and DBA mice, and the normoxic controls (B6 Nx, n = 2; B6 Hprx, n = 3; DBA Nx, n = 4; DBA Hprx, n = 4). (e) Scatterplots of RNA-seq data in whole lung tissues showing hyperoxia-regulated gene expression in B6 mice (left panel) and DBA mice-regulated gene expression in the hyperoxic conditions (right panel). Dark red dots in left panel: significant hyperoxia-induced genes in B6 mice, light red dots in left panel: significant hyperoxia-suppressed genes in B6 mice, dark red dots in right panel: significant DBA mice-suppressed genes in the hyperoxic conditions, dark purple dots in right panel: significant DBA mice-induced genes in the hyperoxic conditions (FC > 1.5; FDR < 0.05). Venn diagram shows the overlap between hyperoxia-induced genes in B6 mice (n = 287) and hyperoxia-suppressed genes in DBA mice (n = 1320). (f) KEGG pathway (left panel) and Gene Ontology enrichment (right panel) analysis of the 97 genes that were induced in B6 mice and suppressed in DBA mice by hyperoxia. P-values were calculated from hypergeometric distribution. (g) Bar plots for expression of representative genes belonging to the p53 signaling pathway. Data are mean ± SEM. **p-adj < 0.01 and ***p-adj < 0.001 reported by DESeq2 using the Benjamini–Hochberg method for the multiple-testing correction (B6 Nx, n = 2; B6 Hprx, n = 3; DBA Nx, n = 4; DBA Hprx, n = 4). Each dot represents one mouse. (h) Caspase 3 activity measured in cytosolic fractions from whole lung tissues (B6 and DBA mice) harvested on P14. Data are mean ± SEM (n=3 for each group). ANOVA was performed followed by Tukey’s post hoc comparison. *p < 0.05 and **p < 0.01. (i) Bar plots for expression of representative genes belonging to the cell proliferation pathway. Data are mean ± SEM. ***p-adj < 0.001 reported by DESeq2 using the Benjamini–Hochberg method for the multiple-testing correction (B6 Nx, n = 2; B6 Hprx, n = 3; DBA Nx, n = 4; DBA Hprx, n = 4). Each dot represents one mouse (b, c, g, h, i). See also Extended Data Fig. 1.
Fig. 2.
Fig. 2.. Trem2 deletion in myeloid cells protects the developing lung from neonatal hyperoxia-induced injury.
(a) Single-cell RNA-seq analysis of whole lung tissues from B6 mice exposed to 95% oxygen from P0 to P5. (b) Trem2 mRNA expression in the lungs of B6 and DBA mice. Bar graphs show mean ± SD (B6 Nx, n = 2; B6 Hprx, n = 3; DBA Nx, n = 4; DBA Hprx, n = 4). ***p-adj < 0.001 reported by DESeq2 using the Benjamini–Hochberg method for the multiple-testing correction. n.s.: not significant. (c) Immunoblots for TREM2 protein in whole lung tissues collected on P14 from B6 and DBA mice. Bar graphs show mean ± SEM (n = 3 for each group). ANOVA was performed followed by Tukey’s post hoc comparison. *p < 0.05 and **p < 0.01. Uncropped images of the blots are shown in Extended Data Fig. 7. (d) H&E staining was performed to assess the alveolar complexity at P14 in WT (B6) mice (left panels) and T2KO mice (right panels) with scale bars denoting 100 μm. The bar graph represents the results of the quantification of alveolar simplification using mean linear intercept. Data are mean ± SEM (WT (B6) Nx, n = 4; WT (B6) Hprx, n = 4; T2KO Nx, n = 7; T2KO Hprx, n = 7). ANOVA was performed followed by Tukey’s post hoc comparison. ***p < 0.001. (e) Bronchoalveolar lavage (BAL) was performed at P14 in WT (B6) and T2KO hyperoxia-exposed and normoxic control mice (WT (B6) Nx, n = 7; WT (B6) Hprx, n = 7; T2KO Nx, n = 11; T2KO Hprx, n = 13). ANOVA was performed followed by Tukey’s post hoc comparison. *p < 0.05. n.s.: not significant. (f) Representative images of H&E stained bronchoalveolar lavage (BAL) cytospins from WT (B6) (left panels) and T2KO (right panels) mice are shown; scale bars = 20 μm. The bar graph quantifies the proportion of each cell type in mice exposed to hyperoxia versus normoxic controls. Data are presented as mean ± SEM (WT (B6) Nx, n = 4; WT (B6) Hprx, n = 4; T2KO Nx, n = 5; T2KO Hprx, n = 5). Statistical analysis was performed using Student’s t-test (two-sided). *p < 0.05 and ***p < 0.001. n.s., not significant. (g) Matrix ultrastructural analysis of lung tissues of neonatal hyperoxia-exposed B6 (WT), DBA and T2KO mice on P14. Manifold of hyperoxia-induced pathological architecture with higher pseudotime representing increasingly disrupted architecture and alveolar simplification. Tissue images show representative tiles along the pseudotime trajectory. (h) Visualization of hyperoxia-exposed and normoxic control lung tissues of B6 (WT), DBA and T2KO mice. Hyperoxia-exposed lungs from DBA and T2KO mice with less lung matrix remodeling localize near the root point of the pseudotime trajectory. (i) Bar graphs of matrix pseudotime for hyperoxia-exposed and normoxic control lung tissues of B6 (WT), DBA and T2KO mice. The difference in pseudotime normalized to normoxic control lungs is shown. Data are mean ± SEM (WT (B6) Nx, n = 3; WT (B6) Hprx, n = 3; DBA Nx, n = 4; DBA Hprx, n = 4; T2KO Nx, n = 4; T2KO Hprx, n = 3). ANOVA was performed followed by Tukey’s post hoc comparison. *p < 0.05. n.s.: not significant. Each dot represents one mouse (b, c, d, e, f, i). See also Extended Data Fig. 2.
Fig. 3.
Fig. 3.. Apoptosis and cell proliferation related gene programs are differentially activated in the lungs of WT (B6) and Trem2 deficient (T2KO) mice.
(a) RNA-seq in whole lung tissues of WT (B6) and T2KO mice at P14. Heatmap shows the 756 differentially expressed genes (FC > 2; p-adj < 0.05) comparing hyperoxia-exposed WT and T2KO mice with the normoxic controls (B6 Nx, n = 4; B6 Hprx, n = 3; T2KO Nx, n = 4; T2KO Hprx, n = 4). (b) Scatterplots of RNA-seq data from whole lung tissues showing hyperoxia-regulated gene expression in WT (B6) and T2KO mice. Left panel displays genes significantly regulated by hyperoxia in WT (B6) mice. Dark red dots indicate genes significantly upregulated by hyperoxia; light red dots indicate genes significantly downregulated (FC > 2; p-adj < 0.05). The right panel shows a comparison of hyperoxia induced genes between WT (B6) and T2KO mice. Dark red dots represent genes significantly downregulated in T2KO mice; dark blue dots represent genes significantly upregulated T2KO mice (FC > 2; p-adj < 0.05). The Venn diagram shows the overlap between hyperoxia-induced genes in WT mice (n = 253) and hyperoxia-suppressed genes in T2KO mice (n = 125). (c) KEGG pathway (left panel) and Gene Ontology enrichment (right panel) analysis of the 90 genes that were induced in WT and suppressed in T2KO by hyperoxia. P-values were calculated from hypergeometric distribution. (d) Bar plots for expression of representative genes belonging to the p53 signaling pathway. Data are mean ± SEM. DSeq2 was used for comparisons. **p-adj < 0.01 and ***p-adj < 0.001 reported by DESeq2 using the Benjamini–Hochberg method for the multiple-testing correction (B6 Nx, n = 4; B6 Hprx, n = 3; T2KO Nx, n = 4; T2KO Hprx, n = 4). (e) Caspase 3 activity measured in cytosolic fractions from whole lung tissues from B6 and T2KO mice harvested on P14. Data are mean ± SEM (n = 3 for each group). ANOVA was performed followed by Tukey’s post hoc comparison. *p < 0.05. (f) Lung tissues were stained for DAPI and CC3 and the number of CC3 positive cells was counted. Bar graphs show mean ± SEM (WT (B6) Nx, n = 5; WT (B6) Hprx, n = 5; T2KO Nx, n = 6; T2KO Hprx, n = 5). ANOVA was performed followed by Tukey’s post hoc comparison. *p < 0.05 and **p < 0.01. (g) Bar plots for expression of representative genes belonging to the cell proliferation pathway. Data are mean ± SEM. DSeq2 was used for comparisons. *p-adj < 0.05 and ***p-adj < 0.001 reported by DESeq2 using the Benjamini–Hochberg method for the multiple-testing correction (B6 Nx, n = 4; B6 Hprx, n = 3; T2KO Nx, n = 4; T2KO Hprx, n = 4). (h) Bar plots for expression of representative inflammatory genes. Data are mean ± SEM. DSeq2 was used for comparisons. ***p-adj < 0.001 reported by DESeq2 using the Benjamini–Hochberg method for the multiple-testing correction (B6 Nx, n = 4; B6 Hprx, n = 3; T2KO Nx, n = 4; T2KO Hprx, n = 4). Each dot represents one mouse (d, e, f, g, h). See also Extended Data Fig. 3.
Fig. 4.
Fig. 4.. In vitro hyperoxia exposure (95% oxygen) of bone marrow-derived macrophages (BMDMs) increases TREM2 expression.
(a) BMDMs were obtained from B6 (WT), DBA and T2KO mice and exposed to hyperoxia (95%) for 24 h. (b) Immunoblots of TREM2 protein in whole cell lysates of hyperoxia-exposed BMDMs obtained from B6 (WT), DBA and T2KO mice and the normoxic controls. Data are representative of three independent experiments. Uncropped images of the blots are shown in Extended Data Fig. 7. (c) RNA-seq of hyperoxia-exposed BMDMs from B6 (WT), DBA and T2KO mice and the normoxic controls. Heatmap shows the 1827 differentially expressed genes (FC > 2; p-adj < 0.05). (d) Venn diagram showing the overlap between hyperoxia-induced genes in B6 (WT) BMDMs (n = 173) and hyperoxia-suppressed genes in T2KO (n = 570) and DBA (n = 905) BMDMs. Gene Ontology analysis was performed on the 34 genes that were induced by hyperoxia in B6 (WT) and suppressed in T2KO and DBA BMDMs. (e) Bar plots for expression of representative genes belonging to the p53 signaling pathway. Data are mean ± SEM. DSeq2 was used for comparisons. **p-adj < 0.01 and ***p-adj < 0.001 reported by DESeq2 using the Benjamini–Hochberg method for the multiple-testing correction (B6 Nx, n = 2; B6 Hprx, n = 2; DBA Nx, n = 2; DBA Hprx n = 2; T2KO Nx, n = 2; T2KO Hprx, n = 2). (f) Caspase 3 activity measured in cytosolic fractions from BMDMs from B6 (WT), DBA and T2KO mice. Data are mean ± SEM. (n = 4 for each group). ANOVA was performed followed by Tukey’s post hoc comparison. * p < 0.05. Each dot represents one mouse (e, f). See also Extended Data Fig. 4.
Fig. 5.
Fig. 5.. Divergent p53 protein expression and DNA binding pattern in WT (B6), DBA and T2KO mice.
(a) Immunoblots for p53 protein in the nuclear fraction from whole lung tissues of neonatal hyperoxia-exposed and control B6 and DBA mice (left panel) and WT (B6) and T2KO mice (right panel) harvested on P14. Data are mean ± SEM (n = 3 for each group). ANOVA was performed followed by Tukey’s post hoc comparison. *p < 0.05 and **p < 0.01. n.s.: not significant. (b) Boxplot for p53 ChIP-seq peaks in whole lung tissues from B6 (WT), DBA and T2KO mice. The 53 hyperoxia-induced peaks (FC > 2; p-adj < 0.05) in lungs of B6 (WT) mice were used for the analyses for DBA and T2KO mice. The boxplot shows the interquartile range and median of the data, the whiskers extend to the maximum and minimum of the data unless they exceed 1.5 time the interquartile range. Datapoints falling outside this range are shown as individual points. (c) Known motifs enriched in p53 ChIP-seq peaks in whole lung tissues using a GC-matched genomic background. (d) Venn diagram showing the intersection of hypoxia-induced genes in whole lung tissues of B6 (WT) mice (n = 253, FC < 2; FDR < 0.05, Fig. 3b) and genes found near p53 ChIP-seq peaks (n = 96, 25 kbp from TSS) in whole lung tissues of B6 (WT) mice. (e) Genome browser track showing p53 ChIP-seq peaks in the vicinity of the Cdkn1a and Trp53inp1 genes. Each dot represents one mouse (a, b). See also Extended Data Fig. 5.
Fig. 6.
Fig. 6.. Divergent p53 DNA binding pattern in BMDMs of B6 and T2KO mice.
(a) Immunoblots of total p53, phospho-p53 (Ser18), and Lamin A/C in the nuclear fraction of hyperoxia-exposed (24 h) BMDMs from WT and T2KO mice. Uncropped images of the blots are shown in Extended Data Fig. 7. (b) Boxplot for p53 ChIP-seq peaks in BMDMs from WT and T2KO mice. The 252 hyperoxia-induced peaks (FC > 2; p-adj < 0.05) in BMDMs of WT mice were used for the analyses for T2KO mice. The boxplot shows the interquartile range and median of the data, the whiskers extend to the maximum and minimum of the data unless they exceed 1.5 time the interquartile range. Datapoints falling outside this range are shown as individual points. (c) Venn diagram showing the overlap of hyperoxia-induced p53 ChIP-seq peaks in the lung tissues and BMDMs of WT mice. (d) Known motifs enriched in p53 ChIP-seq peaks in BMDMs using a GC-matched genomic background. (e) Genome browser track showing p53 ChIP-seq peaks in the vicinity of the Cdkn1a and Psrc1 genes. Each dot represents one mouse (b). See also Extended Data Fig. 6.

References

    1. Pryhuber GS et al. Prematurity and respiratory outcomes program (PROP): study protocol of a prospective multicenter study of respiratory outcomes of preterm infants in the United States. BMC pediatrics 15, 37 (2015). - PMC - PubMed
    1. Bell EF et al. Mortality, In-Hospital Morbidity, Care Practices, and 2-Year Outcomes for Extremely Preterm Infants in the US, 2013–2018. Jama 327, 248–263 (2022). - PMC - PubMed
    1. Budinger GR et al. Epithelial cell death is an important contributor to oxidant-mediated acute lung injury. American journal of respiratory and critical care medicine 183, 1043–1054 (2011). - PMC - PubMed
    1. Thebaud B et al. Bronchopulmonary dysplasia. Nat Rev Dis Primers 5, 78 (2019). - PMC - PubMed
    1. Collaco JM, Eldredge LC & McGrath-Morrow SA Long-term pulmonary outcomes in BPD throughout the life-course. Journal of perinatology : official journal of the California Perinatal Association (2024). - PubMed

Methods-only references

    1. Mascharak S et al. Preventing Engrailed-1 activation in fibroblasts yields wound regeneration without scarring. Science 372 (2021). - PMC - PubMed
    1. Mascharak S et al. Desmoplastic stromal signatures predict patient outcomes in pancreatic ductal adenocarcinoma. Cell Rep Med 4, 101248 (2023). - PMC - PubMed
    1. Ruifrok AC, Katz RL & Johnston DA Comparison of quantification of histochemical staining by hue-saturation-intensity (HSI) transformation and color-deconvolution. Appl Immunohistochem Mol Morphol 11, 85–91 (2003). - PubMed
    1. Ruifrok AC & Johnston DA Quantification of histochemical staining by color deconvolution. Anal Quant Cytol Histol 23, 291–299 (2001). - PubMed
    1. Wang L & Mao Q Probabilistic Dimensionality Reduction via Structure Learning. IEEE Trans Pattern Anal Mach Intell 41, 205–219 (2019). - PubMed

MeSH terms

LinkOut - more resources