. 2025 Aug;7(8):1630-1645.
doi: 10.1038/s42255-025-01330-w. Epub 2025 Jul 25.

The source of dietary fat influences anti-tumour immunity in obese mice

Affiliations

The source of dietary fat influences anti-tumour immunity in obese mice

Britta Kunkemoeller et al. Nat Metab. 2025 Aug.

Abstract

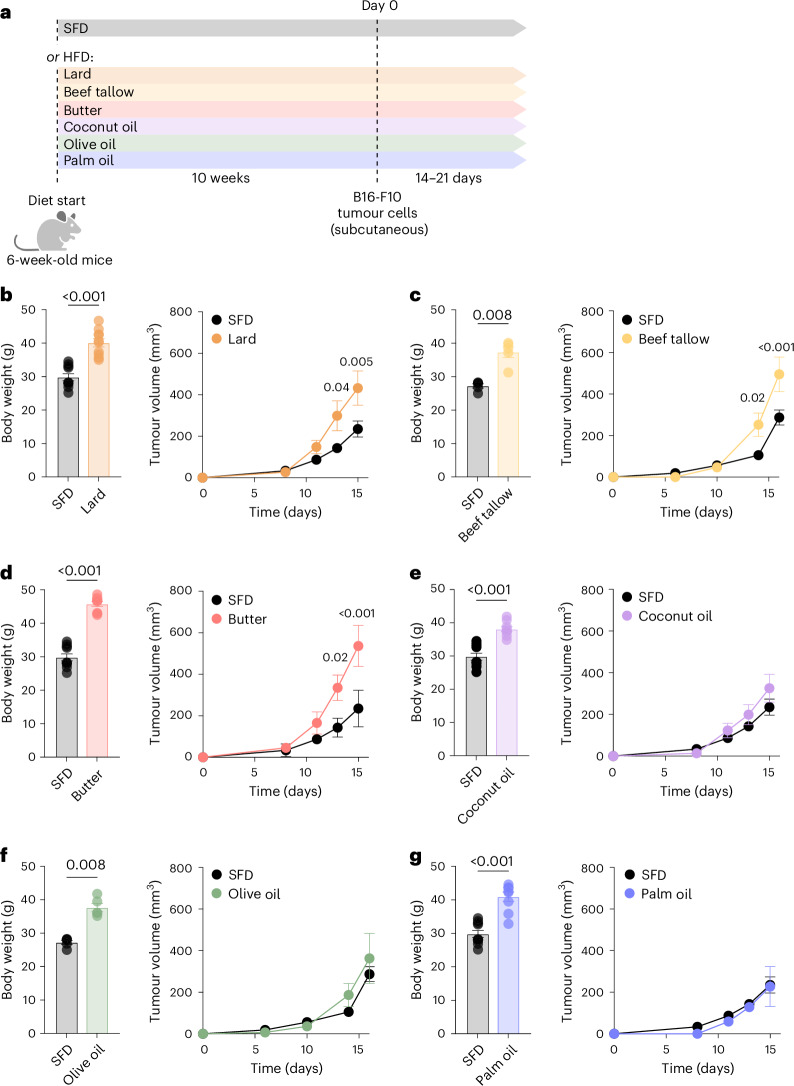
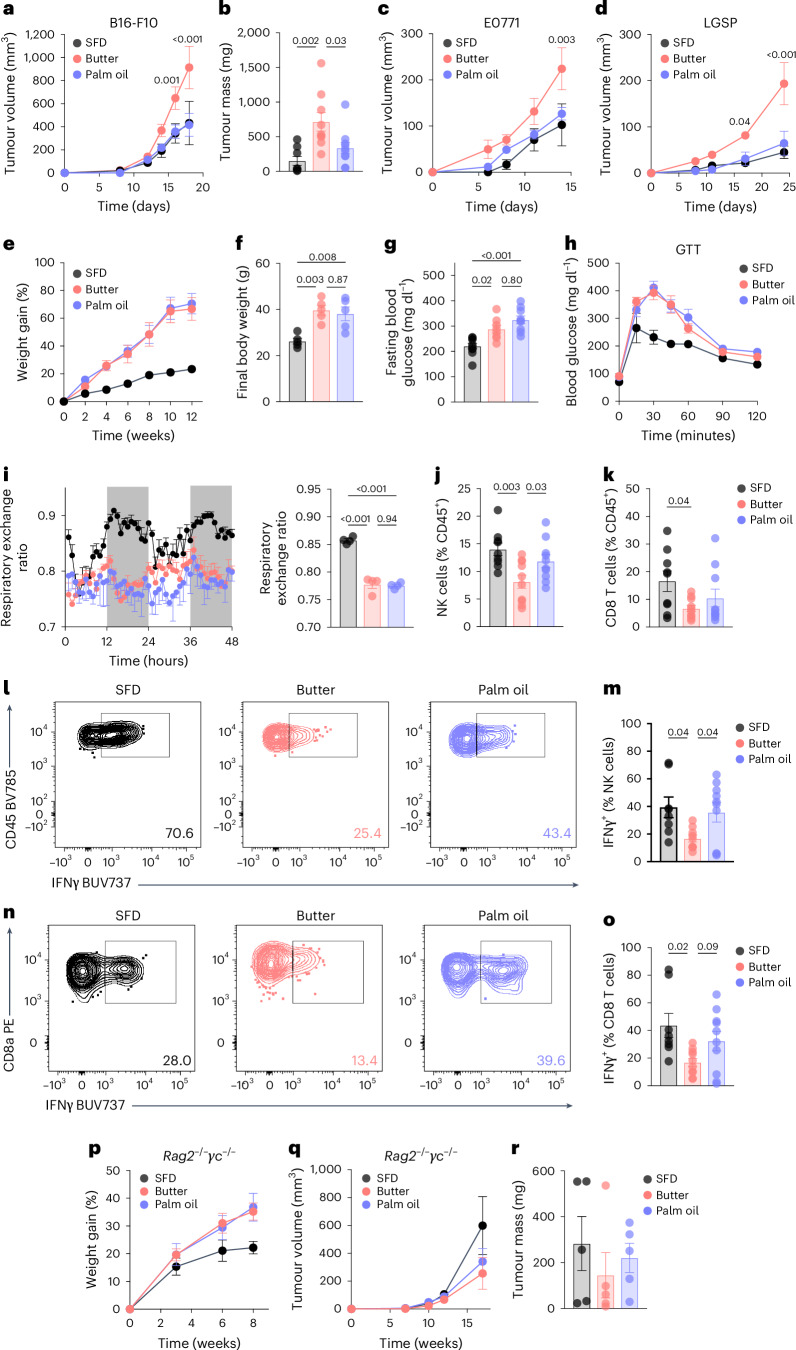
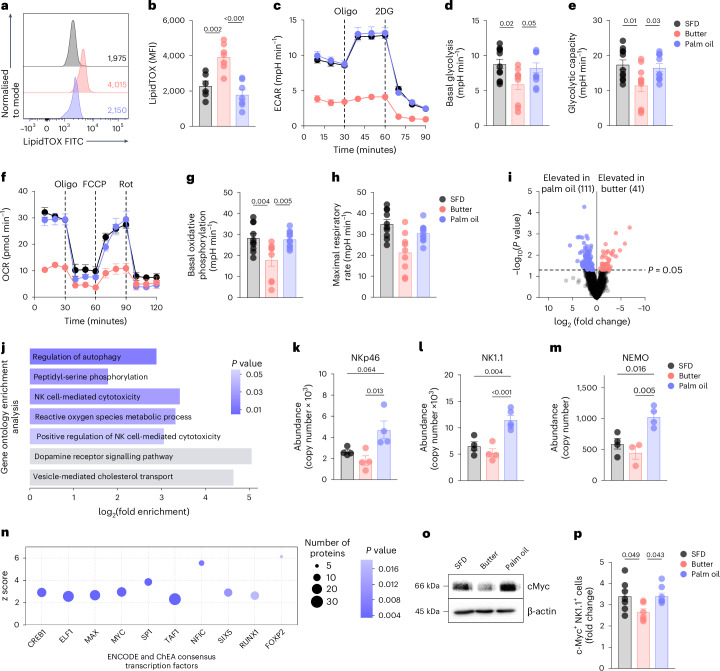
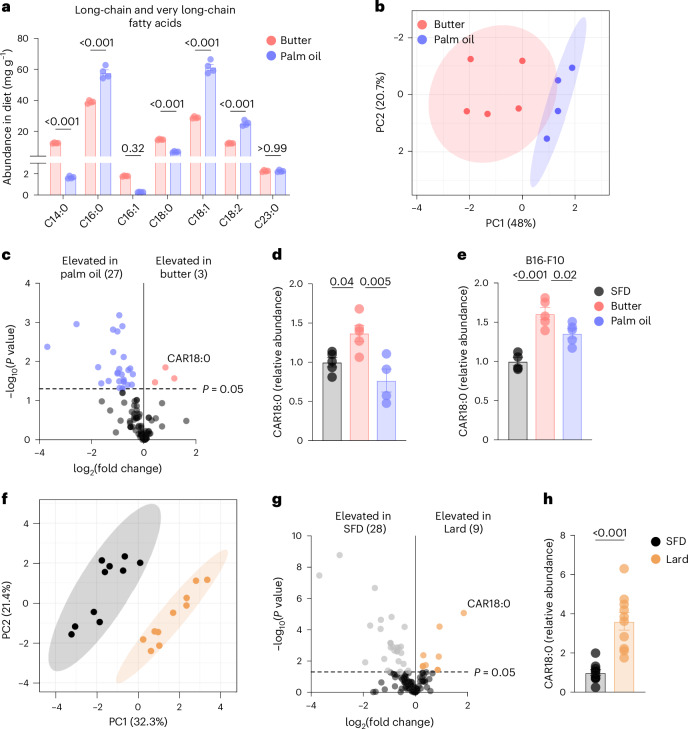
Obesity increases the risk of many cancers and impairs the anti-tumour immune response. However, little is known about whether the source or composition of dietary fat affects tumour growth or anti-tumour immunity in obesity. Here, we show that high-fat diets (HFDs) derived from lard, beef tallow or butter accelerate tumour growth in a syngeneic model of melanoma, but HFDs based on coconut oil, palm oil or olive oil do not, despite equivalent obesity. Using butter-based and palm oil-based HFDs as examples, we find that these dietary fat sources differentially regulate natural killer and CD8 T cell infiltration and function within the tumour microenvironment, governed by distinct effects on the plasma metabolome and intracellular metabolism. We identify diet-related lipid intermediates, namely long-chain acylcarnitine species, as immunosuppressive metabolites enriched in mice fed butter compared to palm oil HFD. Together, these results highlight the significance of diet in maintaining a healthy immune system and suggest that modifying dietary fat may improve cancer outcomes in obesity.


Conflict of interest statement

Competing interests: L.L. is a member of the scientific advisory board for MiNK Therapeutics, a consultant for Bayer and a member of the Scientific Advisory Board of Faeth Therapeutics and Deciduous Therapeutics. The interests of L.L. were reviewed and managed by the Brigham and Women’s Hospital in accordance with their conflict-of-interest policies. M.H. is a member of the Scientific Advisory Board of the MD Anderson Allison Institute. The other authors declare no competing interests.

Figures

Fig. 1
Fig. 1. Dietary fat source influences growth of B16 melanoma tumours in obesity.
a, Schematic of experimental design. bg, Body weight (left) and tumour volumes (right) of subcutaneous B16-F10 melanoma tumours in mice fed a SFD (13% fat) or HFD (45% fat) from various plant and animal fat sources for 12 weeks. HFDs were derived mostly from lard (b), beef tallow (c), butter (d), coconut oil (e), olive oil (f) or palm oil (g); n = 5, representative of three (b), two (c), four (d), three (e), two (f) and four (g) independent experiments. SFD control groups are the same in (b, d, e, g) and (c, f). In bar graphs, bar height represents the mean; error bars, s.e.m. In line graphs, each data point represents the mean; error bars, s.e.m. Comparisons were made using the two-tailed Mann–Whitney test (bg, left) or two-way repeated-measures ANOVA followed by Bonferroni’s multiple comparisons test (bg, right). Created in BioRender.com. Source data
Fig. 2
Fig. 2. Anti-tumour immunity in obesity is altered by the source of dietary fat.
a,b, Tumour volumes (a) and endpoint tumour weights (b) of B16-F10 tumours in mice fed HFD derived from butter or palm oil, or a SFD. c,d, Volumes of E0771 (c) and LGSP (d) tumours in mice fed SFD, butter or palm oil. Female mice were used for E0771 and one cohort of B16-F10. e,f, Weight gain (e) and endpoint weight (f) of male mice fed the assigned diet. g,h, Fasting blood glucose (g) and glucose tolerance test (GTT) (h) of mice fed the assigned diet for 10 weeks. i, Hourly (left) and daily average (right) respiratory exchange ratio of mice fed the assigned diet for one week. jo, Frequency (j,k) and IFNγ expression (lo) of tumour-infiltrating NK and CD8 T cells in B16-F10 tumours in mice fed SFD, butter or palm oil. pr, Weight gain on the assigned diet (p), tumour volumes (q) and endpoint tumour weights (r) of B16-F10 tumours in Rag2−/γc−/ mice. Sample sizes are as follows: in a, SFD n = 18, butter n = 18, palm oil n = 20, pooled from four independent experiments, including experiment in Fig. 1d,g; in b, SFD n = 8, butter n = 9, palm oil n = 10, pooled from two independent experiments; in c, SFD n = 4, butter n = 5, palm oil n = 5; in d, SFD n = 5, butter n = 4, palm oil n = 4; in e and f, n = 5, representative of six independent experiments; in g, SFD n = 10, butter n = 8, palm oil n = 9, combined from two independent experiments; in h, n = 5; in i, n = 4, combined from two independent experiments; in j and k, SFD n = 9, butter n = 10, palm oil n = 10, pooled from two independent experiments; in m and o, SFD n = 8, butter n = 9, palm oil n = 10, pooled from two independent experiments; in pr, n = 5. In bar graphs, bar height represents the mean; error bars, s.e.m. In line graphs, each data point represents the mean; error bars, s.e.m. Comparisons were made using two-way repeated-measures ANOVA followed by Bonferroni’s multiple comparisons test, or one-way ANOVA followed by Sidak’s multiple comparisons test. Source data
Fig. 3
Fig. 3. Butter-HFD and palm oil-based HFD differentially regulate NK cell metabolism and function in obesity.
a,b, Representative histograms (a) and summary data (b) of LipidTOX in NK cells from mice fed HFD derived from butter (pink), palm oil (blue) or SFD (grey). MFI, mean fluorescence intensity. ch, Seahorse real-time metabolic flux assays of splenic NK cells from mice fed SFD, butter or palm oil for 12 weeks and stimulated with IL-2, IL-12 and IL-15. Extracellular acidification rate (ECAR) (c) of purified NK cells was measured to assess basal glycolysis (d) and glycolytic capacity (e). Oxygen consumption rate (OCR) (f) of purified NK cells was measured to determine basal oxidative phosphorylation (g) and maximal respiratory rate (h). in, Proteomic analysis of splenic NK cells stimulated with IL-2, IL-12 and IL-15: volcano plot representing proteins differentially expressed between mice fed butter-HFD and palm oil-HFD (i); KEGG pathway analysis of proteins upregulated in NK cells from mice fed palm oil relative to mice fed butter (j); expression of NK cell activation-related proteins NKp46 (k), NK1.1 (l) and NEMO (m) and ChIP-X enrichment analysis (ChEA) of proteins significantly increased in NK cells from mice fed palm oil relative to those fed butter (n). o, Western blot analysis of c-Myc expression in NK cells pooled from five mice per diet. p, c-Myc expression in splenic NK cells stimulated with IL-2, IL-12 and IL-15 for 4 h, measured by flow cytometry. Sample sizes are as follows: in a and b, n = 7, data combined from two independent experiments; in c and f, n = 3, representative of three independent experiments; in d and e, SFD n = 11, butter n = 10, palm oil n = 11, combined from three independent experiments; in g and h, SFD n = 10, butter n = 9, palm oil n = 11, combined from three independent experiments; in in, SFD n = 4, butter n = 4, palm oil n = 5; in p, SFD n = 7, butter n = 6, palm oil n = 8. In bar graphs, bar height represents the mean; error bars, s.e.m. In line graphs, each data point represents the mean; error bars, s.e.m. Comparisons were made using one-way ANOVA followed by Tukey’s multiple comparisons test. Oligo, oligomycin; 2DG, 2-deoxyglucose; Rot, rotenone plus antimycin-A. Source data
Fig. 4
Fig. 4. Dietary fat modulates acylcarnitine levels in plasma of DIO mice.
a, Long-chain and very long-chain fatty acid composition of HFDs derived from butter and palm oil. bd, Plasma metabolome of mice fed HFD derived from butter, palm oil or SFD for 1 week, analysed by mass spectrometry: PCA plot of plasma metabolomes of mice fed butter-HFD and palm oil-HFD (b); volcano plot of differentially expressed metabolites in mice fed butter-HFD (pink) and palm oil-HFD (blue); and relative abundance of CAR18:0 (d). e, Relative abundance of CAR18:0 in serum of B16-F10 tumour-bearing mice fed butter, palm oil or SFD for 12 weeks. fh, Plasma metabolome of mice fed HFD based on lard (60% fat) or SFD for 8 weeks, analysed by mass spectrometry: PCA plot of plasma metabolomes of lard-fed (orange) and SFD-fed (grey) mice (f); volcano plot of metabolites differentially expressed in lard-fed (orange) and SFD-fed (grey) mice (g); and relative abundance of CAR18:0 in lard and SFD (h). Sample sizes are as follows: in a, n = 4; in bd, SFD n = 5, butter n = 5, palm oil n = 4; in e, SFD n = 4, butter n = 5, palm oil n = 5; in fh, n = 10. In bar graphs, bar height represents the mean; error bars, s.e.m. Comparisons were made using one-way ANOVA followed by Tukey’s multiple comparisons test or the Mann–Whitney test. Source data
Fig. 5
Fig. 5. LCACs impair CD8 T cell metabolism and function.
am, Analysis of splenocytes cultured with the specified LCACs or vehicle and stimulated with anti-CD3, anti-CD28 and IL-2 for 48 h. a,b, IFNγ expression by CD8 T cells treated with 60 µM CAR8:0 or CAR18:0. c, IFNγ expression by CD8 T cells cultured in 25 µM or 60 µM CAR18:0. d, IFNγ expression by CD8 T cells treated with 60 µM CAR8:0, CAR14:0, CAR16:0 or CAR18:0. e, MFI of IFNγ in CD8 T cells cultured in combinations of LCAC (20 µM) or 40 µM CAR18:0 alone. fk, Seahorse real-time metabolic flux assays of purified CD8 T cells cultured with 60 µM CAR8:0 or CAR18:0: ECAR (f), measured basal glycolysis (g) and glycolytic capacity (h); OCR (i), measured basal oxidative phosphorylation (j) and maximal respiratory rate (k). l,m, TMRM staining of CD8 T cells treated with 60 µM CAR8:0 or CAR18:0; summary data normalized to mitochondrial mass by MitoTracker Green (MTG) MFI. n, Viability of B16-OVA cells after co-culture with OT-I CD8 T cells pre-treated with 60 µM CAR8:0, CAR18:0 or vehicle. o, IFNγ expression in human CD8 T cells treated with 30 µM CAR8:0, CAR18:0 or vehicle and stimulated with anti-CD3, anti-CD28 and IL-2. Sample sizes are as follows: in ad, Veh. n = 15, Veh. + Stim. n = 15, CAR8:0 n = 11, CAR14:0 n = 6, CAR16:0 n = 7, CAR18:0 n = 13, combined from three independent experiments; In e, n = 3; in f and i, n = 2–4, representative of three independent experiments; in g, h, j and k, n = 8–14, combined from three independent experiments; in l and m, n = 3–4, combined from three independent experiments; in n, n = 5; in o, n = 7 donors, four independent experiments. In bar graphs, bar height represents the mean; error bars, s.e.m. In line graphs, each data point represents the mean; error bars, s.e.m. Comparisons were made using one-way ANOVA followed by Sidak’s multiple comparisons test, two-way repeated-measures ANOVA followed by Bonferroni’s multiple comparisons test or repeated-measures one-way ANOVA followed by Tukey’s multiple comparisons test. Source data
Extended Data Fig. 1
Extended Data Fig. 1. Additional characterization of tumour growth in mice fed butter- or palm oil-based high fat diet.
a, Individual tumour growth curves of subcutaneous B16-F10 melanoma tumours in mice fed a HFD derived from Butter, Palm Oil, or SFD for 12 weeks. b-d, Volume of subcutaneous Pan02 (b), Yumm1.7 (c), and MC38 (d) tumours in mice fed SFD, butter HFD, or palm oil HFD for 12 weeks. p = 0.04 for comparison of butter-HFD and SFD. Male mice were used for Pan02 and Yumm1.7 cohorts and female mice for MC38 cohorts. e-g, Male mice were fed a HFD derived from Butter, Palm Oil, or SFD for one week prior to subcutaneous B16-F10 tumour initiation and maintained on the assigned diet until tumour endpoint. (e) Body weight of mice after one week of butter-HFD, palm oil-HFD, or SFD feeding. Tumour volumes (f) and endpoint tumour weights (g). (a) SFD n = 18, Butter n = 18, Palm Oil n = 20, data pooled from 4 independent experiments; (b) n = 4-5; (c) n = 3-4; (d) n = 5-7; (e-g) n = 10, data pooled from two independent experiments. In bar graphs, bar height represents mean with error bars ± SEM. In line graphs, each data point represents the mean with error bars ± SEM. Comparisons were made using two-way repeated measures ANOVA followed by Bonferroni’s multiple comparisons test (b-d, f) and one-way ANOVA followed by Tukey’s (e, g) multiple comparisons test. Source data
Extended Data Fig. 2
Extended Data Fig. 2. High fat diet causes obesity and impairs systemic metabolism, regardless of dietary fat source.
a-h, Male mice were fed HFD derived from Butter, Palm Oil, or SFD for 12 weeks. Weight of visceral (a) and subcutaneous (b) adipose tissue at study endpoint. (c) Average daily food consumption measured 6 weeks after diet initiation. (d) Bomb calorimetry of faeces collected after 10 weeks on diet. (e) Area under the curve of glucose tolerance test, performed 10 weeks after diet initiation. Fasting serum insulin (f) and insulin tolerance test (g) performed 10 weeks after diet initiation. (h) Representative oil red O staining (left) and summary data (right) of livers from HFD-fed mice. i, j, Mice were fed assigned diet for one week and singly housed for indirect calorimetry. Hourly (i, left) and average daily (i, right) locomotor activity. Hourly (j, left) and average daily (j, right) energy expenditure. (a, b) n = 10; (c) SFD n = 4, Butter n = 7, Palm Oil n = 7, data pooled from 2 independent experiments; (d) n = 7, (e) n = 5; (f) n = 4-5; (g, left) n = 10, combined from 2 independent experiments; (g, right) n = 5, representative of 2 independent experiments; (h) SFD n = 3, Butter n = 5, Palm Oil n = 5; (i-j) n = 4, representative of 2 independent experiments. In bar graphs, bar height represents mean with error bars ± SEM. In line graphs, each data point represents the mean with error bars ± SEM. Comparisons were made using one-way ANOVA followed by Tukey’s multiple comparisons test (a-j) or two-way repeated measures ANOVA followed by Bonferroni’s multiple comparisons test (g, left). Source data
Extended Data Fig. 3
Extended Data Fig. 3. Additional analysis of tumour-infiltrating immune cells in mice fed butter- or palm oil-based high fat diet.
a, Gating strategy used to identify tumour-infiltrating NK and CD8 T cells. b-i, Characterization of tumour-infiltrating immune cells of B16-F10 tumours in mice fed butter-HFD, palm oil-HFD, or SFD for 12 weeks. Frequency of FoxP3 + CD4+ Tregs (b), CD4 T cells (c), CD11b+ myeloid cells (d), F4/80 CD64+ tumour-associated macrophages (e), CD11c+ MHC-II+ dendritic cells (f), and CD11b + Ly6G+ neutrophil-like cells (g). (h) IFN-γ expression by tumour-infiltrating CD4 T cells. (i) GzmB expression by tumour-infiltrating CD8 T cells. (b) n = 5; (c) n = 9-10, data pooled from 2 independent experiments; (d, e, g) n = 11-14, data pooled from 3 independent experiments; (f, h, i) n = 8-10, data combined from 2 independent experiments. In bar graphs, bar height represents mean with error bars ± SEM. Comparisons were made using one-way ANOVA followed by Sidak’s (b-i) multiple comparisons test. Source data
Extended Data Fig. 4
Extended Data Fig. 4. Butter- and palm oil-based high fat diets differentially regulate NK cell protein expression.
a-f, NK cells were isolated from the spleens of naïve mice fed HFD derived from Butter, Palm Oil, or SFD for 12 weeks and stimulated with IL-2, IL-12, and IL-15 for 20 hr. (a) Relative Ifng gene expression. (b) Heatmap of 50 most differentially expressed proteins detected by mass spectrometry. Abundance of NKG2D (c), ARL8B (d), STAT5B (e), and mTOR (f) detected by mass spectrometry. g, h, Representative histogram (g, left) and summary data (g, right) of LipidTOX MFI of circulating CD8 T cells from mice fed SFD (gray), butter-HFD (pink), or palm oil-HFD (blue). (a) n = 2; (b-f) SFD n = 4, Butter n = 4, Palm Oil n = 5; (g) n = 5. In bar graphs, bar height represents mean with error bars ± SEM. Comparisons were made using one-way ANOVA followed by Sidak’s multiple comparisons test. Source data
Extended Data Fig. 5
Extended Data Fig. 5. Analysis of dietary fatty acids and metabolome of mice fed butter- and palm oil-based high fat diet.
a, b, Analysis of fatty acid composition of butter- and palm oil-derived HFD: (a) fatty acid saturation proportion and (b) abundance of short- and medium- chain fatty acids. c, IFN-γ expression by splenic CD8 T cells cultured with stearic acid and stimulated with anti-CD3, CD28, and IL-2 for 48 hr. d-i, Plasma metabolome of mice fed HFD derived from Butter, Palm Oil, or SFD for one week analysed by mass spectrometry. (d) PCA plot of plasma metabolome of mice fed SFD, Butter, or Palm Oil. (e) Heatmap of 50 most differentially abundant metabolites in plasma of mice fed SFD, Butter, or Palm Oil. Volcano plots comparing metabolites upregulated in Butter (f) and Palm Oil (g) mice compared to SFD. Relative abundance of myristoyl-carnitine (CAR14:0) and palmitoyl-carnitine (CAR16:0) in plasma. j, k, Relative abundance of CAR14:0 (j) and CAR16:0 (k) in serum of B16-F10 tumour-bearing mice fed HFD derived from Butter, Palm Oil, or SFD for 12 weeks. l, m, Tracing of [U-13C]-stearate administered to mice fed HFD derived from Butter, Palm Oil, or SFD for one week. (l) Relative abundance of 13C-labeled stearoyl-carnitine (CAR18:0) in liver. (m) Relative abundance of 13C-labeled TCA cycle intermediates fumarate (m, left) and malate (m, right) in liver. (b) n = 4; (c) n = 4-5; pooled from 4 independent experiments (d-i) SFD n = 5, Butter n = 5, Palm Oil n = 4; (j, k) n = 5; (l, m) n = 6-8. In bar graphs, bar height represents mean with error bars ± SEM. Comparisons were made using one-way ANOVA followed by Tukey’s multiple comparisons test. Source data
Extended Data Fig. 6
Extended Data Fig. 6. Impact of acylcarnitines on immune cell function.
Splenocytes from naïve mice were cultured with the specified acylcarnitines or vehicle and stimulated with anti-CD3, anti-CD28, and IL-2 for 48 hr. (a) CD69 expression on CD8 T cells cultured in 60 µM CAR8:0, CAR18:0, or vehicle. Viability of lymphocytes cultured with CAR8:0 (b), CAR18:0 (c), or vehicle. d, e, Splenocytes were cultured with the specified acylcarnitines or vehicle and stimulated with IL-2, IL-12, and IL-15. (d) IFN-γ expression by NK cells cultured in 60 µM CAR8:0, CAR18:0, or vehicle for 20 hr. (e) c-Myc expression by NK cells cultured in 60 µM CAR8:0, CAR18:0, or vehicle for 4 hr. f-h, Splenocytes were cultured with the specified acylcarnitines or vehicle and stimulated with anti-CD3, anti-CD28, and IL-2 for 48 hr. (f) MitoTracker Green (MTG) MFI of CD8 T cells cultured with 60 µM CAR8:0, CAR18:0, or vehicle, normalised to correct for intra-assay variability. Representative histogram (g) and summary data (h) of MitoSOX staining for mitochondrial reactive oxygen species in CD8 T cells cultured with 60 µM CAR8:0 (blue), CAR18:0 (orange), or vehicle (dark gray) and stimulated with anti-CD3, anti-CD28, and IL-2, or vehicle alone (light gray). i, GzmB expression by CD8 T cells treated with 30 µM CAR8:0, CAR18:0, or vehicle and stimulated with anti-CD3, CD28, and IL-2 for 48 hr. (a) n = 6; (b, c) n = 14-20, data combined from 4 independent experiments; (d) n = 5-6, data pooled from 3 independent experiments; (e) n = 8, data pooled from 2 independent experiments; (f) n = 3-4; (g,h) n = 5-6; data pooled from 4 independent experiments; (i) n = 7 human donors, 4 independent experiments. In bar graphs, bar height represents mean with error bars ± SEM. Comparisons were made using one-way ANOVA followed by Tukey’s multiple comparisons test (a-f, h) or repeated measures one-way ANOVA followed by Tukey’s multiple comparisons test (i). Source data

References

    1. World obesity day 2022—accelerating action to stop obesityhttps://www.who.int/news/item/04-03-2022-world-obesity-day-2022-accelera... (2022).
    1. Lauby-Secretan, B. et al. Body fatness and cancer—viewpoint of the IARC Working Group. N. Engl. J. Med.375, 794–798 (2016). - PMC - PubMed
    1. Petrelli, F. et al. Association of obesity with survival outcomes in patients with cancer: a systematic review and meta-analysis. JAMA Netw. Open4, e213520 (2021). - PMC - PubMed
    1. Steele, C. B. et al. Vital signs: trends in incidence of cancers associated with overweight and obesity—United States, 2005–2014. MMWR Morb. Mortal. Wkly Rep.66, 1052–1058 (2017). - PMC - PubMed
    1. Nasiri, A. R., Rodrigues, M. R., Li, Z., Leitner, B. P. & Perry, R. J. SGLT2 inhibition slows tumor growth in mice by reversing hyperinsulinemia. Cancer Metab.7, 10 (2019). - PMC - PubMed