. 2025 Jul 27;15(1):27331.
doi: 10.1038/s41598-025-09928-6.

Identification of a key smooth muscle cell subset driving ischemic cardiomyopathy progression through single-cell RNA sequencing

Affiliations

Identification of a key smooth muscle cell subset driving ischemic cardiomyopathy progression through single-cell RNA sequencing

Wenyang Nie et al. Sci Rep. .

Abstract

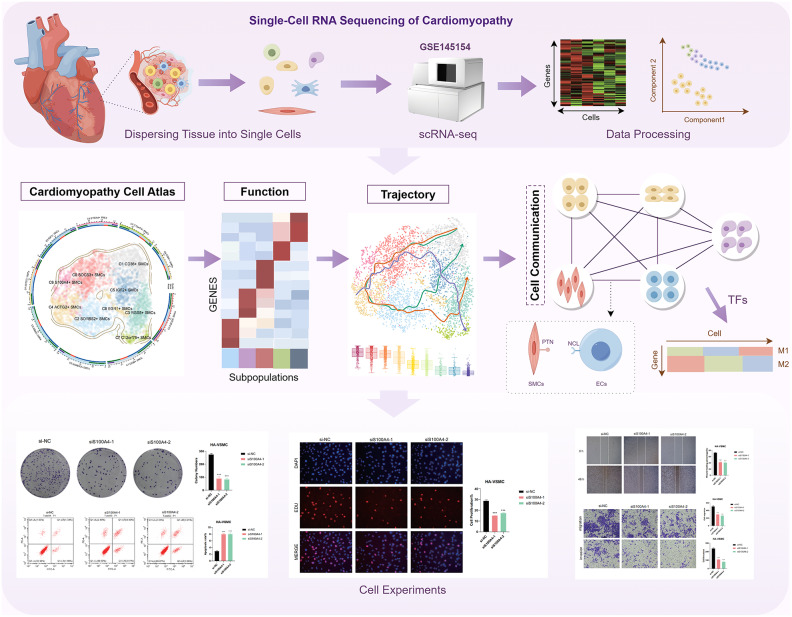
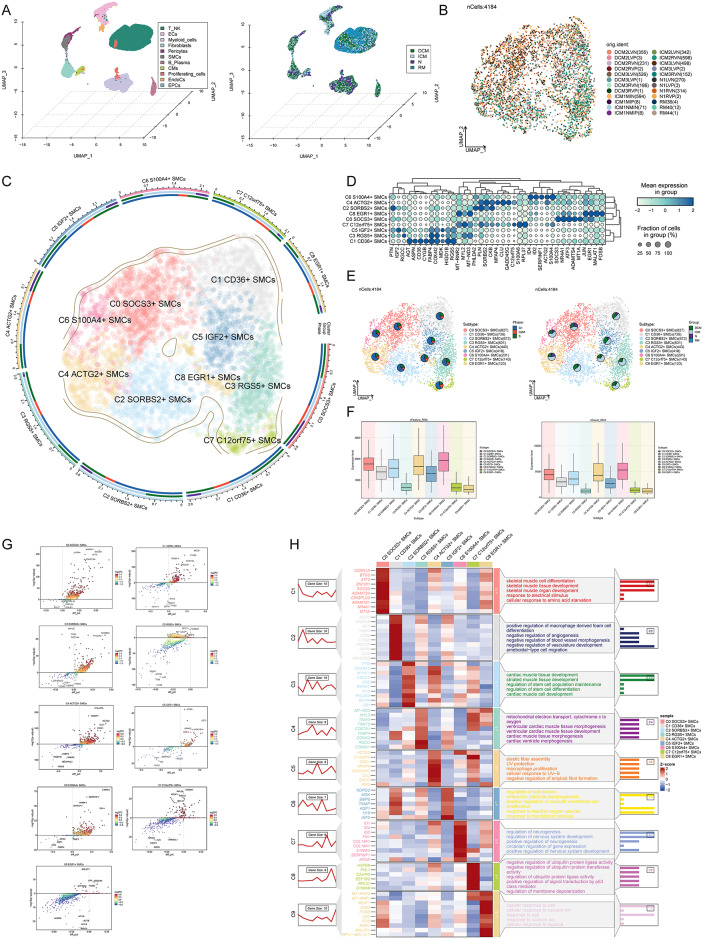
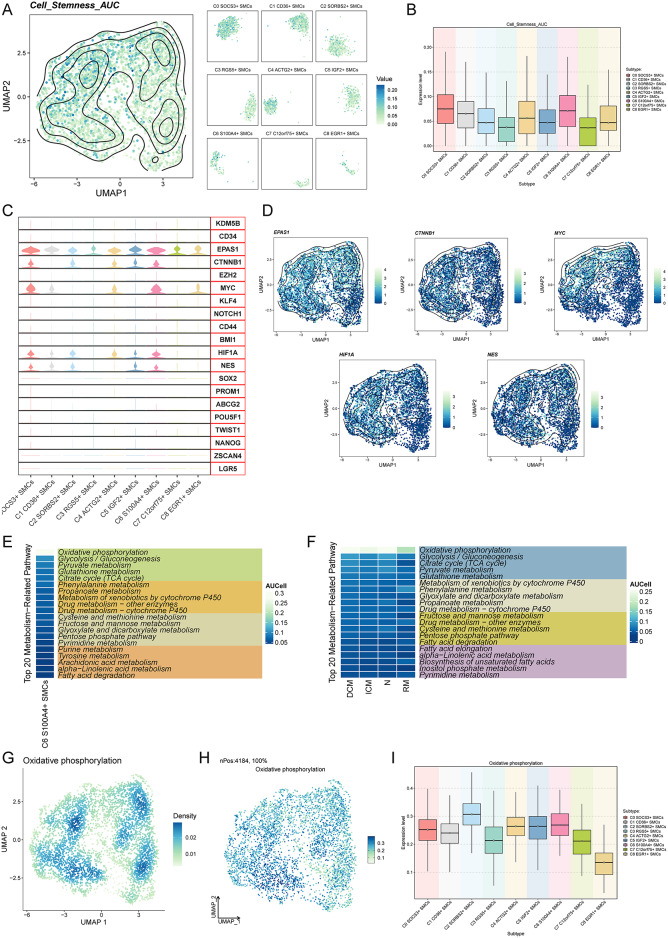
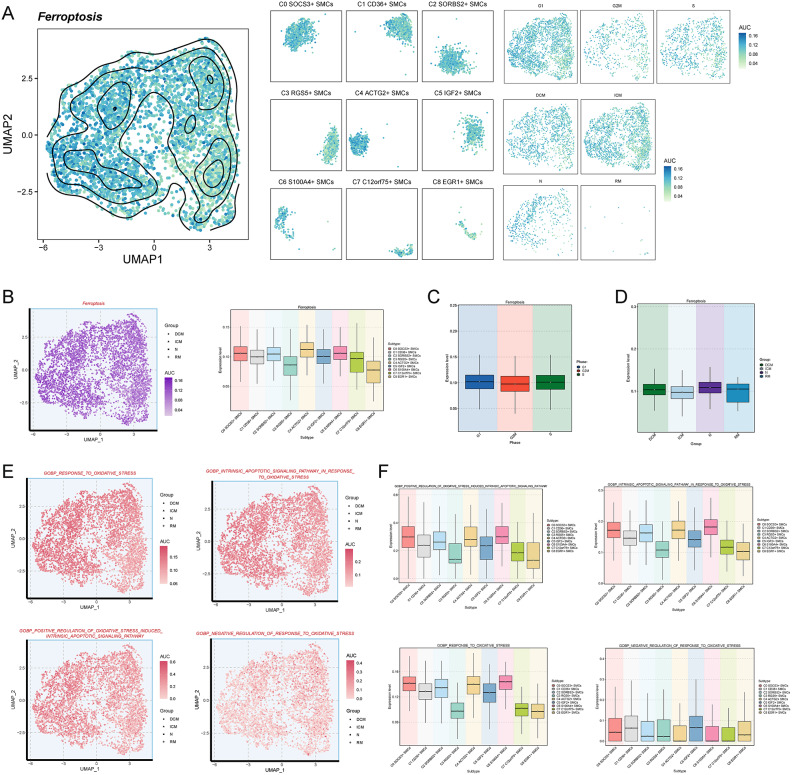
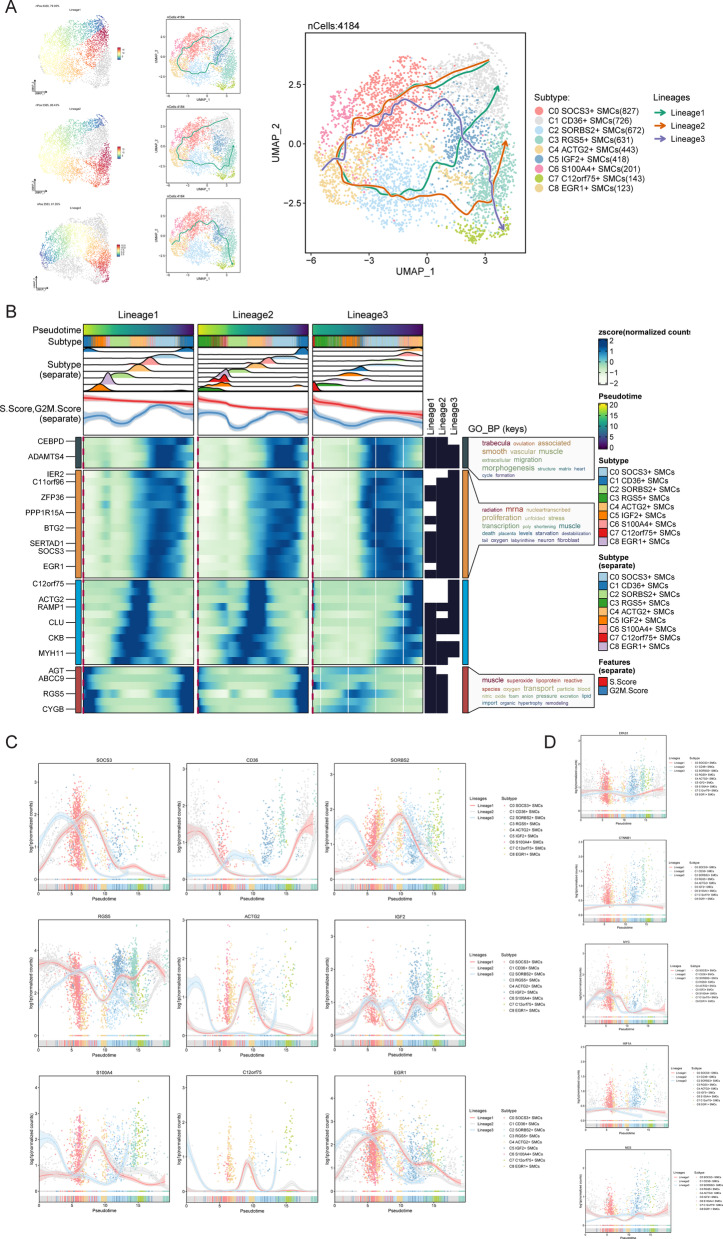
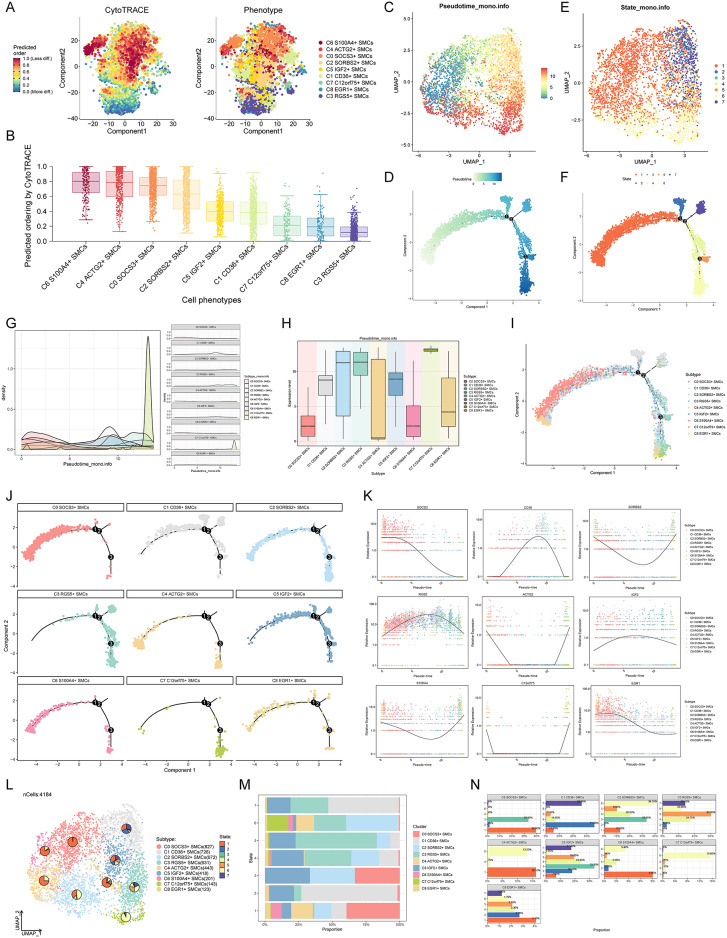
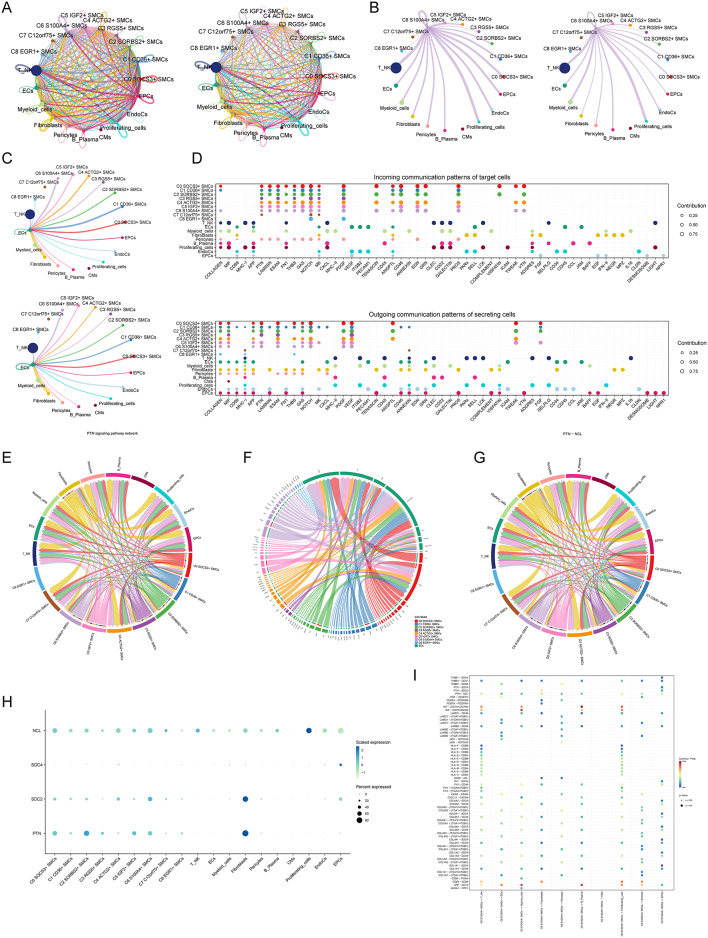
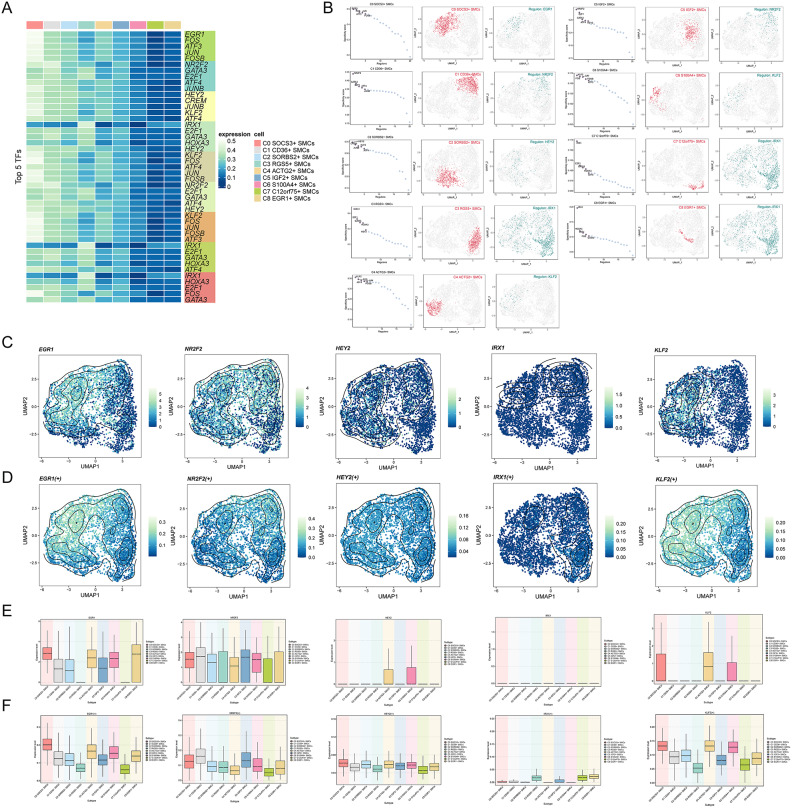
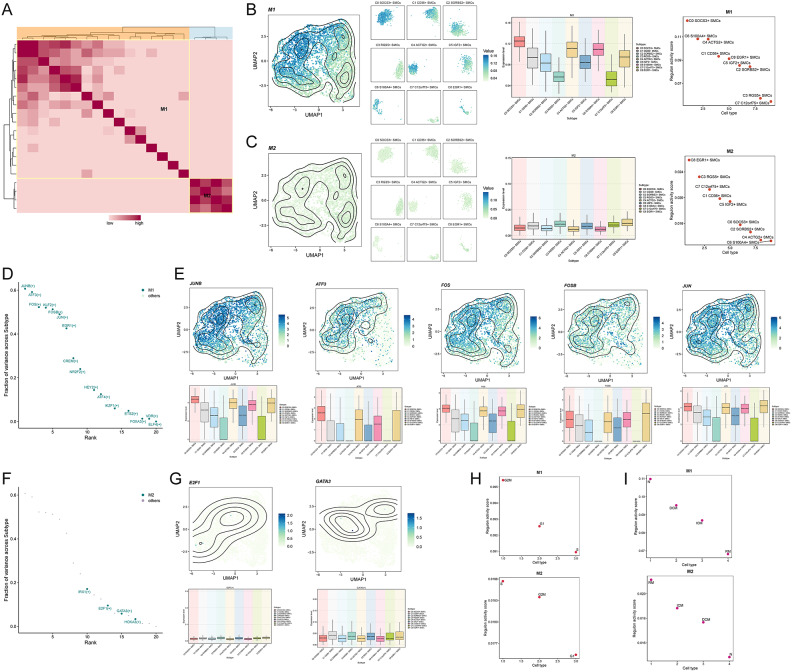
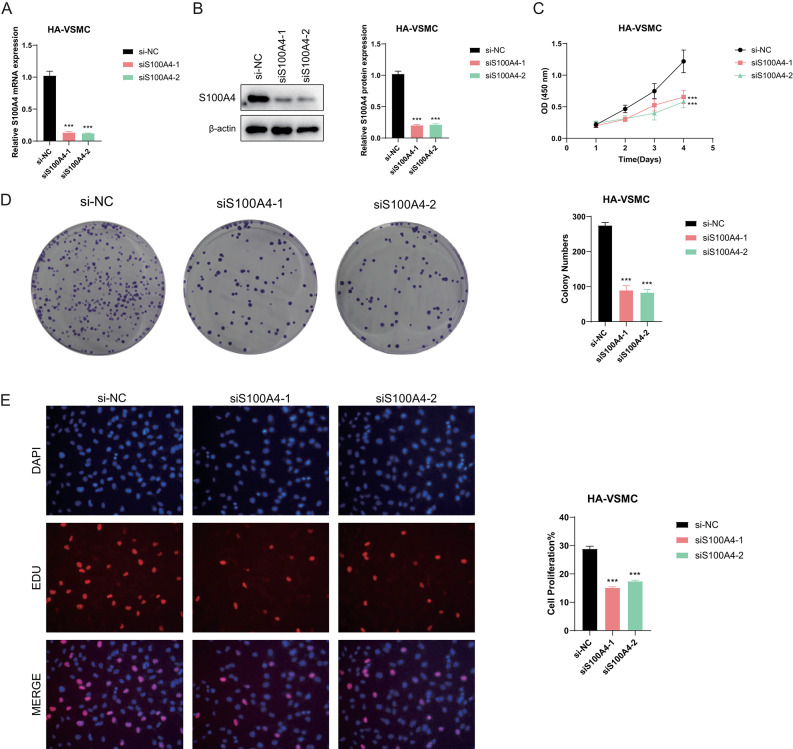
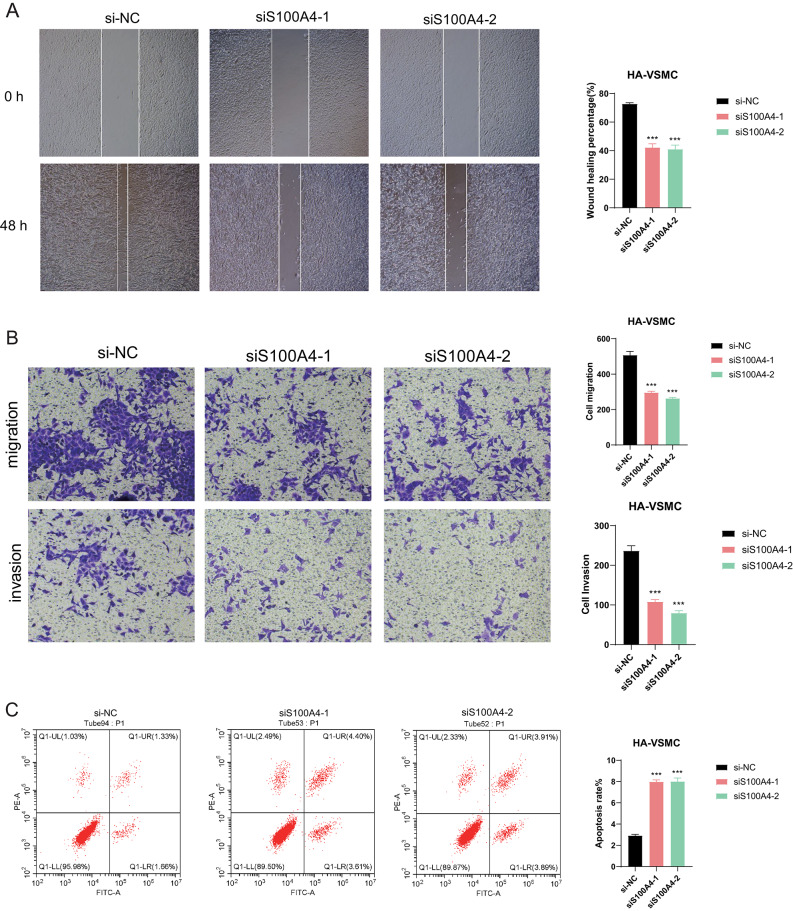
Cardiomyopathy encompasses a range of diseases that severely affect the complex functions of the heart, involving structural and functional abnormalities, and is associated with high mortality. Recent studies have highlighted the critical role of ferroptosis in regulating oxidative stress and inflammation in cardiomyopathy. In this study, we established that the C6 S100A4+ SMCs subpopulation is critical by performing an integrated single-cell analysis of the known publicly available data GSE145154. We validated the role of S100A4 in SMCs through in vitro experiments, providing evidence for its potential as a therapeutic target. Furthermore, these cells interact with endothelial cells through the PTN-NCL pathway, influencing disease progression. Key transcription factors, including KLF2, FOS, FOSB, and JUNB, were identified. This key subpopulation, along with its associated signaling pathways, marker genes, stemness genes, and transcription factors, may offer new insights for preventing the onset and progression of cardiomyopathy, particularly ischemic cardiomyopathy.

Keywords: Cardiomyopathy; Exosomes; Ferroptosis; Inflammation; Single-cell RNA sequencing; Smooth muscle cells.


Conflict of interest statement

Declarations. Competing interests: The authors declare no competing interests. Ethical statement: The study was reviewed and approved by Ethics Committee of the Affiliated Hospital of Shandong University of Traditional Chinese Medicine (Designation:AF/SC-08/03.0).

Figures

Fig. 1
Fig. 1
Principles of research.
Fig. 2
Fig. 2
Visualization of smooth muscle cell subpopulations in cardiomyopathy (A) The spatial distribution of all cells in the selected cardiomyopathy samples (left) and their distribution across different groups (right) were depicted in a 3D UMAP plot. (B) The UMAP plot illustrated the specific distribution of 24 samples selected from GSE145154. (C) Smooth muscle cells were categorized into nine subpopulations based on differential expression of marker genes. The UMAP plot displayed their distributions and provided information about the proportions of different groups and cell cycles within each subpopulation. (D) Average expression levels of differentially expressed genes in the nine smooth muscle cell subpopulations were presented in a bubble plot. (E) Pie charts directly showed the proportions of cell cycles and different groups within each subpopulation on the UMAP plot. (F) Box plots illustrated the nFeature_RNA and nCount_RNA of the nine smooth muscle cell subpopulations. (G) Volcano plots depicted the top 5 upregulated and top 5 downregulated genes in the nine smooth muscle cell subpopulations. (H) Highly expressed differential genes in the nine smooth muscle cell subpopulations were subjected to GO-BP enrichment analysis.
Fig. 3
Fig. 3
Stemness and metabolic activity of smooth muscle cell subpopulations (A) The distribution of stemness AUC values across the nine smooth muscle cell subpopulations was visualized using UMAP plots and faceted plots. (B) Box plots provided a clear comparison of stemness AUC values among the nine smooth muscle cell subpopulations. (C) Violin plots illustrated the differential expression of stemness genes across the nine smooth muscle cell subpopulations. (D) UMAP plots displayed the expression and density distribution of five highly expressed stemness genes (EPAS1, CTNNB1, MYC, HIF1A, NES) across all smooth muscle cell subpopulations. (E) Heatmaps depicted the AUC values of the top 20 metabolic pathways in C6 S100A4+ SMCs. (F) Heatmaps presented the AUC values of the top 20 metabolic pathways across the four groups. (G) UMAP plots showed the density distribution of the oxidative phosphorylation pathway. (H) UMAP plots displayed the expression intensity distribution of the oxidative phosphorylation pathway. (I) Box plots visually represented differences in the expression levels of the oxidative phosphorylation metabolic pathway among the nine smooth muscle cell subpopulations.
Fig. 4
Fig. 4
Differences in ferroptosis and oxidative stress scores across all smooth muscle cell subpopulations (A) UMAP plots were used to visualize the distribution of ferroptosis AUC values. Faceted plots provided detailed insights into the distribution differences of ferroptosis AUC values within each subpopulation, across different groups, and during different cell cycles. (B) Detailed variations in ferroptosis scores were illustrated, highlighting specific groups within each subpopulation. Comparisons of ferroptosis scores among the nine smooth muscle cell subpopulations were also presented. (C) Variations in ferroptosis scores across different cell cycles were displayed. (D) Variations in ferroptosis scores across different groups were illustrated. (E) UMAP plots depicted distribution differences of four oxidative stress-related scores. (F) Box plots visually compared the differences in the four oxidative stress-related scores across the different smooth muscle cell subpopulations.
Fig. 5
Fig. 5
Slingshot analysis of smooth muscle cell subpopulations (A) Three fitted differentiation trajectories of smooth muscle cell subpopulations were depicted. The temporal order and distribution of these trajectories were further validated using UMAP plots. The trajectories were as follows: Lineage 1: C1 → C0 → C6 → C4 → C2 → C8 → C5 → C1; Lineage 2: C1 → C0 → C6 → C4 → C2 → C3; Lineage 3: C4 → C6 → C0 → C1 → C5 → C3 → C7. (B) Heatmaps illustrated the differential expression of genes along the three trajectories, accompanied by their GO-BP enrichment analysis. (C) The differential expression of marker genes in the nine smooth muscle cell subpopulations was shown as they progressed through the three trajectories. (D) The differential expression of the five aforementioned stemness genes (EPAS1, CTNNB1, MYC, HIF1A, NES) was presented as they evolved along the three trajectories.
Fig. 6
Fig. 6
CytoTRACE analysis and pseudotime trajectory validation of smooth muscle cell subpopulations (A) UMAP plots displayed the results of CytoTRACE analysis conducted on smooth muscle cell subpopulations. (B) Based on the CytoTRACE results, the differentiation levels of the nine smooth muscle cell subpopulations were visualized through box plots. (C) UMAP plots showcased the distribution of pseudotime. (D) A two-dimensional plot further elucidated the pseudotime trajectory, progressing from left to right with two branches in the middle phase and one branch in the late phase. (E) Due to branching in the pseudotime trajectory, the entire pseudotime was divided into seven stages (State 1–7), and their distribution across all smooth muscle cell subpopulations was displayed using UMAP plots. (F) A dedicated two-dimensional plot specifically depicted the distribution of State 1–7 along the established pseudotime trajectory. (G) Ridge plots displayed the distribution of the nine smooth muscle cell subpopulations on the pseudotime trajectory. (H) Box plots provided a more intuitive quantification of the expression levels of the nine smooth muscle cell subpopulations on the pseudotime trajectory. (I) A two-dimensional plot visualized the specific distribution of the nine smooth muscle cell subpopulations on the established pseudotime trajectory. (J) The distribution characteristics of each smooth muscle cell subpopulation on the trajectory were individually displayed in sequence. (K) Visualization of the expression patterns of marker genes for each smooth muscle cell subpopulation over time on the pseudotime trajectory. (L) Pie charts on UMAP plots revealed the proportions of different states within each smooth muscle cell subpopulation. (M) Bar graphs depicted the proportions of different smooth muscle cell subpopulations within each state. (N) Bar graphs showed the percentage of each state occupied by each smooth muscle cell subpopulation.
Fig. 7
Fig. 7
Cell communication landscape in cardiomyopathy (A) The left plot depicted the abundance of interactions among all cells in cardiomyopathy, represented as a circle diagram. The right plot visualized the intensity of these interactions among all cells, also shown as a circle diagram. (B) In the left plot, the quantity of interactions was shown when C6 S100A4+ SMCs acted as signal emitters to all other cells. The right plot showcased the strength of these interactions when C6 S100A4+ SMCs acted as signal emitters to all other cells. (C) The upper plot displayed the quantity of interactions when ECs acted as signal receivers from all other cells. The lower plot presented the strength of interactions when ECs acted as signal receivers from all other cells. (D) Bubble charts depicted the expression levels of distinct proteins when all cells acted as signal receivers (top) and when all cells functioned as signal emitters (bottom). (E) Chord diagrams illustrated the patterns of interaction among all cells within the PTN signaling pathway network. (F) Chord diagrams demonstrated the differential expression of receptor proteins when ECs acted as signal receivers from all smooth muscle cell subpopulations. (G) The interaction patterns among all cells within the PTN-NCL receptor-based cell interaction pathway. (H) Bubble charts depicted the stable expression levels of PTN protein in C6 S100A4+ SMCs and NCL protein in ECs, respectively. (I) Bubble charts presented the expression levels of various receptor proteins when C6 S100A4+ SMCs interacted with other cells (excluding other smooth muscle cell subpopulations).
Fig. 8
Fig. 8
Gene regulatory network analysis of smooth muscle cell subpopulations in cardiomyopathy (A) Heatmaps displayed the differential expression of the top 5 TFs in the nine smooth muscle cell subpopulations. (B) Regulators in smooth muscle cell subpopulations associated with cardiomyopathy were ranked based on the Regulator Specificity Score (RSS) (left). Each smooth muscle cell subpopulation was highlighted with a red dot in the UMAP plots (middle). The distribution of the highest regulatory subunits, mapped on UMAP plots based on the binary RAS (normalized using Z-score across all samples, with a threshold of 2.5 set to convert to 0 or 1), was highlighted with green dots. (C) UMAP plots illustrated the expression levels of EGR1, NR2F2, HEY2, IRX1, and KLF2 in the smooth muscle cell subpopulations. (D) UMAP plots depicted the distribution of AUC values for EGR1, NR2F2, HEY2, IRX1, and KLF2 in the smooth muscle cell subpopulations. (E) Box plots quantified the differential expression levels of the top 5 highly active regulatory subunits in the nine smooth muscle cell subpopulations. (F) Box plots visually compared the AUC values of the aforementioned 5 regulators in the nine smooth muscle cell subpopulations. We used R software (v.4.3.3) (https://cran.r-project.org/) to visualize the results calculated by the pySCENIC module (v0.12.1) based on Python (v3.9.19) (https://www.python.org/). Finally, we integrated all the images in Adobe Illustrator (2024) (https://www.adobe.com/products/illustrator.html).
Fig. 9
Fig. 9
Identification of transcription factor regulatory modules in cardiomyopathy smooth muscle cells (A) The heatmap displayed the identification of regulatory submodules in smooth muscle cell subpopulations associated with cardiomyopathy based on SCENIC regulatory rules modules and AUCell scores similarity. Eventually, two rule-based submodules were identified. (B, C) UMAP plots and faceted plots showed the distribution of AUC scores of two rule-based submodules (M1, M2) and their distribution across various smooth muscle cell subpopulations (left). Box plots intuitively compared the expression levels of M1 and M2 in each smooth muscle cell subpopulation (middle). Scatter plots provided a better understanding of the expression score rankings of M1 and M2 in each smooth muscle cell subpopulation (right). (D) Scatter plot displayed the ranking of different TFs in M1 based on their variation scores. (E) Visualization of the 5 TFs with high variation scores in M1. UMAP plots illustrated the expression distribution of JUNB, ATF3, FOS, FOSB, and JUN, while box plots compared their expression differences among the nine smooth muscle cell subpopulations. (F) Scatter plot depicted the variation scores of different TFs in M2. (G) Visualization of the 2 TFs with high ranking in M2. UMAP plots respectively showed the expression distribution of these TFs, while box plots compared their expression differences among the nine smooth muscle cell subpopulations. (H) Scatter plots showed the ranking of the main cell cycle phases in M1 and M2. (I) Scatter plots showed the ranking of the groups to which cells belonged in M1 and M2.
Fig. 10
Fig. 10
Knockdown of S100A4 suppresses the proliferation ability of HA-VSMCs (A) Relative expression of S100A4 in Si-S100A4 knockdown HA-VSMCs. (B) Differential expression of S100A4 protein in HA-VSMCs with Si-S100A4 knockdown. (C) The CCK-8 assay revealed a significant decrease in cell viability following S100A4 knockdown. (D) Colony formation assay showed a markedly reduced number of cell colonies in cells with depleted S100A4 expression compared to the NC group. (E) Edu staining assay demonstrated that downregulation of S100A4 significantly inhibited HA-VSMC proliferation relative to the NC group. Statistical significance was indicated as *P < 0.01, **P < 0.001, ***P < 0.0001, and ****P < 0.00001.
Fig. 11
Fig. 11
Knockdown of S100A4 suppresses the migration and invasion abilities of HA-VSMCs and induces cell apoptosis (A) The scratch wound healing assay revealed that decreased expression of S100A4 significantly impaired the wound healing rate. (B) The Transwell assay demonstrated that downregulation of S100A4 markedly reduced the migration and invasion capabilities of HA-VSMCs. (C) Annexin V-FITC/PI double staining flow cytometry assay showed a substantial increase in induced cell apoptosis following S100A4 knockdown compared to the NC group. Statistical significance was indicated as *P < 0.01, **P < 0.001, ***P < 0.0001, and ****P < 0.00001.

Similar articles

References

    1. Maron, B. J. et al. Contemporary definitions and classification of the cardiomyopathies: An American heart association scientific statement from the council on clinical cardiology, heart failure and transplantation committee; Quality of care and outcomes research and functional genomics and translational biology interdisciplinary working groups; And council on epidemiology and prevention. Circulation113, 1807–1816. 10.1161/CIRCULATIONAHA.106.174287 (2006). - PubMed
    1. Li, D., Pi, W., Sun, Z., Liu, X. & Jiang, J. Ferroptosis and its role in cardiomyopathy. Biomed. Pharmacother.153, 113279. 10.1016/j.biopha.2022.113279 (2022). - PubMed
    1. Cardiomyopathies, B. E. An Overview. Circ. Res.121, 711–721. 10.1161/CIRCRESAHA.117.311812 (2017). - PubMed
    1. Li, Y., Du, J., Liu, B. & She, Q. Identifying key genes and related molecules as potential biomarkers in human dilated cardiomyopathy by comprehensive bioinformatics analysis. Cardiovasc. Innov. Appl.8, 996. 10.15212/CVIA.2023.0018 (2023).
    1. Rapezzi, C. et al. Restrictive cardiomyopathy: Definition and diagnosis. Eur. Heart J.43, 4679–4693. 10.1093/eurheartj/ehac543 (2022). - PMC - PubMed