Randomized Controlled Trial
. 2025 Sep;33(9):1668-1679.
doi: 10.1002/oby.24348. Epub 2025 Jul 27.

Early-Onset Obesity and Tirzepatide Treatment: A Post Hoc Analysis of the SURMOUNT Clinical Trials

Affiliations
Randomized Controlled Trial

Early-Onset Obesity and Tirzepatide Treatment: A Post Hoc Analysis of the SURMOUNT Clinical Trials

Evgenia Gourgari et al. Obesity (Silver Spring). 2025 Sep.

Abstract

Objective: People with early-onset obesity (diagnosed at age < 25 years) may present with more cardiometabolic abnormalities and obesity-related complications. This post hoc analysis assessed baseline characteristics and body weight (BW) changes with tirzepatide in people with early- versus later-onset obesity.

Methods: Participants (N = 3782) from SURMOUNT-1, SURMOUNT-3, and SURMOUNT-4 randomized to tirzepatide or placebo were included. Baseline characteristics and changes in BW and cardiometabolic risk factors at 72/88 weeks were assessed.

Results: In SURMOUNT-1, participants with early- versus later-onset obesity had longer mean obesity duration (20 ± 12 vs. 11 ± 8 years), higher BMI (40 ± 7 vs. 37 ± 6 kg/m2) and waist circumference (WC, 118 ± 16 vs. 112 ± 14 cm), and lower HbA1c (5.48% ± 0.4% vs. 5.60% ± 0.4%), triglycerides (median 120 vs. 130 mg/dL), and systolic blood pressure (SBP; 121 ± 13 vs. 125 ± 13 mmHg) at baseline (all p ≤ 0.004). At 72 weeks, improvements with tirzepatide in BW (-23% vs. -22%), WC (-22 vs. -19 cm), HbA1c (-0.51% vs. -0.52%), triglycerides (-32% vs. -31%), and SBP (-8 vs. -8 mmHg) were similar between subgroups. Similar improvements were observed in SURMOUNT-3 and SURMOUNT-4.

Conclusions: In this post hoc analysis, participants with early- versus later-onset obesity exhibited a mixed profile of metabolic health at baseline, including a higher degree of central adiposity and lower HbA1c and SBP. Improvements in BW and cardiometabolic markers with tirzepatide were similar between subgroups.

Trial registration: ClinicalTrials.gov identifiers: NCT04184622, NCT04657016, NCT04660643.

Keywords: early‐onset; obesity; tirzepatide.


Conflict of interest statement

E.G. has received a travel award from Eli Lilly and Company. G.S. reports consulting fees from Rhythm, Novo Nordisk, and Eli Lilly and Company. A.S.K. engages in unpaid consulting and educational activities and serves as an unpaid investigator for Novo Nordisk; engages in unpaid consulting activities and serves as an unpaid investigator for Boehringer Ingelheim, Eli Lilly and Company, and Vivus; and receives donated drug/placebo from Novo Nordisk and Vivus for National Institute of Diabetes and Digestive and Kidney Diseases (NIDDK)‐funded clinical trials. D.M., D.C., M.A.M., C.A.K., and C.J.L. are employees and shareholders of Eli Lilly and Company.

Figures
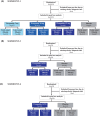
FIGURE 1
FIGURE 1
Participant disposition. MTD, maximum tolerated dose.
FIGURE 2
FIGURE 2
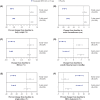
Change from baseline in body weight, HbA1c, and cardiometabolic parameters at week 72 in people with early‐onset versus later‐onset obesity in SURMOUNT‐1. Analysis based on data from participants while on assigned treatment without rescue medication (efficacy estimand). Data are least squares mean and 95% CI within subgroups and treatment arms derived from MMRM, adjusted for baseline values and study stratification factors. Lipid profiles were analyzed on the log‐scale and then converted back to the percent change. The interactions between the treatment and onset of obesity were assessed using the same MMRM model applied to the overall population with additional terms for onset of obesity (early onset, later onset), treatment‐by‐onset of obesity, time‐by‐onset of obesity, and treatment‐by‐time‐by‐onset of obesity terms. (A) Percent change from baseline in body weight in people with early‐onset versus later‐onset obesity at week 72 in SURMOUNT‐1. The treatment‐by‐early‐onset interaction at week 72 was p = 0.457. (B) Change from baseline in waist circumference in people with early‐onset versus later‐onset obesity at week 72 in SURMOUNT‐1. The treatment‐by‐early‐onset interaction at week 72 was p = 0.028. (C) Change from baseline in HbA1c in people with early‐onset versus later‐onset obesity at week 72 in SURMOUNT‐1. The treatment‐by‐early‐onset interaction at week 72 was p = 0.786. (D) Change from baseline in systolic blood pressure in people with early‐onset versus later‐onset obesity at week 72 in SURMOUNT‐1. The treatment‐by‐early‐onset interaction at week 72 was p = 0.777. (E) Percent change from baseline in triglycerides in people with early‐onset versus later‐onset obesity at week 72 in SURMOUNT‐1. The treatment‐by‐early‐onset interaction at week 72 was p = 0.491. (F) Percent change from baseline in HDL‐C in people with early‐onset versus later‐onset obesity at week 72 in SURMOUNT‐1. The treatment‐by‐early‐onset interaction at week 72 was p = 0.878. Early‐onset: diagnosis of obesity before age 25 years (calculated by age at study enrollment − duration of obesity). HDL‐C, high‐density lipoprotein cholesterol; MMRM, mixed model for repeated measures; N, number of participants in the subgroup across all treatment arms.
FIGURE 3
FIGURE 3
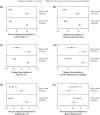
Change from baseline in body weight, HbA1c, and cardiometabolic parameters at week 72 in people with early‐onset versus later‐onset obesity in SURMOUNT‐3. Analysis based on data from participants while on assigned treatment without rescue medication (efficacy estimand). Data are least squares mean and 95% CI within subgroups and treatment arms derived from MMRM, adjusted for baseline values and study stratification factors. Lipid profiles were analyzed on the log‐scale and then converted back to the percent change. The interactions between the treatment and onset of obesity were assessed using the same MMRM model applied to the overall population with additional terms for onset of obesity (early onset, later onset), treatment‐by‐onset of obesity, time‐by‐onset of obesity, and treatment‐by‐time‐by‐onset of obesity terms. (A) Percent change from baseline in body weight in people with early‐onset versus later‐onset obesity at week 72 in SURMOUNT‐3. The treatment‐by‐early‐onset interaction at week 72 was p = 0.158. (B) Change from baseline in waist circumference in people with early‐onset versus later‐onset obesity at week 72 in SURMOUNT‐3. The treatment‐by‐early‐onset interaction at week 72 was p = 0.091. (C) Change from baseline in HbA1c in people with early‐onset versus later‐onset obesity at week 72 in SURMOUNT‐3. The treatment‐by‐early‐onset interaction at week 72 was p = 0.606. (D) Change from baseline in systolic blood pressure in people with early‐onset versus later‐onset obesity at week 72 in SURMOUNT‐3. The treatment‐by‐early‐onset interaction at week 72 was p = 0.525. (E) Percent change from baseline in triglycerides in people with early‐onset versus later‐onset obesity at week 72 in SURMOUNT‐3. The treatment‐by‐early‐onset interaction at week 72 was p = 0.254. (F) Percent change from baseline in HDL‐C in people with early‐onset versus later‐onset obesity at week 72 in SURMOUNT‐3. The treatment‐by‐early‐onset interaction at week 72 was p = 0.358. Early‐onset: diagnosis of obesity before age 25 years (calculated by age at study enrollment − duration of obesity). SURMOUNT‐3 included participants who achieved ≥ 5.0% body weight reduction after a 12‐week intensive lifestyle intervention [16]. HDL‐C, high‐density lipoprotein cholesterol; MMRM, mixed model for repeated measures; N, number of participants in the subgroup across all treatment arms.
FIGURE 4
FIGURE 4
Change from baseline in body weight, HbA1c, and cardiometabolic parameters at week 88 in people with early‐onset versus later‐onset obesity in SURMOUNT‐4. Analysis based on data from participants while on assigned treatment without rescue medication (efficacy estimand). Data are least squares mean and 95% CI within subgroups and treatment arms derived from MMRM, adjusted for baseline values and study stratification factors. Lipid profiles were analyzed on the log‐scale and then converted back to the percent change. The interactions between the treatment and onset of obesity were assessed using the same MMRM model applied to the overall population with additional terms for onset of obesity (early onset, later onset), treatment‐by‐onset of obesity, time‐by‐onset of obesity, and treatment‐by‐time‐by‐onset of obesity terms. (A) Percent change from baseline in body weight in people with early‐onset versus later‐onset obesity at week 88 in SURMOUNT‐4. The treatment‐by‐early‐onset interaction at week 88 was p = 0.950. (B) Change from baseline in waist circumference in people with early‐onset versus later‐onset obesity at week 88 in SURMOUNT‐4. The treatment‐by‐early‐onset interaction at week 88 was p = 0.478. (C) Change from baseline in HbA1c in people with early‐onset versus later‐onset obesity at week 88 in SURMOUNT‐4. The treatment‐by‐early‐onset interaction at week 88 was p = 0.446. (D) Change from baseline in systolic blood 88 in people with early‐onset versus later‐onset obesity at week 88 in SURMOUNT‐4. The treatment‐by‐early‐onset interaction at week 88 was p = 0.395. (E) Percent change from baseline in triglycerides in people with early‐onset versus later‐onset obesity at week 88 in SURMOUNT‐4. The treatment‐by‐early‐onset interaction at week 88 was p = 0.055. (F) Percent change from baseline in HDL‐C in people with early‐onset versus later‐onset obesity at week 88 in SURMOUNT‐4. The treatment‐by‐early‐onset interaction at week 88 was p = 0.633. Early‐onset: diagnosis of obesity before age 25 years (calculated by age at study enrollment − duration of obesity). SURMOUNT‐4 included participants who completed the 36‐week, open‐label tirzepatide lead‐in period experienced a mean weight reduction of 21% [17]. HDL‐C, high‐density lipoprotein cholesterol; MMRM, mixed model for repeated measures; N, number of participants in the subgroup across all treatment arms.

References

    1. Cheng H. L., Medlow S., and Steinbeck K., “The Health Consequences of Obesity in Young Adulthood,” Current Obesity Reports 5, no. 1 (2016): 30–37. - PubMed
    1. Reis J. P., Loria C. M., Lewis C. E., et al., “Association Between Duration of Overall and Abdominal Obesity Beginning in Young Adulthood and Coronary Artery Calcification in Middle Age,” JAMA 310, no. 3 (2013): 280–288. - PMC - PubMed
    1. Lee C. D., D. R. Jacobs, Jr. , Schreiner P. J., Iribarren C., and Hankinson A., “Abdominal Obesity and Coronary Artery Calcification in Young Adults: The Coronary Artery Risk Development in Young Adults (CARDIA) Study,” American Journal of Clinical Nutrition 86, no. 1 (2007): 48–54. - PubMed
    1. Patton G. C., Coffey C., Carlin J. B., et al., “Overweight and Obesity Between Adolescence and Young Adulthood: A 10‐Year Prospective Cohort Study,” Journal of Adolescent Health 48, no. 3 (2011): 275–280. - PubMed
    1. Stierman B., Afful J., Carroll M. D., et al., “National Health and Nutrition Examination Survey 2017–March 2020 Prepandemic Data Files Development of Files and Prevalence Estimates for Selected Health Outcomes,” National Health Statistics Reports 158 (2021). - PMC - PubMed

Publication types

Associated data

Grants and funding