. 2025 Aug 12;19(31):28768-28783.
doi: 10.1021/acsnano.5c08482. Epub 2025 Jul 27.

Harnessing Dye-Induced Local Heating in Lipid Membranes: A Path to Near-Infrared Light-Modulated Artificial Synaptic Vesicles

Affiliations

Harnessing Dye-Induced Local Heating in Lipid Membranes: A Path to Near-Infrared Light-Modulated Artificial Synaptic Vesicles

Satya Ranjan Sarker et al. ACS Nano. .

Abstract

Optical heating coupled with near-infrared (NIR) light and photothermal materials enables local heating within biospecimens, minimizing undesirable thermal damage. Here, we demonstrated that photothermally heating lipid bilayers embedded with a phthalocyanine dye (VPc) efficiently perturbs the bilayers, resulting in increased permeability. Notably, microscopic studies revealed that the changes in membrane permeability may not follow the conventional mechanism of temperature-sensitive liposomes, which involve a bulk temperature increase that induces a phase transition across the entire lipid bilayer. Furthermore, the heat generated by NIR laser illumination rarely diffused into the surrounding environment, and the dye was located within the bilayers at the molecular level, where it effectively transferred heat to the lipid bilayer. We prepared VPc-embedded liposomes encapsulating acetylcholine (ACh) and demonstrated the NIR laser-triggered release of ACh, creating a concentration jump across a few cells or within a limited single cell region. This method induced Ca2+ flux through ACh receptor stimulation in thermally delicate biospecimens such as C2C12 myotubes and the Drosophila brain.

Keywords: NIR light; artificial synaptic vesicle; local heating; photothermal dye; thermometry.


Figures

1
1
Screening of photothermal dyes to develop near-infrared-modulated liposomes under bulk conditions. (A) Chemical structures of PTDs. (B) Schematic illustration of a photothermal dye (PTD)-embedded liposome for inducing phase transition upon NIR illumination. (C) Quantum yield (ϕ), fluorescence lifetime (τ), and rate constant of nonradiative relaxation (k nr) of each PTD. (D) Absorption spectra and (E) heat production ability of PTD-embedded liposomes induced by 808 nm laser illumination (160 mW). The baseline temperature was set to 23 °C. (F,G) Analysis of the heat-induced leakage of calcein from PTD-embedded liposomes. Each PTD-embedded liposome suspension was heated on a heat block at 50 °C for 20 min or illuminated by an 808 nm laser (160 mW) for 5 min. The diameter of the laser spot was approximately 4 mm. The changes in the normalized fluorescence intensity of calcein (F/F 0) were evaluated in both heating methods (G). The dotted line represents a control line without heating treatments (F/F 0 = 1 indicates no calcein leakage).
2
2
Calcein release from photothermal dye-embedded liposomes at the microscopic level. (A) Microscopic setup to examine calcein leakage upon 808 nm laser illumination. Fluorescence changes were observed using a 473 nm laser. (B) Time course montage of calcein leakage from VPc- or IR792-embedded liposomes (upper panel: VPc, lower panel: IR792). The 808 nm laser produced a focal spot approximately 10 μm in diameter, sufficient to cover the entire area of the liposome. Scale bar: 2 μm. (C) The mean of calcein release (F/F 0) ± standard deviation (SD) (n = 8–10) was plotted in the time course. The red dashed line represents the timing of 808 nm laser illumination. (D) Evaluation of calcein release from PTD-embedded liposomes following 808 nm laser illumination (10 s, 950 μW). The line in the boxes shows the median (n = 10). (E) Calcein release from VPc-embedded liposomes (VPc-Lipo) at different laser powers during 50 ms stimulation (mean ± SD, n = 5). (F) Calcein release from VPc-Lipo at different durations at a constant laser power of 950 μW (mean ± SD, n = 5). Student’s t-test, *p < 0.01. (G) Different temporal patterns of calcein release following 808 nm laser illumination (950 μW; 20, 10, 5, and 1 s). Each data point shows the mean ± SD (n = 5). All measurements were performed at a baseline temperature of 23 °C. We selected liposomes with approximately 1–8 μm to cover the entire target area under NIR illumination.
3
3
Minimal alteration of membrane fluidity in VPc-embedded liposomes following illumination with an 808 nm laser. (A) Schematic illustrations of Flipper-TR as a membrane tension FLIM sensor. (B) Calibration curve of Flipper-TR against temperature. The fluorescence lifetime (τ1) of Flipper-TR, which was located at the bilayer in VPc-Lipo, was plotted against different temperatures (n = 11). Scale bar: 3 μm. (C) Visualization of membrane tension upon 808 nm laser illumination (950 μW) (NIR off: 5.3 ± 0.21 ns, NIR on: 5.2 ± 0.22 ns, n = 10). Paired t-test, *p < 0.05. Scale bar: 5 μm. (D) Bilayer permeability following 808 nm laser illumination (950 μW). The leakage of encapsulated FITC-labeled dextran of different molecular weights (4k, 40k, and 500k) was analyzed (each data point shows mean ± SD, n = 4–5). Measurements in (C and D) were performed at a baseline temperature of 23 °C.
4
4
FLIM thermometry demonstrates efficient local heating near the lipid bilayers of VPc-Lipo. (A) Schematic illustration of FLIM thermometry near the VPc-Lipo bilayer using tetramethylrhodamine (TRITC) as a FLIM temperature sensor. Transmission electron microscopy of VPc-Lipo with avidin is shown. The white triangle indicates the representative avidin structure. Scale bar: 100 nm. (B) Calibration curve of TRITC against various temperatures (mean ± SD, n = 11). The secondary axis denotes the accuracy of thermometry derived from the SD value at each data point (y = −0.037x + 1.37, R 2 = 0.99). (C) FLIM thermometry at the bilayer surface via external heating. Magnetic particles (Sicaster-M-CT) act as photothermal material in the glass-bottomed dish, generating external heat. FLIM images with and without 808 nm laser illumination (950 μW). Scale bar: 2 μm. (D) FLIM thermometry at the bilayer surface following local heating (808 nm laser: 530 and 950 μW). Scale bar: 2 μm. (E) Fluorescence change (F/F 0) of calcein release against temperature increments (ΔT) near the bilayer. ΔT was estimated from the calibration curve (B) for external and local heating (530 and 950 μW, respectively). (F) Assessment of temperature increments near the bilayer under successful calcein release conditions. The line within the box represents the median. Statistical analysis was conducted using the Holm method (n = 10). Significance denoted as ***p < 0.0001, *p < 0.05. Mean ± SD values indicate 10 ± 2.4 °C (external heating), 1.1 ± 1.4 °C (530 μW local heating), and 3.1 ± 2.5 °C (950 μW local heating).
5
5
Stabilized energy of photothermal dyes within the lipid bilayers and heat propagation through molecular dynamics simulation. (A) Extrapolated onset temperatures were measured by differential scanning calorimetry (n = 6) using the same lipid formulation as that in Figure . Each data point represents the mean ± SD. Dunnett’s multiple comparison test indicated significant differences (***p < 0.0001). (B) DPPC (lipid), SA (lipid), water molecules, and VPc dye are depicted in green, orange, pink, and yellow, respectively. (C) The potential energy of each PTD and calcein was evaluated relative to their energy in water between 3 and 10 ns (for a duration of 7 ns) after the system reached equilibrium (n = 1 MD trajectory). The simulation uses a time step of 1 fs, and the average energy and error bars were calculated from 1400 energy data points sampled every 5 ps. (D) Stability analysis of VPc in a lipid membrane composed of DPPC and SA. (E,F) Heat propagation in lipid bilayers via local heating with VPc (E) or IR792 (F). Using nonequilibrium molecular dynamics, the time constant for the lipid membrane temperature to reach 350 K from a base temperature of 300 K was estimated, and ΔT at the lipid bilayers was plotted on the y-axis (for each simulation in D–F, n = 1 MD trajectory).
6
6
Minimal thermal damage following local heating as revealed by FLIM cellular thermometry. (A) Schematic illustration of VPc-Lipo anchored to the cellular membrane via interaction with the iRGD peptide and integrin. Temperature increments during the local heating of VPc-Lipo were analyzed using FLIM-based organelle thermometers [plasma membrane: PTG and endoplasmic reticulum (ER): ETG]. The lipid of VPc-Lipo was stained with DiI dye. (B) FLIM image of PTG in HeLa cells with VPc-Lipo. Scale bar: 20 μm. (C) Temperature increments at the plasma membrane (PTG) with NIR off/on (808 nm laser, 950 μW) (n = 10). Paired t-test, *p < 0.05. (D) FLIM image of ETG in HeLa cells with VPc-Lipo. Scale bar: 10 μm. (E) Temperature increment at ER (ETG) with NIR off/on (808 nm laser, 950 μW) (n = 10). Paired t-test, not significance (NS). (F) Temperature increments estimated from the calibration curves. Mean ± SD represents 3.2 ± 2.4 °C at the lipid bilayer (950 μW), 0.88 ± 0.43 °C at the plasma membrane, and 0.39 ± 1.6 °C at ER. Tukey’s multiple comparison indicates significance (n = 10). *p < 0.05, **p < 0.01. Cellular thermometry was performed at a baseline temperature of 37 °C. The data analysis for (F) in the detail were shown in supplementary Figure S8.
7
7
Validation of the release profile of acetylcholine using near-infrared light-modulated VPc-Lipo. (A) Schematic illustration of VPc-Lipo encapsulating acetylcholine (ACh) anchored to the cellular surface, followed by 808 nm laser illumination. Spatiotemporal dynamics of ACh visualized by GACh2.0 as an ACh biosensor. (B) Fluorescence images of GACh2.0 in HEK293T cells in the absence and presence of 100 mM ACh. Scale bar: 20 μm. (C) Calibration curve correlating the normalized fluorescence intensity (F/F 0) of GACh2.0 with ACh concentration (μM) (y = 0.0458ln­(x) + 1.18, R 2 = 0.993). Each plot represents the mean ± SD (n = 8 cells). (D) Fluorescence images of VPc-Lipo (red) in HEK293T cells expressing GACh2.0 biosensor (green). Montage of ACh release from VPc-Lipo upon 808 nm laser illumination (50 ms, 950 μW). Scale bar: 10 μm. (E) Analysis of the normalized F/F 0 of GACh2.0 at different regions of interest (ROI) over time [relevant to (D)]. (F) Gradient of ACh concentration in the observation area under the microscope. Normalized F/F 0 plotted against distances from the NIR spot. Distance on the x-axis is defined as the distance from VPc-Lipo to ROI (n = 45). (G) Fluorescence responses of GACh2.0 upon sequential illumination using an 808 nm laser (five times, 50 ms). (H) Gradual decrease of normalized F/F 0 of GACh2.0 following five times illumination (mean ± SD, n = 3). (I) Schematic illustration and fluorescence image of small-sized VPc-Lipo (red) in HEK293T cells expressing GACh2.0 biosensor (green). (J) Time course analysis of the normalized F/F 0 of GACh2.0 at different ROIs within the same cell (HEK293T). Stimulation was conducted at 530 μW for 50 ms. (K) Visualization of local concentration jump of ACh [same data set as (I,J)]. All measurements were performed at a baseline temperature of 23 °C.
8
8
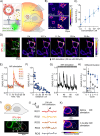
Ca2+ imaging in C2C12 myotubes induced by near-infrared light-modulated ACh release from VPc-Lipo. (A) Schematic illustration of VPc-Lipo encapsulating acetylcholine (ACh) anchored to the surface of skeletal muscle (C2C12 myotubes), followed by 808 nm laser illumination. Fluorescence images of Ca2+ sensor (Fluo-4) and VPc-Lipo (red) in C2C12 myotubes. Scale bar: 20 μm. (B) Montage of Ca2+ elevation induced by ACh release from VPc-Lipo upon 808 nm laser illumination in myotubes (five times, 50 ms, 950 μW). Scale bar: 20 μm. (C) Time course analysis of F/F 0 of Fluo-4 in a single cell. (D) Inhibition experiments with α-bungarotoxin, an ACh receptor inhibitor (5 μM). The peak of normalized F/F 0 upon 808 nm laser illumination [in the first cycle as shown in (C)] was plotted (region of interest number = 16, cell number = 8, independent 4–6 dishes). Student’s t-test indicated significant differences (***p < 0.0001). All measurements were performed at a baseline temperature of 23 °C.
9
9
Imaging of acetylcholine-evoked Ca2+signals in brain (ex vivo) using VPc-Lipo. (A) Schematic illustration of VPc-Lipo encapsulating ACh in the brain (ex vivo), followed by 808 nm laser illumination. Fluorescence images of the brain expressing jGCaMP7c as a Ca2+ sensor (green) and VPc-Lipo (red). The white-lined square area indicates the target cell for imaging, as shown in (B). Scale bar: 20 μm. (B) Montage of Ca2+ dynamics in the cell (mushroom body) near VPc-Lipo. ACh was released from VPc-Lipo upon 808 nm laser illumination (50 ms, 950 μW). Scale bar: 5 μm. The normalized fluorescence intensity (F/F 0) of jGCaMP7c was analyzed over time. (C,D) Montage of Ca2+ dynamics near the near-infrared spot during 808 nm laser illumination (five cycles, 50 ms, 950 μW). Scale bar: 20 μm. Time courses were analyzed at different regions of interest (1–9). (E) Inhibition experiments with α-bungarotoxin, an ACh receptor inhibitor (5 μM). The thick line indicates the representative data (n = 8). (F) Inhibition experiments using donepezil as an ACh esterase inhibitor (100 nM). The experimental procedure was the same as that in (C and D). Fluorescence images at the first illumination cycle (0 s) and 95 s (after the fifth illumination). Scale bar: 10 μm. All measurements were performed at a baseline temperature of 23 °C.

Similar articles

Cited by

References

    1. Baffou G., Cichos F., Quidant R.. Applications and Challenges of Thermoplasmonics. Nat. Mater. 2020;19(9):946–958. doi: 10.1038/s41563-020-0740-6. - DOI - PubMed
    1. Gu Y., Piñol R., Moreno-Loshuertos R., Brites C. D. S., Zeler J., Martínez A., Maurin-Pasturel G., Fernández-Silva P., Marco-Brualla J., Téllez P., Cases R., Belsué R. N., Bonvin D., Carlos L. D., Millán A.. Local Temperature Increments and Induced Cell Death in Intracellular Magnetic Hyperthermia. ACS Nano. 2023;17(7):6822–6832. doi: 10.1021/acsnano.3c00388. - DOI - PMC - PubMed
    1. Pan J., Xu Y., Wu Q., Hu P., Shi J.. Mild Magnetic Hyperthermia-Activated Innate Immunity for Liver Cancer Therapy. J. Am. Chem. Soc. 2021;143(21):8116–8128. doi: 10.1021/jacs.1c02537. - DOI - PubMed
    1. Marino A., Arai S., Hou Y., Degl’Innocenti A., Cappello V., Mazzolai B., Chang Y. T., Mattoli V., Suzuki M., Ciofani G.. Gold Nanoshell-Mediated Remote Myotube Activation. ACS Nano. 2017;11(3):2494–2505. doi: 10.1021/acsnano.6b08202. - DOI - PubMed
    1. Zhu D., Feng L., Feliu N., Guse A. H., Parak W. J.. Stimulation of Local Cytosolic Calcium Release by Photothermal Heating for Studying Intra- and Intercellular Calcium Waves. Adv. Mater. 2021;33(24):2008261. doi: 10.1002/adma.202008261. - DOI - PMC - PubMed

LinkOut - more resources