. 2025 Sep;21(37):e07323.
doi: 10.1002/smll.202507323. Epub 2025 Jul 27.

Moiré-Induced Enhanced Hydrogen Adsorption on Graphene

Affiliations

Moiré-Induced Enhanced Hydrogen Adsorption on Graphene

Daniel Arribas et al. Small. 2025 Sep.

Abstract

The periodic patterning induced by moiré superstructures enables the synthesis of spatially functionalized graphene surfaces owing to changes in the local reactivity of the material. However, quantitative characterization of the effect of different moiré patterns remains elusive. By exploiting the large number of moiré superstructures appearing on epitaxial graphene grown on a Pt(111) surface, this stud examines the effect of moiré-induced corrugation on the local reactivity toward hydrogenation. This work combines atomically resolved scanning tunneling microscopy alongside density functional theory and Monte Carlo simulations of hydrogen chemisorption. The findings reveal a more efficient hydrogen adsorption onto moiré patterns compared to flat graphene, with a marked selectivity toward the most topographically protruding areas of the moiré. This moiré-induced enhancement of the hydrogenation efficiency is slightly increased on the most corrugated structures, which also display longer residence times and a higher stability against thermal desorption.

Keywords: graphene; hydrogen; moiré physics; scanning tunneling microscopy.


Conflict of interest statement

The authors declare no conflict of interest.

Figures

Figure 1
Figure 1
STM images of different moiré superstructures, in increasing lattice parameter order, after deposition of 0.12 Langmuirs of atomic hydrogen/deuterium. Each moiré is denoted by the angle of rotation of the graphene with respect to the substrate. All images were acquired at room temperature except for panels c), d), which were acquired at 10 K. The corresponding supercells are highlighted with an orange rhombus in each panel. Hydrogen atoms form clusters that appear as bright features with multiple lobes and dark spots. All images in the first two rows are 10 nm × 10 nm and correspond to the following moirés: a) R30°, I = 2.72 nA, V = −250 mV, b) R19.1°, I = 1.35 nA, V = −250 mV, c) R13.9°, I = 0.95 nA, V = −240 mV (T = 10 K), d) R10.9°, I = 0.90 nA, V = 250 mV (T = 10 K), e) R9°, I = 1.27 nA, V = −450 mV, f) R4.7°, I = 0.29 nA, V = 18 mV, g) R22.1°, I = 1.00 nA, V = −1150 mV, h) R2.7°, I = 1.86 nA, V = −490 mV, i) R26.1°, I = 4.15 nA, V = 310 mV, and j) R1.7°, I = 1.50 nA, V = ‐950 mV. In Table S1 (Supporting Information), we include more details on our moiré notation.[ 27 ] Panels k), l), m), n) are high‐resolution images (2.5 nm × 2.5 nm) from clusters on moiré R30° (I = 1.40 nA, V = −240 mV), R19.1° (I = 1.35 nA, V = −250 mV), R10.9°, and R2.7° (I = 0.16 nA, V = −450 mV) respectively. See also Figure S2 (Supporting Information).
Figure 2
Figure 2
STM images (15 nm × 15 nm) taken at different voltages on a moiré R4.7°: a) −32 mV, b) −10 mV, c) 10 mV, d) 15 mV, e) Conductance. dI/dV, spectra acquired on a moiré R10.9° at 10 K temperature over a hydrogen cluster (purple) and on an area of bare graphene (green). A hydrogen‐related peak appears at 385 mV over the Fermi level on the purple curve (black arrow). f) Projected density of states (PDOS) calculated for a moiré R30° with a chemisorbed H atom. A peak appears at 285 meV composed by the states of the 1st, 2nd and 3rd carbon neighbors (blue, green, and violet, respectively, in panel h) of the chemisorbed H atom (red). g) Zoom of the hydrogen‐related peak in panel e). h) DFT calculated configuration for a H atom on a moiré R30°.
Figure 3
Figure 3
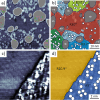
a) 50 nm × 50 nm STM topographic image on a region with several corrugated moiré structures coexisting with a flat moiré R30° in the center, where H clusters appear as bright protrusions. Boundaries between domains are defective areas that stabilize a considerable amount of hydrogen. Note that, out of the domain boundaries, hydrogen clearly tends to chemisorb on the corrugated patterns. b) Scheme of the different moiré domains appearing in the previous panel. White circles mark the position of H clusters adsorbed clearly outside the boundaries of the domains. Grey areas tagged as “nb” correspond to graphene nanobubbles (decoupled graphene that lifts from the surface). c) 10 nm × 10 nm STM current image of a region in which two moiré superstructures coexist after hydrogen deposition. The terrace in the left part presents a lower corrugation (moiré R10.9°) with respect to the right‐hand areas (moiré R9°). The bright spots on the most corrugated area correspond to hydrogen clusters. d) Color scheme of the domains shown on the previous panel. White circles mark the position of hydrogen clusters. The boundary between the domains is an atomic step (see Figure S1c, Supporting Information for the topography image).
Figure 4
Figure 4
a,c,e,g): Snapshots from our kinetic Monte Carlo simulations of deposition of 2·1013 H atoms·cm−2 s−1 for 12 s on the R30°, R19.1°, R9°, and R2.7° moiré patterns respectively. Experimental images are included for comparison in panels b,d,f,h) in the same order. Note that in all cases H is more stable at the more protruding parts of the moiré pattern and tends to cluster and form dimers, in agreement with our experimental images.
Figure 5
Figure 5
a–d) Topographic height for each carbon atom in the R30°, R19.1°, R9°, and R2.7° moiré superstructures respectively. Color scales indicate the height with respect to the lowest carbon atom (the closest to the Pt(111) surface). The blue rhombus in each panel corresponds to the unit cell of the pattern. e–h) indicate the binding energy modification of chemisorbed hydrogen atoms due only to the local curvature of the graphene sheet. Red colors correspond to higher binding energy and, therefore, more stable C—H bonds form on those atoms. i) Density of chemisorbed hydrogen atoms with respect to time for a flux of 1013 atoms cm−2 s−1. The curves are the average of 10 different simulations. The inset shows the percentage of coverage increase with respect to the flat graphene after 60 s of deposition. j) Simulated density of chemisorbed H atoms vs time for saturated graphene moiré superstructures annealed at 400 K. The inset corresponds to the simulations leading to the saturation coverage for each moiré superstructure (Flux = 1015 atoms cm−2 s−1, t = 12 s).

References

    1. Tu J., Yan M., Small 2024, 2408116. - PubMed
    1. Palacio I., Moreno M., Náñez A., Purwidyantri A., Domingues T., Cabral P. D., Borme J., Marciello M., Mendieta‐Moreno J. I., Torres‐Vázquez B., Martínez J. I., López M. F., García‐Hernández M., Vázquez L., Jelínek P., Alpuin P., Briones C., Martín‐Gago J. Á., Biosens. Bioelectr. 2023, 222, 115006 - PubMed
    1. Gao Y., Li Z., Wang P., Cui W.‐G., Wang X., Yang Y., Gao F., Zhang M., Gan J., Li C., Liu Y., Wang X., Qi F., Zhang J., Han X., Du W., Chen J., Xia Z., Pan H., Nat. Commun. 2024, 15, 928 - PMC - PubMed
    1. Banerjee S., Rappe A. M., J. Am. Chem. Soc. 2022, 144, 7181. - PubMed
    1. Wan Q., Guo H., Lin S., ACS Catal. 2022, 12, 14601.

LinkOut - more resources