. 2025 Jul;21(7):e70507.
doi: 10.1002/alz.70507.

Inhibition of the GSK3β/Nav1.6 complex suppresses early-stage Alzheimer's hyperexcitability

Affiliations

Inhibition of the GSK3β/Nav1.6 complex suppresses early-stage Alzheimer's hyperexcitability

Timothy John Baumgartner et al. Alzheimers Dement. 2025 Jul.

Abstract

Introduction: Network hyperexcitability (NH) is observed in patients with early-stage Alzheimer's disease (AD), emerging decades before cognitive decline. A key molecular determinant of NH is voltage-gated Na+ channel 1.6 (Nav1.6), which mediates action potential firing in CA1 hippocampal neurons. Ameliorating NH through inhibition of the glycogen-synthase kinase 3β (GSK3β/Nav1.6 complex may provide immediate benefits to cognition and memory and slow AD progression.

Methods: Hight-throughput virtual screening and multiple in vitro biological assays were utilized to identify compound 1063. Patch-clamp electrophysiology and electroencephalogram recordings were utilized to functionally assess 1063 in models of AD neuropathology.

Results: Building on previous studies identifying GSK3β as a modulatory protein binding to the Nav1.6 C-terminal domain (CTD), we identified 1063, a brain-penetrant small molecule that inhibits GSK3β/Nav1.6 complex assembly and reduces NH in AD rodent models.

Discussion: These results demonstrate the potential of the GSK3β/Nav1.6 complex as a therapeutic target for NH in early-stage AD.

Highlights: The glycogen synthase kinase 3-β (GSK3β)/Nav1.6 complex is a potential target for hyperexcitability in early Alzheimer's disease (AD). Compound 1063 dose-dependently decreases GSK3β/Nav1.6 complex assembly. Compound 1063 is functionally specific for Nav1.6 over other central nervous system (CNS) Nav isoforms. Ex vivo functional studies provide evidence for target engagement. 1063 dose-dependently reduces epileptiform activity in AD rodent model.

Keywords: Alzheimer's disease; amyloid beta‐induced hyperexcitability; glycogen synthase kinase 3β; nav1.6; network hyperactivity; neuronal hyperexcitability; small molecule drug discovery; voltage‐gated sodium channel.


Conflict of interest statement

The corresponding author, F.L., is the founder and president of IonTx Inc. (Friendswood, TX, USA), a start‐up company focusing on developing regulators of voltage‐gated Na+ channels, and T.J.B is a consulant and M.L. is an employee. The remaining authors do not have any potential conflicts of interest to report. Author disclosures are available in the supporting information.

Figures

FIGURE 1
FIGURE 1
Identification of hits using HTVS. (A) Workflow of grid identification and filtering utilized for HTVS. (B) 3D structural prediction of GSK3β in complex with the Nav1.6 CTD. (C) 3D structural prediction of GSK3β in complex with the Nav1.1 CTD. (D) 3D structural prediction of GSK3β in complex with the Nav1.2 CTD. (E) Summary of filtering used for virtual screening. First, compounds were selected exhibiting a docking score ≤ −3.5. Of the remaining compounds, those exhibiting a glide H‐bond score of ≤ −0.5 with GSK3β Tyr288 were selected for further evaluation. Compounds from this pool were analyzed for correct binding orientation, leading to the selection of the top 4 four hits. (F) Summary of compound 0718 structure, docking and glide H‐bond scores, and 2D docking with GSK3β. (G) Summary of compound 0276 structure, docking and glide H‐bond scores, and 2D docking with GSK3β. (H) Summary of compound 1413 structure, docking and glide H‐bond scores, and 2D docking with GSK3β. (I) Summary of compound 1063 structure, docking and glide H‐bond scores, and 2D docking with GSK3β. CTD, C‐terminal domain; GSK3β, glycogen synthase kinase 3‐β; HTVS, high‐throughput virtual screen.
FIGURE 2
FIGURE 2
Experimental evaluation of hit compounds. (A–D) Dose–response curves and chemical structures of HTVS hits 0718 (A), 0276 (B), 1413 (C), and 1063 (D) against the GSK3β/Nav1.6 complex in the LCA. Each compound was tested at eight concentrations (range: 0.5–150 µM, n = 4 replicates per concentration) in 96‐well plates. Data are shown as mean percent luminescence normalized to per plate 0.5% DMSO controls. Compound 1063 (blue) displayed an IC50 of 26.2 µM and was selected for further evaluation. (E) Representative sensogram showing the protein‐ligand binding relationship between 1063 and GSK3β. Colors of each trace represent increasing concentrations of 1063 (0.5–150 µM). (F) Curve‐fitting of representative sensogram of 1063 and GSK3β. (G) Protein‐binding relationship between GSK3β and Nav1.6 with vehicle (0.5% DMSO) (black) or 20 µM 1063 (blue). (H) Curve fitting of representative sensograms of GSK3β/Nav1.6 binding with 0.5% DMSO (black) or 20 µM 1063 (blue). Data are shown as mean ± SEM. DMSO, dimethyl sulfoxide; GSK3β, glycogen synthase kinase 3‐β; HTVS, high‐throughput virtual screen; LCA, luciferase complementation assay; SEM, standard error of the mean.
FIGURE 3
FIGURE 3
Biological characterization of 1063. (A) Molecular docking of 1063 (yellow sticks) and CHIR99021 (orange sticks) within their respective predicted binding pocket of GSK3β (green, cartoon representation; PDB ID: 1J1C). (B) Evaluation of 1063 (blue) and CHIR99021 (green) in GSK3β kinase activity assay. (C) Real‐time LCA output from HEK293 cells transfected with CD4‐Nav1.6‐NLuc and GSK3β‐CLuc following the indicated experimental treatment: Vehicle (DMSO 0.5%, black), 2 µM CHIR99021 (red), 50 µM 1063 (light blue), or 2 µM CHIR + 50 µM 1063 (dark blue). (D) Bar graph comparison of the experimental groups indicated in (C). In (B, D), significance was assessed using an ordinary one‐way ANOVA with post hoc Dunnett's multiple comparisons test.; *, p < 0.05, **, p < 0.01, ***, p < 0.001, ****, p < 0.0001; n = 8–12. Data are shown as mean ± SEM. DMSO, dimethyl sulfoxide; GSK3β, glycogen synthase kinase 3‐β; LCA, luciferase complementation assay; SEM, standard error of the mean.
FIGURE 4
FIGURE 4
1063 selectively modulates Nav1.6 channel activity. Representative traces of transient I Na elicited in cells expressing Nav1.6 (A), Nav1.1 (E), or Nav1.2 (I) treated with 0.1% DMSO (black) or 20 µM 1063 (Nav1.6, blue; Nav1.1, orange; Nav1.2, green). (B, F, J) Comparison of peak I Na density in Nav1.6 (B), Nav1.1 (F), or Nav1.2 (J) cells treated with DMSO or 20 µM 1063. (C, J, K) Comparison of V1/2 of activation in Nav1.6 (C), Nav1.1 (J), or Nav1.2 (K) experimental groups. (D, H, L) Comparison of V1/2 of steady‐state inactivation in Nav1.6 (D), Nav1.1 (H), or Nav1.2 (L) experimental groups. In (B–D, F–H, J–L) n = 7–13 cells/group, data are individual replicates with SEM error bars. In (B–D, F–H, J–L), significance was assessed using an unpaired t‐test. *, p < 0.05; ***, p < 0.001; ****, p < 0.0001. DMSO, dimethyl sulfoxide; SEM, standard error of the mean.
FIGURE 5
FIGURE 5
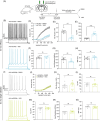
1063 decreases excitability in 3xTg‐AD mice in a GSK3β‐dependent manner. (A) Workflow illustrating the process of in vivo AAV‐mediated genetic silencing of GSK3β for target validation. (B) Representative traces of action potentials fired by CA1 neurons in slices from 3xTg‐AD mice treated with vehicle (AAV‐shCTRL+DMSO, black) or 20 µM 1063 (AAV‐shCTRL+1063, light blue) at the 220‐pA injected current step. (C) Number of action potentials fired by CA1 neurons over a range of injected current stimuli among indicated experimental groups. (D) Comparison of the maximum number of action potentials (Ithr) of CA1 neuron action potential initiation among the indicated experimental groups. (F) Comparison of the voltage threshold (Vthr) of CA1 neuron action potential initiation among the indicated experimental groups. (G) Comparison of input resistance (MOhm) among indicated experimental groups. (H) Comparison of resting membrane potential (RMP) among indicated experimental groups. (I) Representative traces of action potentials fired by CA1 neurons in slices from 3x‐Tg‐AD mice stereotaxically injected with shGSK3β and treated with vehicle (AAV‐shGSK3β+DMSO, gray) or 20 µM 1063 (AAV‐shGSK3β+1063, gold) at the 220‐pA injected current step. (J) Number of action potentials fired by CA1 neurons over a range of injected current stimuli among indicated experimental groups. (K) Comparison of the maximum number of action potentials fired by CA1 neurons among the indicated experimental groups. (L) Comparison of the current threshold (Ithr) of CA1 neuron action potential initiation among the indicated experimental groups. (M) Comparison of the voltage threshold (Vthr) of CA1 neuron action potential initiation among the indicated experimental groups. (N) Comparison of input resistance (MOhm) among indicated experimental groups. (O) Comparison of resting membrane potential (RMP) among indicated experimental groups. Data are mean ± SEM (n = 8 neurons/group; slices from N = 3 mice per group). Data shown are individual replicates with SEM error bars (n = 7–8 cells/group). In (C, I), * denotes injected current steps at which p is at least <0.05 between the indicated experimental groups. In (C–H, J–O) *, p < 0.05, ***, p < 0.001;****, p < 0.0001. Statistical significance was assessed using an unpaired t‐test. Schematics using Biorender. DMSO, dimethyl sulfoxide; SEM, standard error of the mean.
FIGURE 6
FIGURE 6
In vivo EEG evaluation of 1063 on epileptiform activity. (A) EEG traces from the parietal cortex of nontransgenic (NTG; top) and J20‐APP (bottom) mice in wakefulness or NREM sleep show predominance of epileptiform spikes in sleep. Inset shows expanded view of epileptiform spike* under the EEG trace. (B) IP injection of 1063 at start of light period (arrowhead) reduced epileptiform spikes compared to vehicle in the same mouse. (C) 1063 reduction of epileptiform spike rate in NREM was dose dependent. (D) Overall time spent in NREM was slightly increased by 1063, reaching significance at 25 mg/kg. Data represent first 2 h of EEG recordings after i.p. injection of vehicle or 1063. N = 3 mice. Data presented as mean ± SEM. (C, D) One‐way repeated measures ANOVA with Bonferroni correction for pairwise comparisons. *p < 0.05 **p < 0.01, ***p < 0.001, ****p < 0.0001. ANOVA, analysis of variance; EEG, electroencephalogram; IP, intraperitoneal; NREM, non–rapid eye movement.

Similar articles

References

    1. Dickerson BC, Salat DH, Greve DN, et al. Increased hippocampal activation in mild cognitive impairment compared to normal aging and AD. Neurology. 2005;65(3):404‐411. doi: 10.1212/01.wnl.0000171450.97464.49 - DOI - PMC - PubMed
    1. Filippini N, MacIntosh BJ, Hough MG, et al. Distinct patterns of brain activity in young carriers of the APOE‐Ε4 Allele. Proc Natl Acad Sci USA. 2009;106(17):7209‐7214. doi: 10.1073/pnas.0811879106 - DOI - PMC - PubMed
    1. Hämäläinen A, Pihlajamäki M, Tanila H, et al. Increased fMRI responses during encoding in mild cognitive impairment. Neurobiol Aging. 2007;28(12):1889‐1903. doi: 10.1016/j.neurobiolaging.2006.08.008 - DOI - PubMed
    1. Bookheimer SY, Strojwas MH, Cohen MS, et al. Patterns of brain activation in people at risk for Alzheimer's disease. N Engl J Med. 2000;343(7):450‐456. doi: 10.1056/NEJM200008173430701 - DOI - PMC - PubMed
    1. Setti SE, Hunsberger HC, Reed MN. Alterations in hippocampal activity and Alzheimer's disease. Transl Issues Psychol Sci. 2017;3(4):348‐356. doi: 10.1037/tps0000124 - DOI - PMC - PubMed

Substances