

Leptin, CRP, and adiponectin correlate with body fat percentage in adolescents: systematic review and meta-analysis
- PMID: 40717997
- PMCID: PMC12289669
- DOI: 10.3389/fnut.2025.1560080
Leptin, CRP, and adiponectin correlate with body fat percentage in adolescents: systematic review and meta-analysis
Abstract
Introduction: Adipose tissue is important in the secretion of inflammatory substances, and may be directly or indirectly associated to the development of cardiovascular and metabolic diseases in adolescence.
Objective: To evaluate whether inflammatory markers are associated to body fat percentage in adolescents.
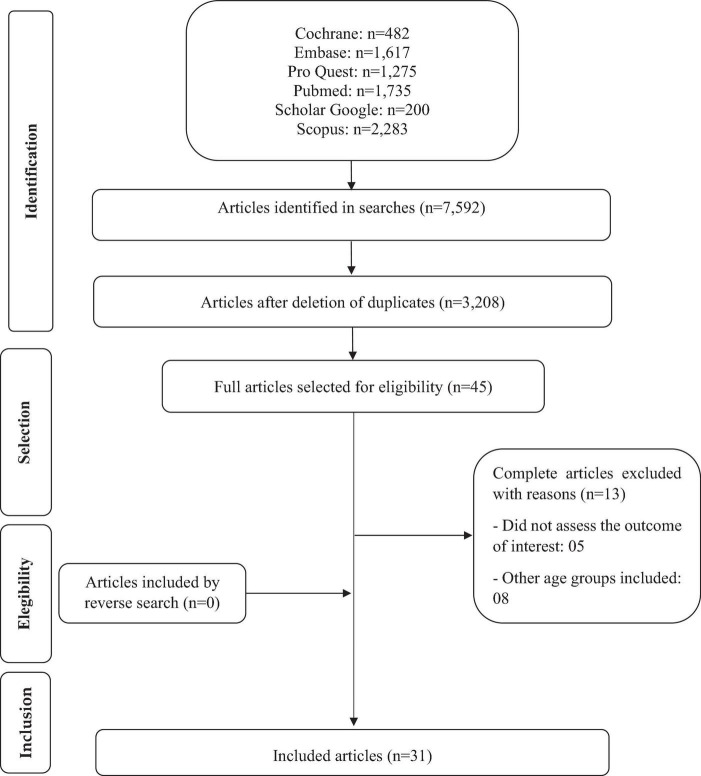
Methodology: Systematic review conducted following the items of the PRISMA, and registered in PROSPERO. The descriptors adolescent, body fat distribution and cytokines were combined together in the electronic databases: Scopus, PubMed, Embase, Cochrane, Scholar Google and ProQuest, independently by two researchers, in January 2022 and atualized in November 2024. Meta-analysis of the correlation of inflammatory markers with body fat percentage was conducted using the metabin function of the meta package of the RStudio software (4.0.4).
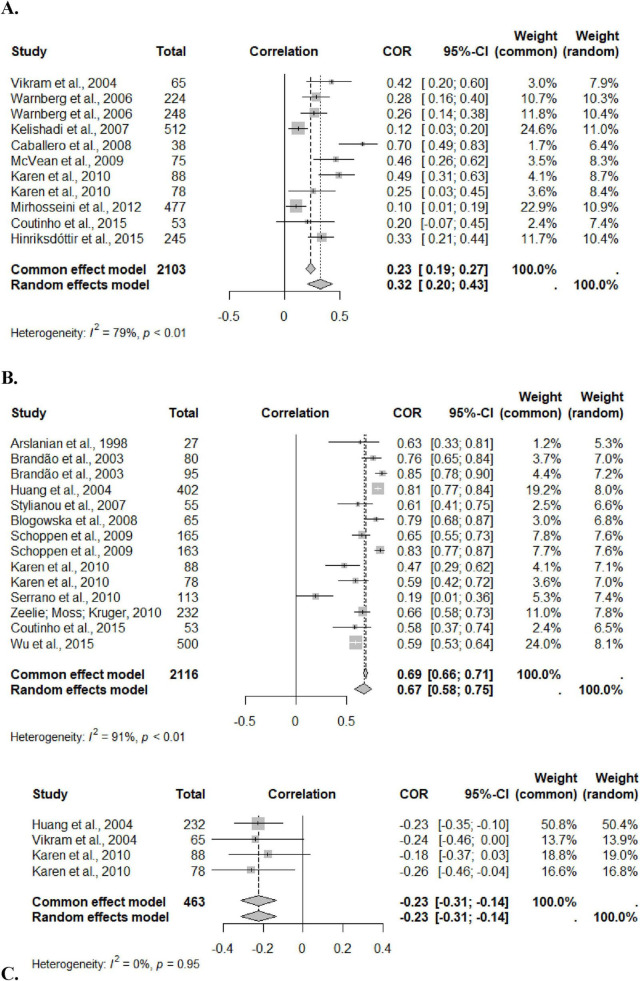
Results: Resulted in 7,592 records, of which 31 articles met the inclusion criteria and were selected for this study. Cross-sectional and prospective cohort observational studies were included. The meta-analysis included 4,682 adolescents, aged 10 to 19 years, of both sexes. The inflammatory markers leptin and C-reactive protein were positively correlated (r = 0.67; r = 0.32) and adiponectin was negatively correlated (r = -0.23) with body fat percentage in adolescents of both sexes.
Conclusion: In adolescents, the body fat percentage is related to the inflammatory markers leptin, C-reactive protein and adiponectin. It is important to evaluate the body fat composition of adolescents in clinical practice to identify those with a higher percentage of fat, that may reflect an inflammatory profile, as well as increased cardiometabolic risk that accompanies adolescents into adulthood.
Systematic review registration: https://www.crd.york.ac.uk/PROSPERO/view/CRD42020208305, identifier PROSPERO: CRD42020208305.
Keywords: adipose tissue; adolescence; body composition; cardiometabolic risk; inflammatory markers.
Copyright © 2025 Rocha, Morais, Azevedo, Morais, Pereira, Peluzio, Franceschini and Priore.
Conflict of interest statement
The authors declare that the research was conducted in the absence of any commercial or financial relationships that could be construed as a potential conflict of interest.
Figures
Similar articles
-
Education support services for improving school engagement and academic performance of children and adolescents with a chronic health condition.Cochrane Database Syst Rev. 2023 Feb 8;2(2):CD011538. doi: 10.1002/14651858.CD011538.pub2. Cochrane Database Syst Rev. 2023. PMID: 36752365 Free PMC article.
-
[Volume and health outcomes: evidence from systematic reviews and from evaluation of Italian hospital data].Epidemiol Prev. 2013 Mar-Jun;37(2-3 Suppl 2):1-100. Epidemiol Prev. 2013. PMID: 23851286 Italian.
-
Systemic pharmacological treatments for chronic plaque psoriasis: a network meta-analysis.Cochrane Database Syst Rev. 2021 Apr 19;4(4):CD011535. doi: 10.1002/14651858.CD011535.pub4. Cochrane Database Syst Rev. 2021. Update in: Cochrane Database Syst Rev. 2022 May 23;5:CD011535. doi: 10.1002/14651858.CD011535.pub5. PMID: 33871055 Free PMC article. Updated.
-
The Influence of Web-Based Tools on Maternal and Neonatal Outcomes in Pregnant Adolescents or Adolescent Mothers: Mixed Methods Systematic Review.J Med Internet Res. 2021 Aug 26;23(8):e26786. doi: 10.2196/26786. J Med Internet Res. 2021. PMID: 34435961 Free PMC article.
-
Systemic pharmacological treatments for chronic plaque psoriasis: a network meta-analysis.Cochrane Database Syst Rev. 2020 Jan 9;1(1):CD011535. doi: 10.1002/14651858.CD011535.pub3. Cochrane Database Syst Rev. 2020. Update in: Cochrane Database Syst Rev. 2021 Apr 19;4:CD011535. doi: 10.1002/14651858.CD011535.pub4. PMID: 31917873 Free PMC article. Updated.
References
-
- World Health Organization (WHO). Nutrition in Adolescence: Issues and Challenges for the Health Sector: Issues in Adolescent Health and Development. Geneva: WHO; (2005).
-
- Ministry of Health. Department of Programmatic and Strategic Actions. Protecting and Caring for the Health of Adolescents in Primary Care. Ministry of Health, Secretariat of Health Care, Department of Programmatic and Strategic Actions. 2nd ed. Brasília: Ministry of Health; (2018).
-
- Priore S, Faria F, Franceschini S. Adolescence. In: Priore SE, et al. editors. Nutrição e Saúde na Adolescência. Rio de Janeiro: Rúbio; (2010). p. 1–7.
-
- Barbalho E, Pinto F, Silva F, Sampaio R, Dantas D. Influência do consumo alimentar e da prática de atividade física na prevalência do sobrepeso/obesidade em adolescentes escolares. Caderno de Saúde Coletiva. (2020) 28:12–23. 10.1590/1414-462X202028010181 - DOI
Publication types
LinkOut - more resources
Full Text Sources
Research Materials
Miscellaneous