. 2025 Jul 21:43:102160.
doi: 10.1016/j.bbrep.2025.102160. eCollection 2025 Sep.

Alkaline phosphatase-streptavidin conjugate (APSA) enzyme and binding activity over time and storage conditions

Affiliations

Alkaline phosphatase-streptavidin conjugate (APSA) enzyme and binding activity over time and storage conditions

Nan Cheng et al. Biochem Biophys Rep. .

Abstract

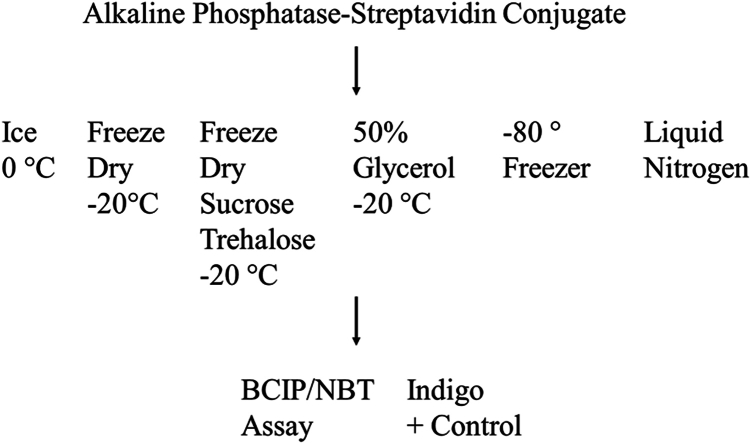
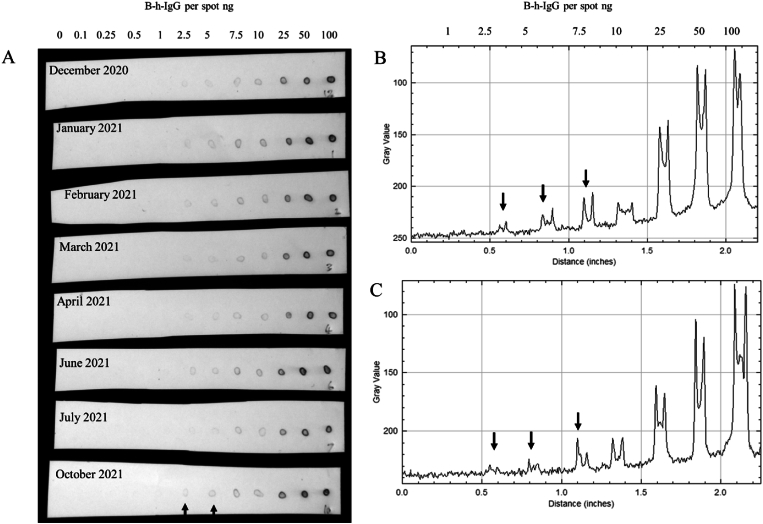
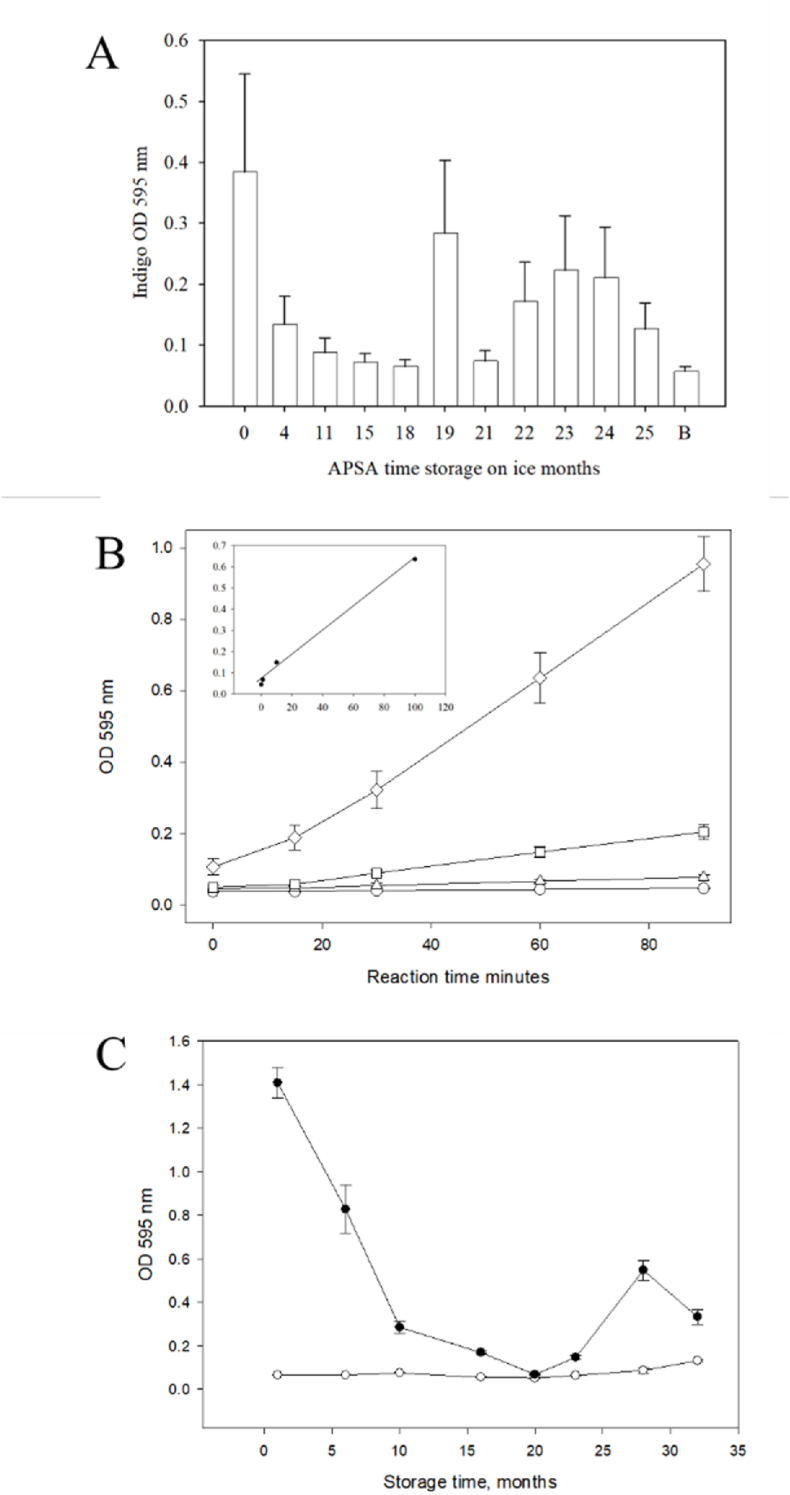
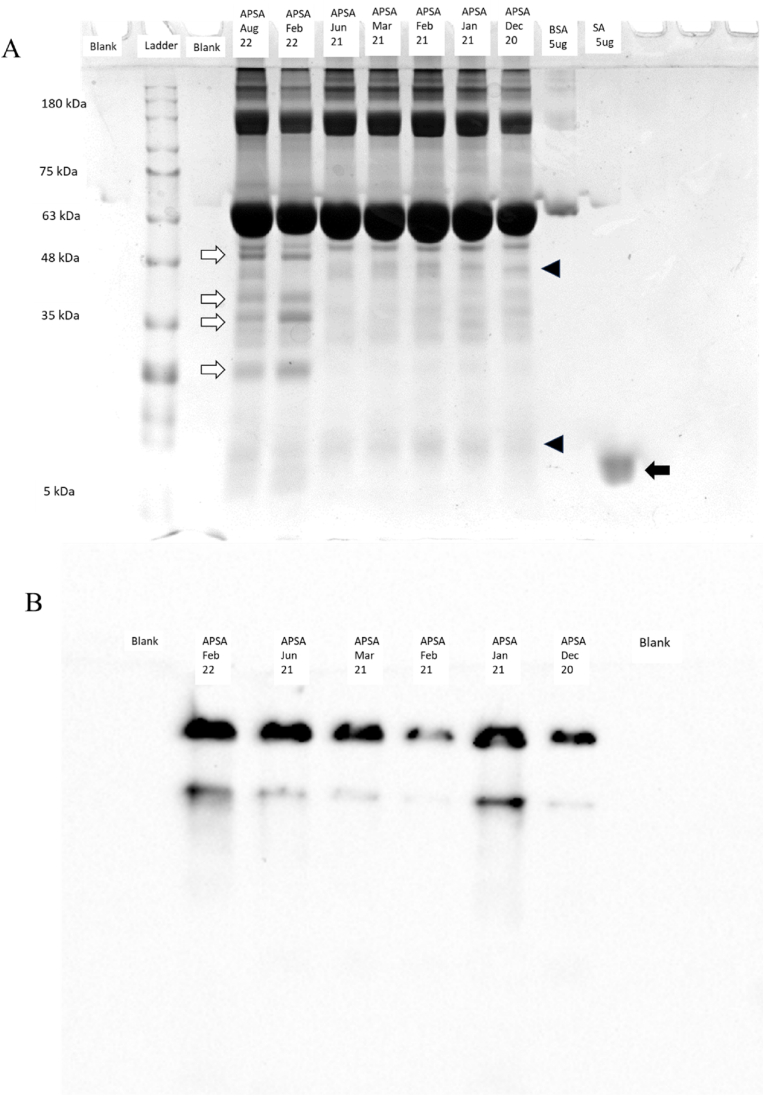
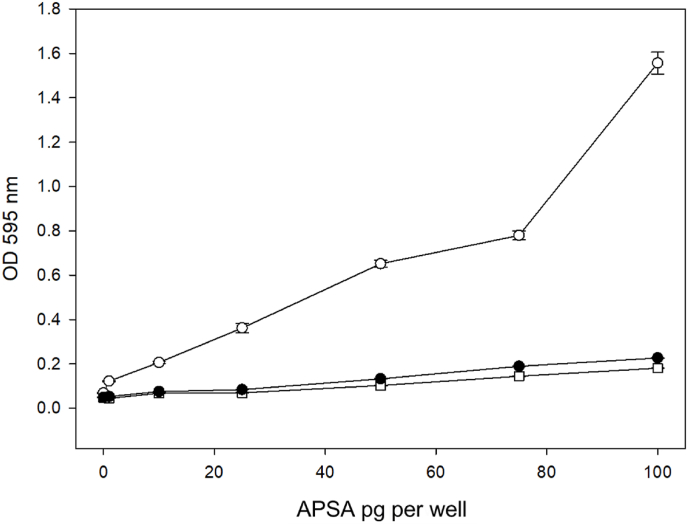
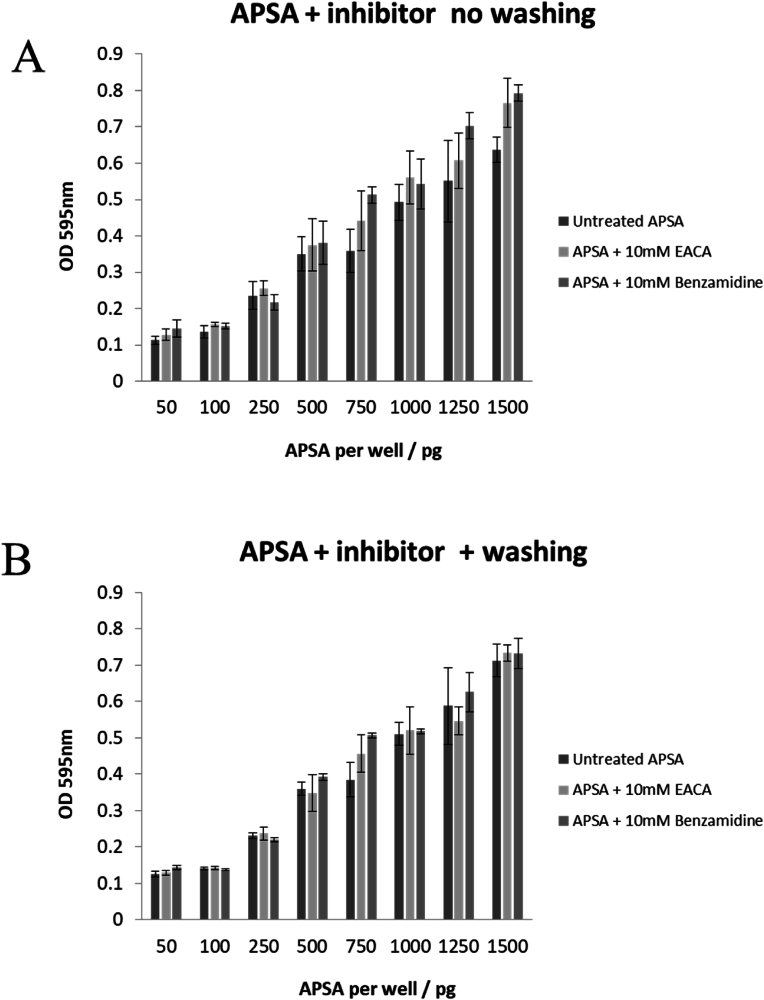
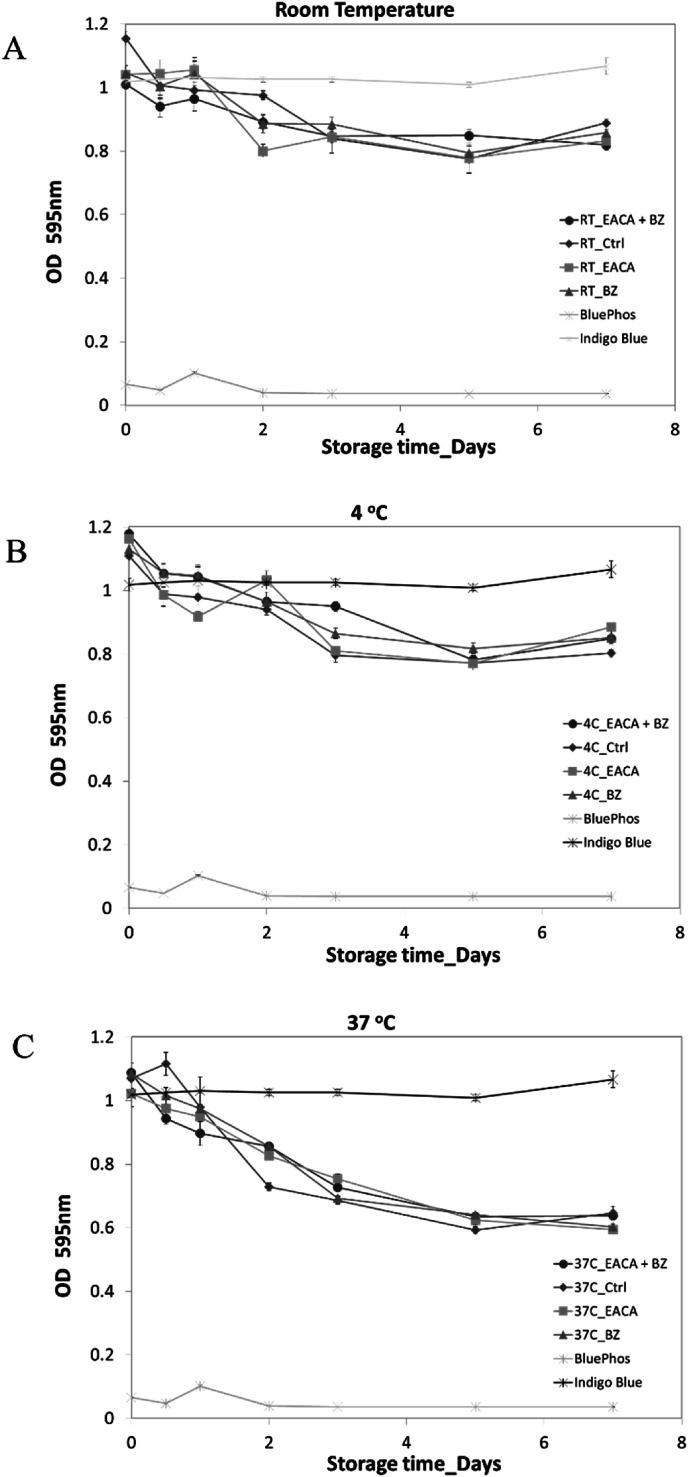
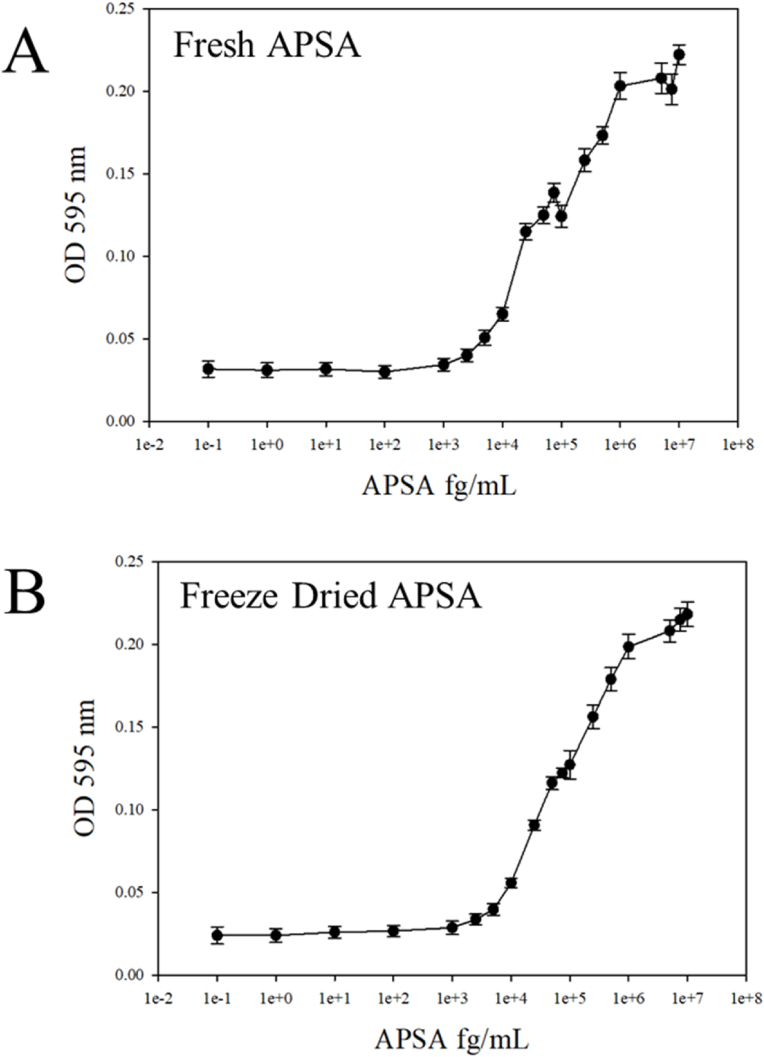
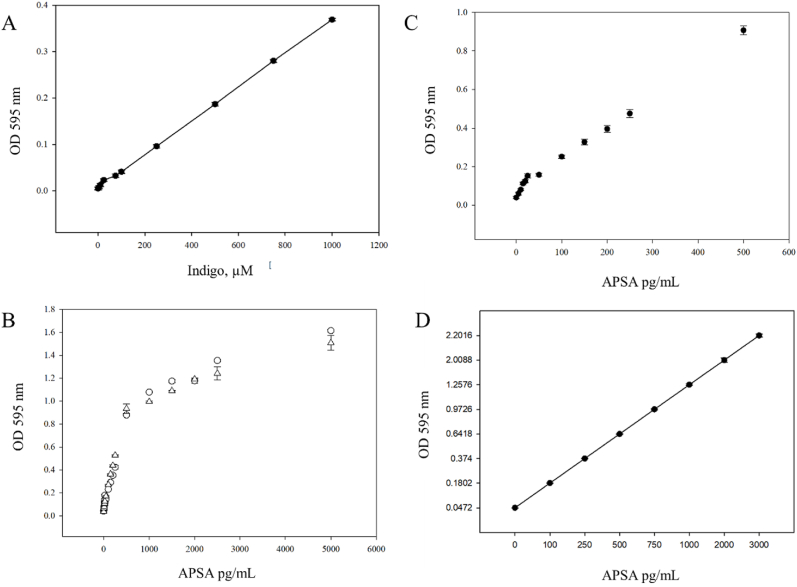
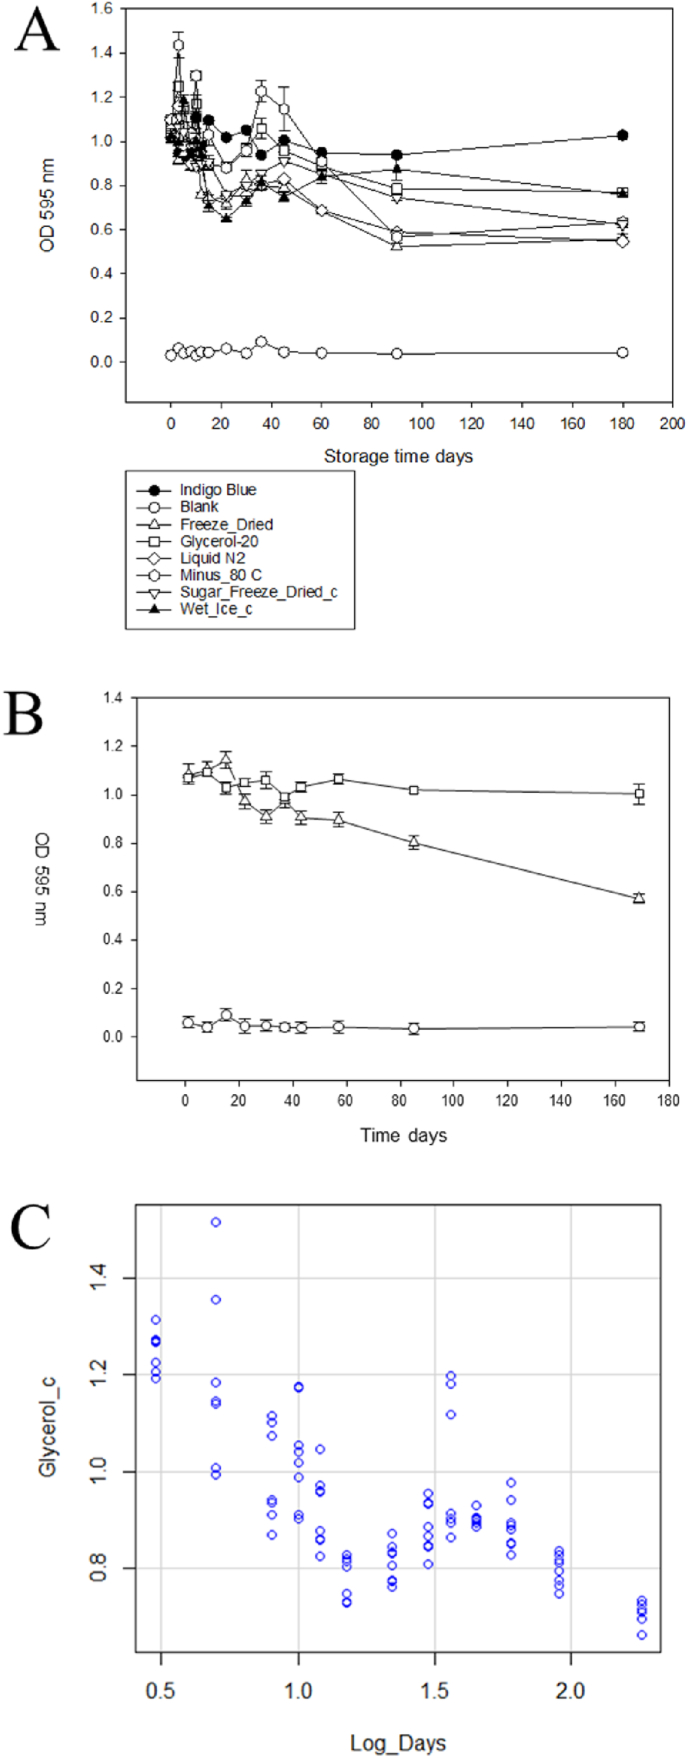
Alkaline phosphatase (AP) linked to streptavidin (SA) in the form of the APSA enzyme conjugate is required for diagnostic screening for a variety of clinical conditions world wide. The enzyme activity of APSA conjugates in the liquid phase showed variation across samples that declined with storage time. Random sampling of the enzyme activity in the liquid phase (ANOVA p < 2E-16; Regression p < 0.043) and the binding plus enzyme activity of APSA in the model assay (R2 > 0.99) of biotinylated human IgG (B-h-IgG) directly adsorbed to 96 well plates showed a similar loss of function over time (ANOVA p < 9.15E-15, Regression p <1.1E-9). The enzyme AP showed little dissociation from the SA moiety while proteolysis of the BSA carrier was observed. Covalent protease inhibitors 4-(2-aminoethyl)benzenesulfonyl fluoride hydrochloride (AEBSF) or tosyl-l-lysine chloromethyl ketone hydrochloride (TLCK) abrogated AP enzyme activity, but the competitive inhibitors epsilon-aminocaproic acid (EACA) and benzamidine (BNZ) had no protective effect on APSA activity over time. Samples of APSA showed large variation in enzyme activity (p ≤ 2E-16) and so were titrated by the colorimetric assay and standardized against indigo blue in DMSO to achieve an initial OD value of ∼1.0 at 595 nm prior to following activity over storage time. After titration, the effect of temperature, addition of glycerol prior to freezing, and freeze drying with or without trehalose and sucrose, on alkaline phosphatase activity was compared using a sampling schedule over storage time. The alkaline phosphate activity was not immediately sensitive to freeze-drying but was sensitive to storage time and ultra-low temperatures, but the addition of sugars or glycerol to the APSA prevented some of the activity loss. Storage of APSA on wet ice or in 50 % glycerol at -20 °C retained about 50 % of the starting optical density reading of APSA after 170 days in storage.

Keywords: APSA, alkaline phosphatase streptavidin conjugate; BCIP/NBT; Freezing, freeze drying; Glycerol, sucrose, trehalose; Protease inhibitors; Storage conditions.


Conflict of interest statement

The authors declare no conflict of interest.

Figures

Image 1
Graphical abstract
Fig. 1
Fig. 1
Random sampling of alkaline phosphatase streptavidin (APSA) with different storage duration on wet ice in the fridge (0–4 °C) by detection of biotinylated human IgG (B-h-IgG) dot blots on PVDF. Panels: A, Image of B-h-IgG dot blots on PVDF membranes and detected by APSA using the BCIP/NBT assay; B, image analysis of B-h-IgG samples on PVDF test strips reacted with fresh APSA; C, image analysis of B-h-IgG on PVDF test strips with APSA stored on wet ice for 22 months. Note the APSA conjugate retains the capacity to bind the B-h-IgG target on the solid phase over time yielding a circular pattern. All sampled reacted alongside the fresh sample from October 2021.
Fig. 2
Fig. 2
Random sampling of the APSA sample vials for the liquid phase enzyme activity and the solid phase binding activity to biotinylated human IgG (B-h-IgG) in 96 well plates. Panels: A, the sample variation in alkaline phosphatase activity of APSA conjugates measured over time per unit volume at a dilution factor (DF) of 1 in 250,000 (DF 250,000) in the liquid phase enzyme assay in 96 well plates (ANOVA p < 2E-16, Regression Intercept p ≤ 2.49E-10, p < 0.0435); B, the solid phase B-h-IgG assay in 96 well polystyrene plates reacted for 90 min with BluePhos substrate and measurement of optical density (OD) at 595 nm; Symbols: (○) 0 ng B-h-IgG; (△)1 ng B-h-IgG; (□) 10 ng B-h-IgG; (◇) 100 ng B-h-IgG (R2 = 0.99, p-value: 0.002483) [Inset, linearity of APSA reaction from the 0, 1, 10 &100 ng per well]; C, APSA solid phase binding assay to B-h-IgG (100 ng per well) over storage time measured with stored on ice within a 4 °C refrigerator were compared to show the effect of sample to sample variation and storage time on both B-h-IgG binding activity and APSA catalytic activity. Symbols: (○) 0 ng B-h-IgG; (•) 100 ng B-h-IgG (ANOVA p < 9.15 E -15, Regression log months, R2: 0.7048, F-statistic: 75.01 on 1 and 30 DF, p-value <1.1E-9).
Fig. 3
Fig. 3
Analysis of the APSA conjugate by polyacrylamide gel electrophoresis. Panels: A, SDS-PAGE and Coomasie blue staining of the APSA conjugate stored on ice over time (Bands that fade, open arrow; Bands that appear black triangle; solid arrow, streptavidin); B, Native PAGE of APSA conjugate for Western blot with HRP-SA followed by ECL detection.
Fig. 4
Fig. 4
Effect of protease TLCK and AEBSF inhibitors on alkaline phosphatase activity on 96 well polystyrene plates. Untreated enzyme conjugate (○), TLCK treated (•) and AEBSF treated (□). Mean (n = 4) plus standard error shown.
Fig. 5
Fig. 5
Effect of binding and/or washing of competitive protease inhibitor epsilon-aminocaproic acid (EACA) and benzamidine (BNZ) on immobilized APSA activity. Panels: A, immobilized APSA enzyme activity measured in the presence of competitive protease inhibitors; B, immobilized APSA enzyme activity measured after washing away competitive protease inhibitors. Mean (n = 4) plus standard error shown. The OD 595 nm is shown after correction against the blank (0 pg APSA).
Fig. 6
Fig. 6
Scheduled sampling of the effect of storage temperature on APSA activity with and without the protease inhibitors. The effect of epsilon-aminocaproic acid (EACA) and/or benzamidine (BNZ) on liquid phase APSA activity over time on ice, at room temperature and at 37 °C is shown. Mean (n = 4) plus standard deviation shown. Panels: A, time course at room temperature; B, time course at 4 °C over 7 days; C, time course at 37 °C.
Fig. 7
Fig. 7
The effect of freeze drying on APSA activity. Fresh and freeze dried (24 h) APSA were titrated from the pico gram to nano gram per well immediately after freeze drying. Freeze dried APSA with a 1:1 ratio of 1 M sucrose and 1 M trehalose was resuspended and serially diluted in 20 mM tris HCl pH 8.85 at concentrations ranging from the femto gram (fg) to nano gram (ng) to reveal the detection limit. Panels: A, untreated control; B, freeze-dried in sucrose and trehalose. The samples were reacted with the BlusPhos dye and absorbance measured at 595 nm in a 96 well plate.
Fig. 8
Fig. 8
The standardization of the APSA enzyme conjugate by indigo blue in the Tween 20 enzyme reaction buffer for time of storage experiments. Panels: A, The dilution of the indigo blue in the reaction buffer with 1 % Tween 20 to serve as an analytical positive control at 1 OD unit is shown; B, titration of APSA conjugate to reach a starting OD 595 nm value of 1.0 [Symbols: (○) APSA sample one; APSA sample two (△)]; C The dilution of the APSA sample to yield 1 OD unit was established by UV/VIS analysis of the dilution curve; D, The broad linear range standard curve of APSA (100 pg/mL to 3 ng/mL) measured by the colorimetric BluePhos assay. Regression, Adjusted R2: 0.9933 F-statistic: 1629 on 1 and 10 DF, p-value: 2.088E-12. Mean (n = 4) 100 μL reactions plus standard error shown.
Fig. 9
Fig. 9
Comparison of the change of APSA's activity at different storage conditions over 25 weeks of storage. Panels: A, comparison of 6 different storage treatments and each mean represents 2 independent samples each with 4 technical replicates (n = 4); B, independent replication of the best result which is APSA in 50 % glycerol at −20 °C (△). The indigo blue dissolved in 10 % DMSO served as a positive control (□) [regression indicates that 200 μL of 840 μM indigo in 10 % DMSO is where OD = 1.0 at 595 nm]. The blank served as a negative control (○); C, regression of three independent samples of 50 % glycerol at −20 °C with three technical replicates contributing to each mean symbol shown (Adjusted R2: 0.5634, F-statistic: 133.9 on 1 and 102 DF, p-value: <2.2E-16). Mean (n = 4) plus standard error shown.

Similar articles

References

    1. Blake M.S., et al. A rapid, sensitive method for detection of alkaline phosphatase-conjugated anti-antibody on Western blots. Anal. Biochem. 1984;136(1):175–179. - PubMed
    1. Cook D.B., Self C.H. Determination of one thousandth of an attomole (1 zeptomole) of alkaline phosphatase: application in an immunoassay of proinsulin. Clin. Chem. 1993;39(6):965–971. - PubMed
    1. Fernley H.N., Walker P.G. Studies on alkaline phosphatase. Inhibition by phosphate derivatives and the substrate specificity. Biochem. J. 1967;104(3):1011–1018. - PMC - PubMed
    1. Simopoulos T.T., Jencks W.P. Alkaline phosphatase is an almost perfect enzyme. Biochemistry. 1994;33(34):10375–10380. - PubMed
    1. Self C.H. Enzyme amplification--a general method applied to provide an immunoassisted assay for placental alkaline phosphatase. J. Immunol. Methods. 1985;76(2):389–393. - PubMed

LinkOut - more resources