. 2025 Jul 11:16:1637569.
doi: 10.3389/fimmu.2025.1637569. eCollection 2025.

Trichinella spiralis-derived extracellular vesicles induce regulatory T cells and reduce airway allergy in mice

Affiliations

Trichinella spiralis-derived extracellular vesicles induce regulatory T cells and reduce airway allergy in mice

Sofija Glamočlija et al. Front Immunol. .

Abstract

Introduction: Respiratory allergies are an increasing global health concern, with current treatments primarily targeting symptoms rather than underlying immune dysregulation. Trichinella spiralis-derived extracellular vesicles (TsEVs) have been implicated in modulating immune responses, but their role in allergic airway inflammation remains unexplored. This study investigates the immunomodulatory potential of TsEVs in mitigating ovalbumin (OVA)-induced allergic airway inflammation in mice.

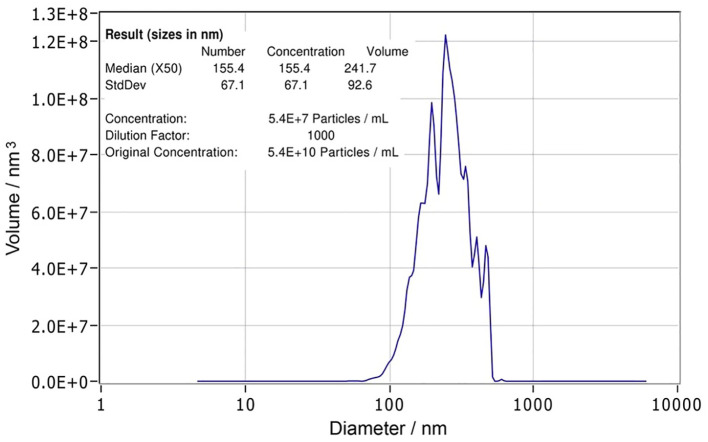
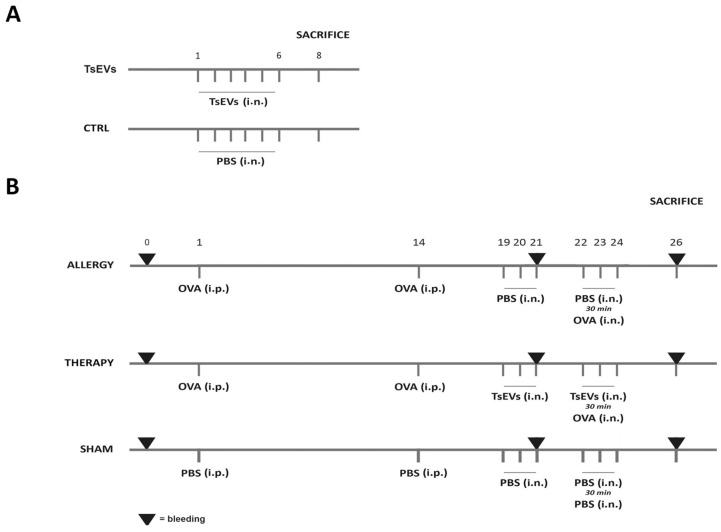
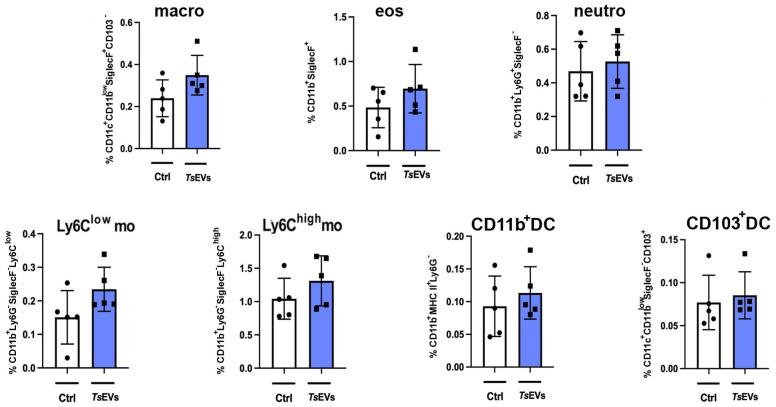
Methods: TsEVs were isolated from T. spiralis muscle larvae excretory-secretory products and characterized using nanoparticle tracking analysis. BALB/c mice were sensitized and challenged intranasally with OVA to induce respiratory allergy. TsEVs were administered intranasally before and during OVA challenge. Bronchoalveolar lavage fluid (BALF), lung tissue, spleens, and sera were analyzed for immune cell infiltration, cytokine production, regulatory T cell (Treg) expansion, and OVA-specific antibodies using histology, flow cytometry, and ELISA.

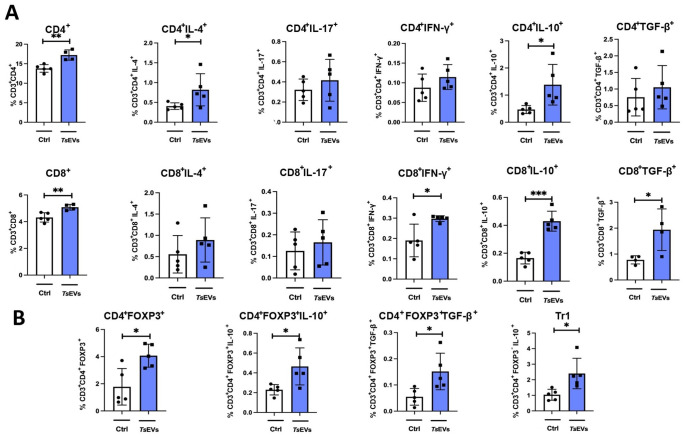
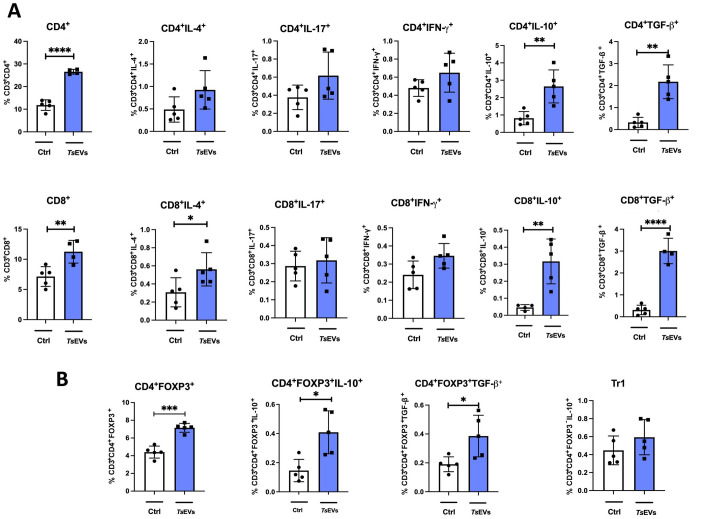
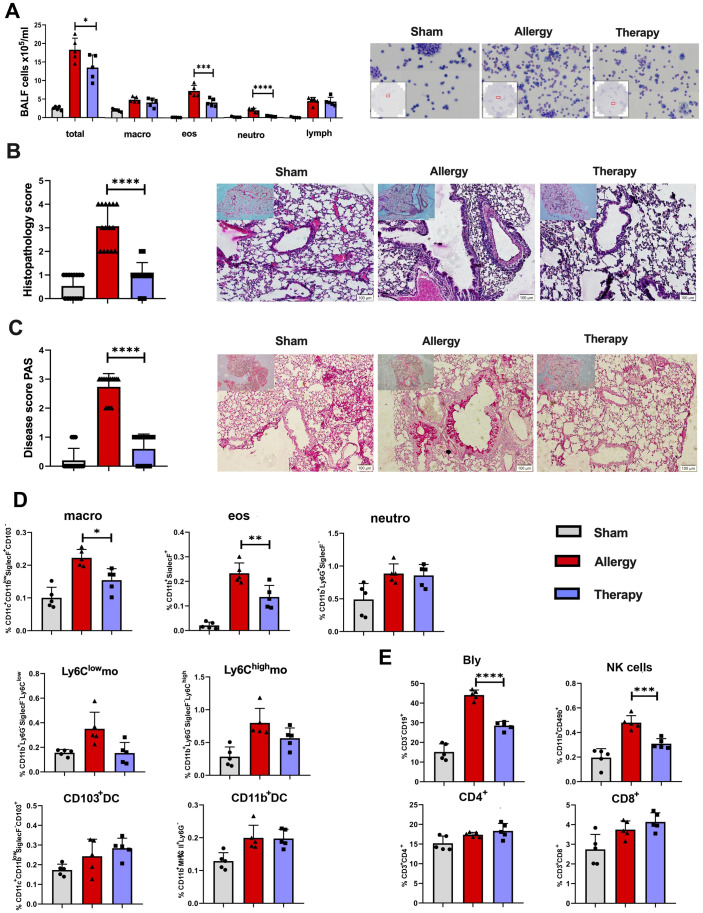
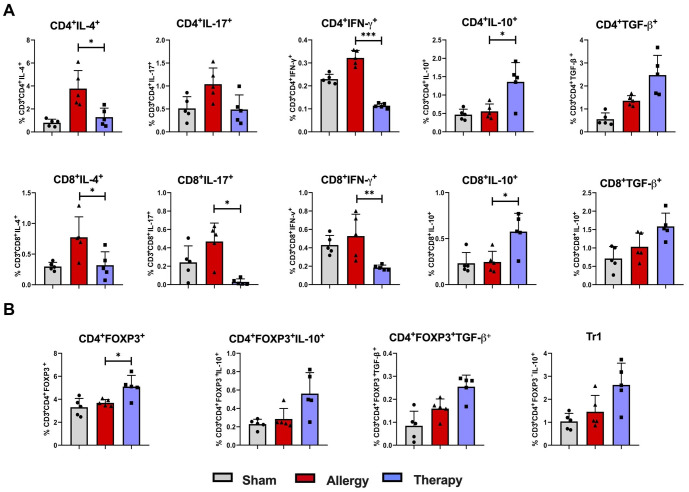
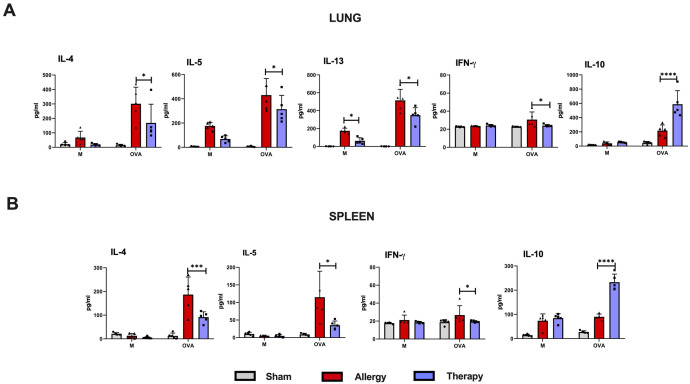
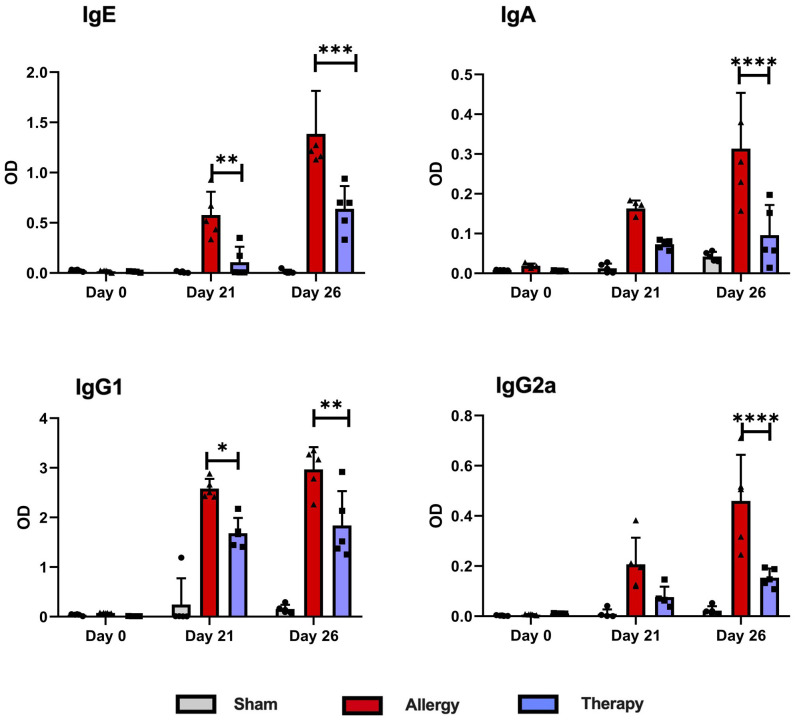
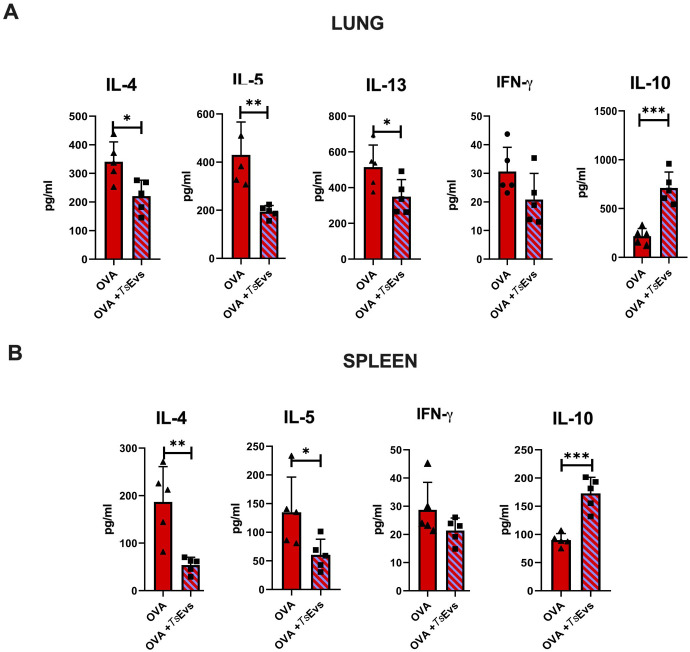
Results: Intranasal administration of TsEVs significantly reduced eosinophilic infiltration and airway inflammation in OVA-sensitized mice. TsEVs treatment suppressed Th2 cytokines (IL-4, IL-5, IL-13) and OVA-specific IgE while enhancing IL-10 production. Importantly, TsEVs promoted expansion of CD4+FoxP3+ and CD4+FoxP3-IL-10+ regulatory T cells in lungs and spleen, contributing to a systemic anti-inflammatory profile. Ex vivo studies confirmed TsEVs-mediated modulation of allergen-stimulated immune responses.

Discussion: Our findings highlight TsEVs as a promising therapeutic approach for allergic airway diseases by promoting immune tolerance and dampening inflammatory responses. These results pave the way for future translational applications of parasite-derived EVs in allergy treatment.

Keywords: Trichinella spiralis; allergic inflammation; extracellular vesicles; immune modulation; regulatory T cells; respiratory allergy.


Conflict of interest statement

The authors declare that the research was conducted in the absence of any commercial or financial relationships that could be construed as a potential conflict of interest.

Figures

Figure 1
Figure 1
Characterization of Trichinella spiralis extracellular vesicles. Nanoparticle tracking analysis (NTA) report of T. spiralis extracellular vesicles with statistical analysis indicating the size (155.4 ± 67.1 nm) and the concentration (5.4 x 10¹⁰ (p/ml)) of the vesicles.
Figure 2
Figure 2
Experimental design. (A) TsEVs treatment in healthy mice: Mice received either 0.5 x 10⁸ TsEVs (TsEVs group) or PBS alone (CTRL group) via intranasal (i.n.) administration for six consecutive days. (B) Mice were sensitized with intraperitoneal (i.p.) injections of ovalbumin (OVA, 100 μg) on days 1 and 14 and challenged with OVA via i.n. administration on days 22 to 24 (Allergy group). Control group received PBS instead of OVA (Sham group). Mice followed the same protocol as in Allergy group and were treated i.n. with TsEVs (0.5 x 10⁸) TsEVs on days 19 to 21 and 30 min before every challenge on days 22 to 24.
Figure 3
Figure 3
Analysis of myeloid cell populations in the lungs of mice treated with TsEVs. Mice were treated as outlined in Figure 2A : animals received either 0.5 × 10⁸/30μl TsEVs or equal volume of PBS (Ctrl) via intranasal administration daily for six consecutive days. Lung tissue was collected on day 8 and processed for flow cytometric analysis of immune cell populations. Bar graphs display both the percentage of myeloid cell subsets present in the lung. These include macrophages (macro), eosinophils (eos), neutrophils (neutro), Ly6Clow and Ly6Chigh monocytes (mo), CD11b+ dendritic cells (CD11b+ DC), and CD103+ DC. Cell subset identification was based on established gating strategies shown in Supplementary Figure S1 . Statistical comparisons were performed using Student’s t-test.
Figure 4
Figure 4
Analysis of lymphoid cell populations in the lung of mice treated with TsEVs. Mice were treated as outlined in Figure 2A : animals received either 0.5 × 10⁸/30 μl TsEVs or equal volume of PBS (ctrl) via intranasal administration daily for six consecutive days. Lung tissue was collected on day 8 and processed for flow cytometry to assess immune cell populations. Bar graphs display both the percentage of lymphoid cell subsets present in the lung. (A) Proportion of CD4+ T cells and CD8+ T cells, including subsets positive for intracellular staining of IL-4, IL-17, IFN-γ, IL-10, and TGF-β (see Supplementary Figure S2 for gating strategy). (B) Proportion of CD4+Foxp3+ Tregs, CD4+Foxp3-IL-10+ (Tr1) cells, and expression of IL-10 and TGF-β within CD4+Foxp3+ Treg cells (gating strategy shown in Supplementary Figure S3 ). Statistical analysis was performed using Student’s t-test and statistical significance indicated as *p < 0.05, **p < 0.01, ***p < 0.005.
Figure 5
Figure 5
Analysis of lymphocyte populations in the spleen of mice treated with TsEVs. Mice were treated as shown in the Figure 2A . Spleen cells were collected and analyzed using flow cytometry. (A) Proportion of CD4+ T cells, CD8+ T cells, and IL-4, IL-17, IFN-γ, IL-10, TGF-β producing CD4+ and CD8+ T cells in spleen analyzed by flow cytometry (see Supplementary Figure S2 for gating strategy). (B) Proportion of regulatory T cell populations: Treg (CD4+Foxp3+) and Tr1 (CD4+Foxp3-IL-10+) cells and IL-10 and TGF-β producing Treg cells are presented (see Supplementary Figure S3 for gating strategy). *p < 0.05, **p < 0.01, ***p < 0.005, ****p < 0.0001 (Student´s t-test).
Figure 6
Figure 6
Effects of TsEVs treatment in the lung of mice with allergic inflammation. Mice were treated according to the protocol outlined in Figure 2B . Animals were sensitized with intraperitoneal (i.p.) injections of ovalbumin and alum (OVA, 100 μg) on days 1 and 14 and challenged with intranasal (i.n.) application of OVA on days 22–24 (Allergy). The control group (Sham) received PBS instead of OVA. The treatment group received TsEVs (0.5 × 10⁸) via i.n. administration on days 19–21, and 30 minutes prior to each OVA challenge (days 22–24). On day 26, bronchoalveolar lavage fluid (BALF) was collected and lungs were processed for histological and flow cytometric analyses. (A) Representative images and differential cell counts of BALF samples from each group. (B, C) Representative lung tissue sections stained with hematoxylin and eosin (H&E) and periodic acid–Schiff (PAS), showing peribronchial inflammatory cell infiltration (B) and mucus production (C), respectively. Histopathological changes were quantified using disease scoring systems (H&E: scores 1–4; PAS: scores 0–3). Scale bar = 100 µm. (D) Bar graphs display the percentage of myeloid cell subsets present in the lung: macrophages (macro), eosinophils (eos), neutrophils (neutro), Ly6Clow and Ly6Chigh monocytes (mo), CD103+ dendritic cells (DC) and CD11b+ DC (see Supplementary Figure S1 for gating strategy). (E) The proportion of lymphoid cell subsets in the lung: B lymphocytes (Bly), natural killer (NK) cells, CD4+ and CD8+ T cells (see Supplementary Figure S2 for gating strategy). Results are presented as mean ± SD of three independent experiments. Statistical analysis was performed using one-way ANOVA with Tukey’s posttest and statistical significance indicated as *p < 0.05, **p < 0.01, ***p < 0.005, ****p < 0.0001 when compared with the Allergy group.
Figure 7
Figure 7
Cytokine expression and regulatory T cell responses in the lung following TsEVs treatments. Mice were treated as shown in the Figure 2B . Animals were sensitized with i.p. injections of ovalbumin and alum (OVA, 100 μg) on days 1 and 14 and challenged i.n. with OVA on days 22–24 (Allergy). The control group (Sham) received PBS instead of OVA. A treatment group received TsEVs (0.5 × 10⁸) via i.n. administration on days 19–21, and 30 minutes prior to each OVA challenge (days 22–24). On day 26 lung cells were collected and lymphoid cell subsets were analyzed using flow cytometry. Bar graphs display the percentage of cell subsets present in the lung. (A) The proportion of IL-4, IL-17, IFN-γ, IL-10, and TGF-β positive CD4+ and CD8+ T cells (see Supplementary Figure S2 for gating strategy). (B) The proportion of regulatory T cell populations: Treg (CD4+Foxp3+) and Tr1 (CD4+Foxp3-IL-10+) cells and IL-10 and TGF-β positive Treg cells are presented (see Supplementary Figure S3 for gating strategy). Differences were analyzed for significance by one-way ANOVA with Tukey’s posttest indicated as *p < 0.05, **p < 0.01 when compared with the Allergy group.
Figure 8
Figure 8
Recall responses in lung and spleen immune cells of TsEVs-treated or control mice. Mice were treated as shown in the Figure 2B . Lung (A) and spleen (B) cells were isolated from all examine groups (Sham, Allergy and Therapy group) and restimulated either with medium (M) or OVA (100 mg/ml). Supernatants were collected and cytokine levels were measured using ELISA. Data are presented as mean ± SD from three independent experiments. Statistical significance was determined using Two-way ANOVA with Tuckey’s multiple comparison test. *p < 0.05, ***p < 0.005, ****p < 0.0001 compared with the Allergy group.
Figure 9
Figure 9
Levels of OVA-specific antibodies in serum following TsEVs treatments. Serum samples were collected from Allergy, Therapy and Sham group in three time points to measure the levels of OVA-specific IgE, IgA, IgG1 and IgG2a antibodies. Data are represented as mean ± SD from three independent experiments. Differences were analyzed for significance by Two-way ANOVA with Tuckey’s posttest indicated as *p < 0.05, **p < 0.01, ***p < 0.005, ****p < 0.0001 when compared with the Allergy group.
Figure 10
Figure 10
Ex vivo treatment of OVA-restimulated cells with TsEVs. Lung and spleen cells from the Allergy group were isolated and seeded for analysis. (A) Lung cells from the Allergy group were stimulated with OVA for 1h and subsequently treated with TsEVs (3x10⁷ particles/ml) for 72h (B) Spleen cells from the Allergy group were stimulated with OVA for 1h and then further treated with TsEVs for 72h. Cytokine levels in culture supernatants were measured by ELISA. Data are represented as mean ± SD from three independent experiments. Differences between OVA- and OVA+TsEVs - treated lung and spleen cells were analyzed using Student´s t-test with statistical significance represented by *p < 0.05, **p < 0.01, ***p < 0.005.

Similar articles

References

    1. Larsson K, Ställberg B, Lisspers K, Telg G, Johansson G, Thuresson M, et al. Prevalence and management of severe asthma in primary care: An observational cohort study in Sweden (PACEHR). Respir Res. (2018) 19:12. doi: 10.1186/s12931-018-0719-x, PMID: - DOI - PMC - PubMed
    1. Pawankar R, Canonica GW, Holgate ST, Lockey RF, Blaiss MS. WAO White Book on Allergy. WI, USA: World Allergy Organization (WAO), (2013). pp. 81–103.
    1. Aït-Khaled N, Pearce N, Anderson HR, Ellwood P, Montefort S, Shah J, et al. Global map of the prevalence of symptoms of rhinoconjunctivitis in children: The International Study of Asthma and Allergies in Childhood (ISAAC) Phase Three. Allergy. (2009) 64:123–48. doi: 10.1111/j.1398-9995.2008.01884.x, PMID: - DOI - PubMed
    1. Nathan RA. The burden of allergic rhinitis. Allergy Asthma Proc. (2007) 28:3–9. doi: 10.2500/aap.2007.28.2934, PMID: - DOI - PubMed
    1. Walker S, Khan-Wasti S, Fletcher M, Cullinan P, Harris J, Sheikh A. Seasonal allergic rhinitis is associated with a detrimental effect on examination performance in United Kingdom teenagers: Case-control study. J Allergy Clin Immunol. (2007) 120:381–7. doi: 10.1016/j.jaci.2007.03.034, PMID: - DOI - PubMed

LinkOut - more resources