

Polarization observables in double neutral pion photoproduction
- PMID: 40718541
- PMCID: PMC12287178
- DOI: 10.1140/epja/s10050-025-01612-7
Polarization observables in double neutral pion photoproduction
Abstract
Measurements of target asymmetries and double-polarization observables for the reaction are reported. The data were taken with the CBELSA/TAPS experiment at the ELSA facility (Bonn University) using the Bonn frozen-spin butanol ( OH) target, which provided transversely polarized protons. Linearly polarized photons were produced via bremsstrahlung off a diamond crystal. The data cover the photon energy range from to and nearly the complete angular range. The results have been included in the BnGa partial wave analysis. Experimental results and the fit agree very well. Observed systematic differences in the branching ratios for decays of and resonances are attributed to the internal structure of these excited nucleon states. Resonances which can be assigned to SU(6) O(3) two-oscillator configurations show larger branching ratios to intermediate states with non-zero intrinsic orbital angular momenta than resonances assigned to one-oscillator configurations.
© The Author(s) 2025.
Figures


 on a logarithmic scale. For each of the four cuts (coplanarity, polar angle of the proton, missing mass, and
  -invariant mass) the spectrum is shown in red after just the time cut (including the side-band subtraction) and in green after all cuts except the one on the variable shown. The invariant
  -mass contains all
  combinations and therefore also combinatorial background

 . In this plot, only very broad data selection cuts were applied to the data
 combination for the fitted pion. The data is binned here for presentational purposes only. The horizontal bars indicate the (variable) bin width
 and
and  (left),
  (center), or
  (right)
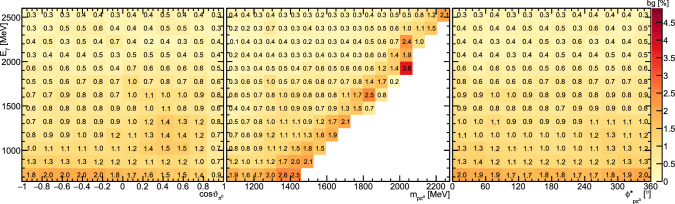
 and
and  (left),
  (center), or
  (right)

 are shown. The insert shows the same spectrum on a linear axis
 and
and  .
.
 as a function of
  or
or  determined from generated Monte Carlo events (red band). The blue band results from taking the acceptance into account. The widths of the bands are given by the statistical uncertainties of the MC event sample
 and
and  . The colored lines represent PWA solutions: -MAID in black, BnGa 2014-02 in red, new BnGa 2022-02 in blue. The systematic uncertainty is shown as a gray band
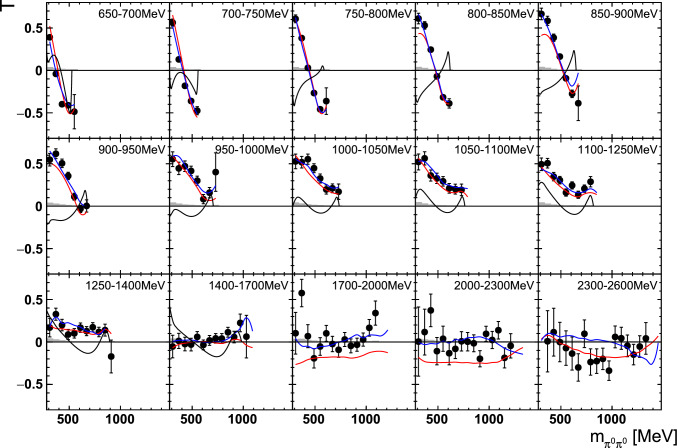
 and
and  . The colored lines represent PWA solutions:
  -MAID in black, BnGa 2014-02 in red, new BnGa 2022-02 in blue. The systematic uncertainty is shown as a gray band
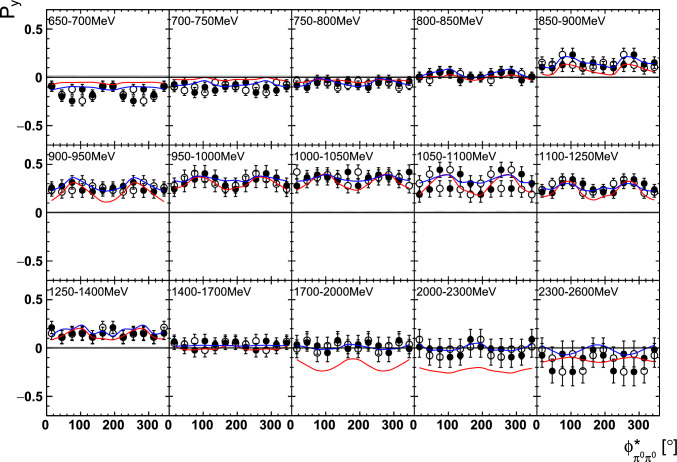
 and
and  . The open symbols make use of the symmetry properties. The colored lines represent PWA solutions: BnGa 2014-02 in red, new BnGa 2022-02 in blue. The systematic uncertainty is shown as a gray band
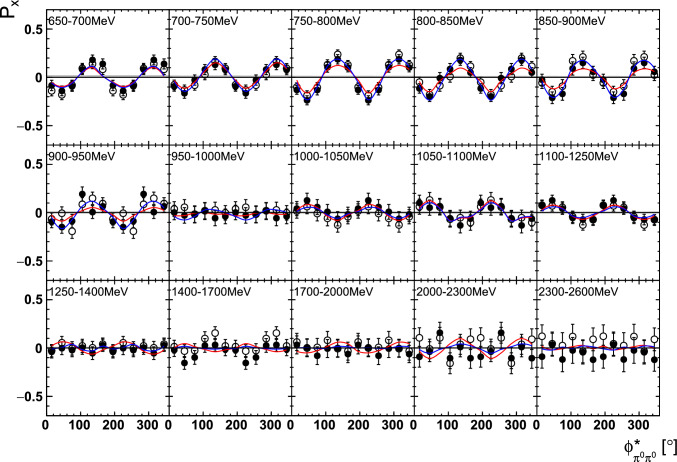
 and
and  . The open symbols make use of the symmetry properties. The colored lines represent PWA solutions: BnGa 2014-02 in red, new BnGa 2022-02 in blue. The systematic uncertainty is shown as a gray band
 and
and  . The colored lines represent PWA solutions: -MAID in black, BnGa 2014-02 in red, new BnGa 2022-02 in blue. The systematic uncertainty is shown as a gray band
 and
and  . The colored lines represent PWA solutions: -MAID in black, BnGa 2014-02 in red, new BnGa 2022-02 in blue. The systematic uncertainty is shown as a gray band
 and
and  . The open symbols make use of the symmetry properties. The colored lines represent PWA solutions: BnGa 2014-02 in red, new BnGa 2022-02 in blue. The systematic uncertainty is shown as a gray band
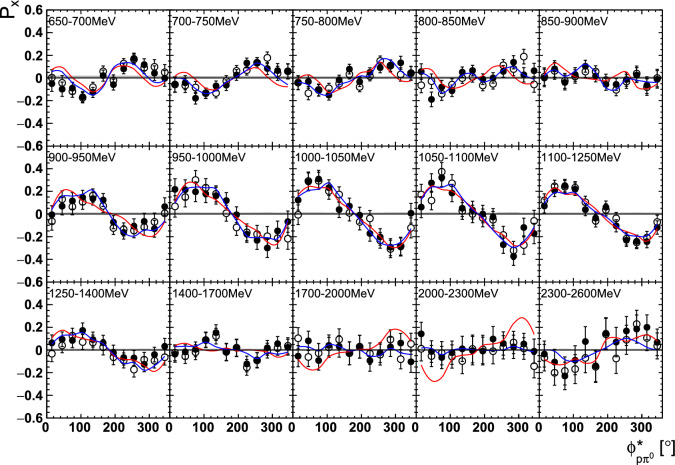
 and
and  . The open symbols make use of the symmetry properties. The colored lines represent PWA solutions: BnGa 2014-02 in red, new BnGa 2022-02 in blue. The systematic uncertainty is shown as a gray band
 and
and  (left), or
  and
and  (right). The colored lines represent PWA solutions: BnGa 2014-02 in red, new BnGa 2022-02 in blue. The systematic uncertainty is shown as a gray band
 and
and  (left), or
  and
and  (right). The colored lines represent PWA solutions: BnGa 2014-02 in red, new BnGa 2022-02 in blue. The systematic uncertainty is shown as a gray band
 . The
. The  is varied within a row, the invariant mass
  within a column. Only a single energy bin is shown here. The colored lines represent PWA solutions: BnGa 2014-02 in red, new BnGa 2022-02 in blue. The systematic uncertainty is shown as a gray band
 . The
. The  is varied within a row, the invariant mass
  within a column. Only a single energy bin is shown here. The colored lines represent PWA solutions: BnGa 2014-02 in red, new BnGa 2022-02 in blue. The systematic uncertainty is shown as a gray band
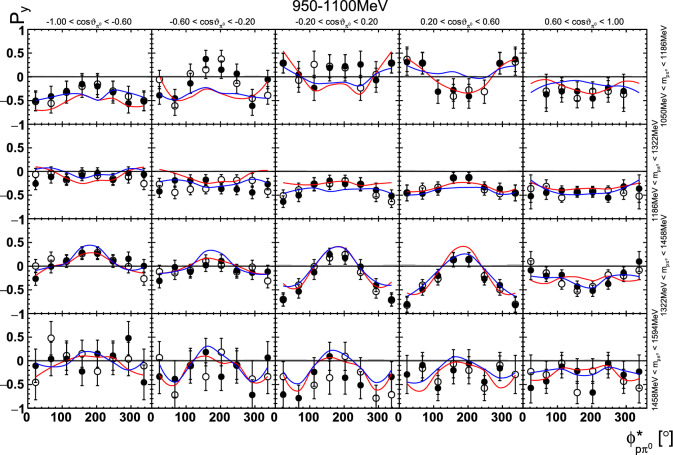
 . The
. The  is varied within a row, the invariant mass
  within a column. Only a single energy bin is shown here. The colored lines represent PWA solutions: BnGa 2014-02 in red, new BnGa 2022-02 in blue. The systematic uncertainty is shown as a gray band
 . The
. The  is varied within a row, the invariant mass
  within a column. Only a single energy bin is shown here. The colored lines represent PWA solutions: BnGa 2014-02 in red, new BnGa 2022-02 in blue. The systematic uncertainty is shown as a gray band
 (left),
  (center), and
  (right). The colored lines represent PWA solutions: -MAID in black, BnGa 2014-02 in red, new BnGa 2022-02 in blue. The systematic uncertainty is shown as a gray band
 ,
,  are compared to the sums of branching ratios into
  ,
,  , and
, and  of the resonances listed in Table 2. The branching ratios (BR) of one-oscillator excitations decaying into the ground states
  or
or  are depicted as black dots, when decaying into the excited states
  ,
,  , or
, or  as red squares. Mixed-oscillator states decaying into the ground states mentioned above are shown as blue dots, when decaying into the excited states mentioned above as green squares. Additionally the mean branching ratios are shown on the right as well as colored lines
References
-
- S. Capstick, W. Roberts, Prog. Part. Nucl. Phys. 45, S241 (2000)
-
- S. Capstick, N. Isgur, Phys. Rev. D 34, 2809 (1986) - PubMed
-
- U. Löring, B.C. Metsch, H.R. Petry, Eur. Phys. J. A 10, 395 (2001)
-
- M. Anselmino, E. Predazzi, S. Ekelin, S. Fredriksson, D.B. Lichtenberg, Rev. Mod. Phys. 65, 1199 (1993)
-
- S. Navas et al. (Particle Data Group), Phys. Rev. D 110, 030001 (2024)
LinkOut - more resources
Full Text Sources