. 2025 Jul 11:12:1637980.
doi: 10.3389/fmolb.2025.1637980. eCollection 2025.

Integrating multi-dimensional data to reveal the mechanisms and molecular targets of baikening granules for treatment of pediatric influenza

Affiliations

Integrating multi-dimensional data to reveal the mechanisms and molecular targets of baikening granules for treatment of pediatric influenza

Zhaoyuan Gong et al. Front Mol Biosci. .

Abstract

Background: Children are the main group affected by the influenza virus, posing challenges to their health. The high risk of viral variability, drug resistance, and drug development leads to a scarcity of therapeutic drugs. Baikening (BKN) granules are a marketed traditional Chinese medicine used to treat children's lung heat, asthma, whooping cough, etc. Therefore, exploring the potential mechanisms of BKN in treating pediatric influenza is of great significance for discovering new drugs.

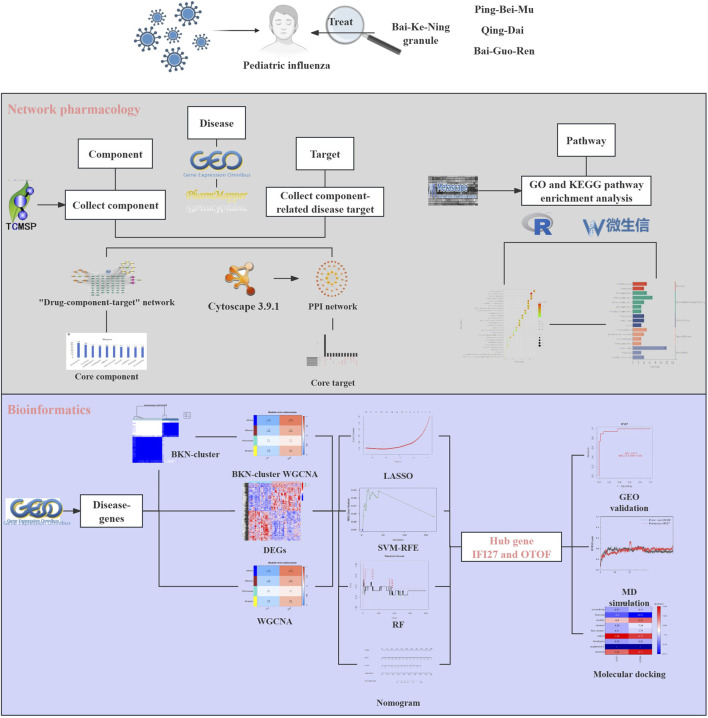
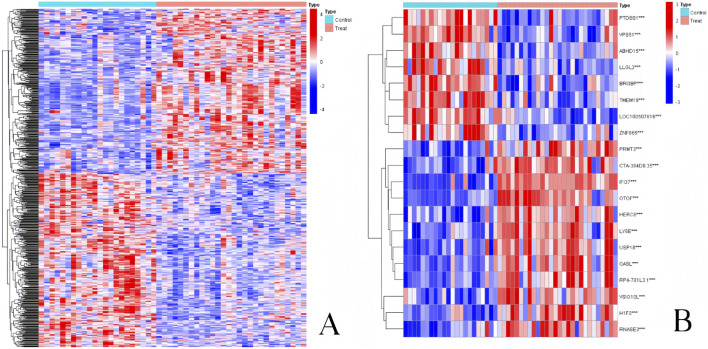
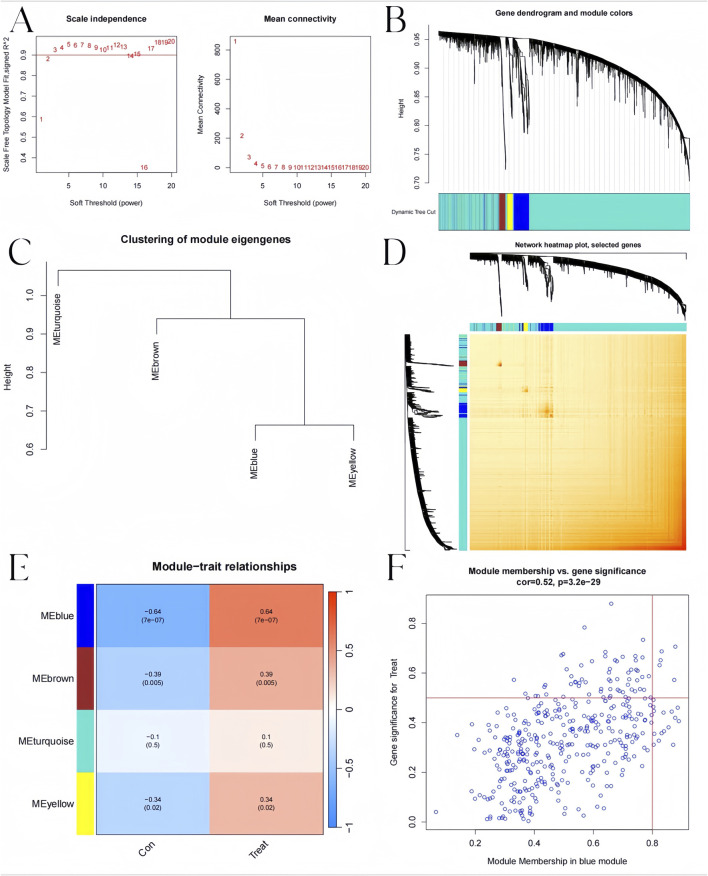
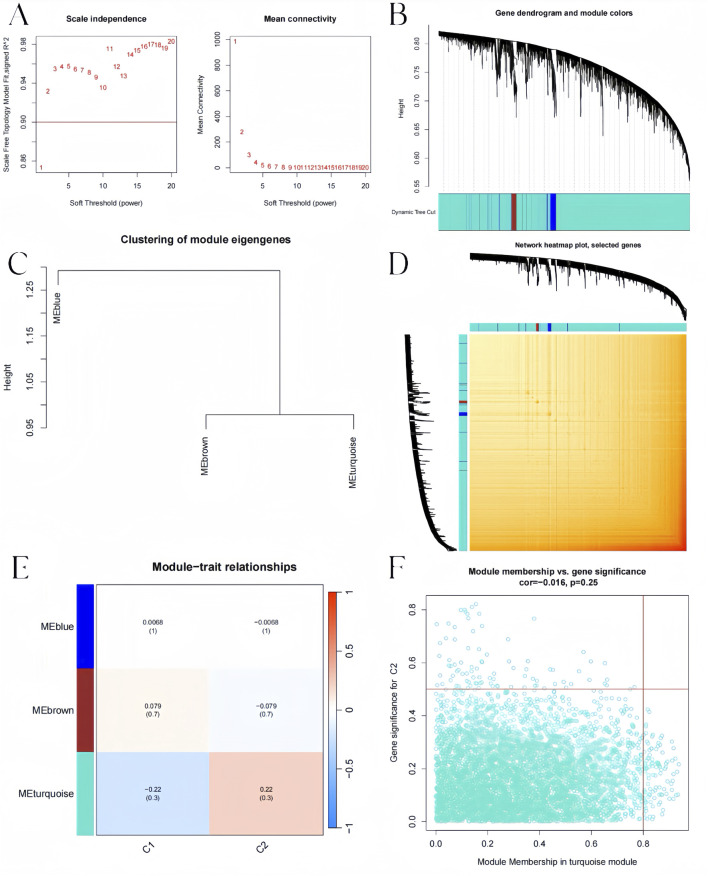
Methods: Through the database, we obtained differentially expressed genes (DEGs) between pediatric influenza and healthy samples, identified the components of BKN, and collected the targets. Target networks were built with the purpose of screening both targets and key components. Pathway and function enrichment were conducted on the relevant targets of BKN for treating pediatric influenza. BKN-related hub genes for influenza were discovered through DEGs, weighted gene co-expression network analysis (WGCNA), BKN-cluster WGCNA, and machine learning model. The accuracy of prediction efficiency and the value of BKN-related hub gene were validated through analysis of external datasets and receiver operating characteristics. Ultimately, simulations using molecular docking and molecular dynamics were used to forecast how active components will bind to hub genes.

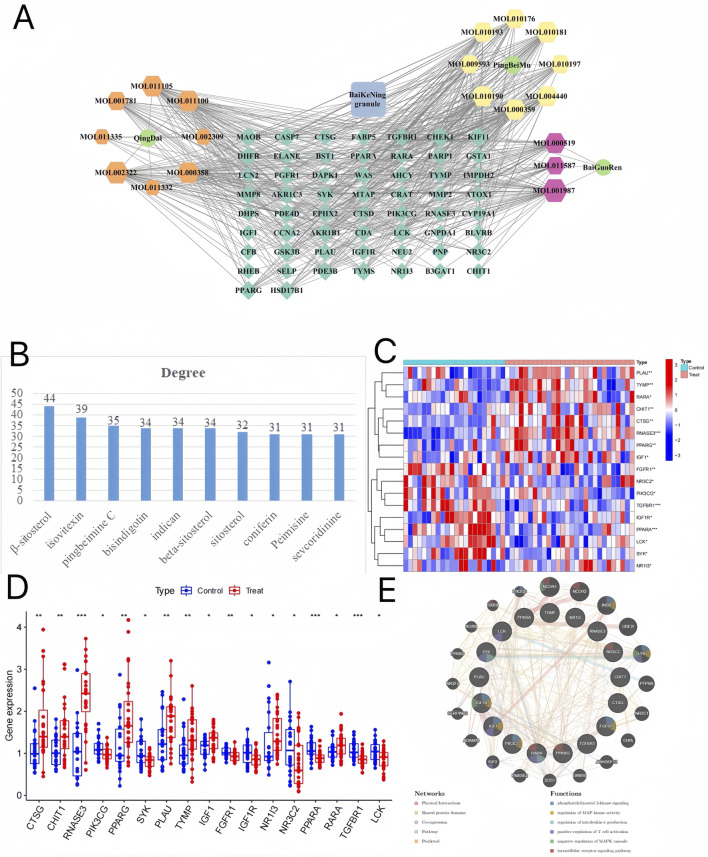
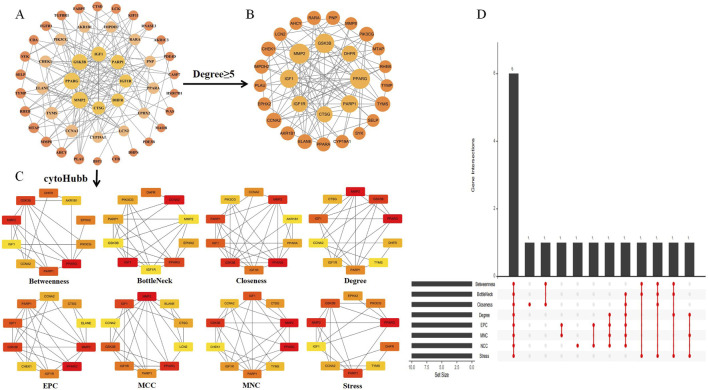
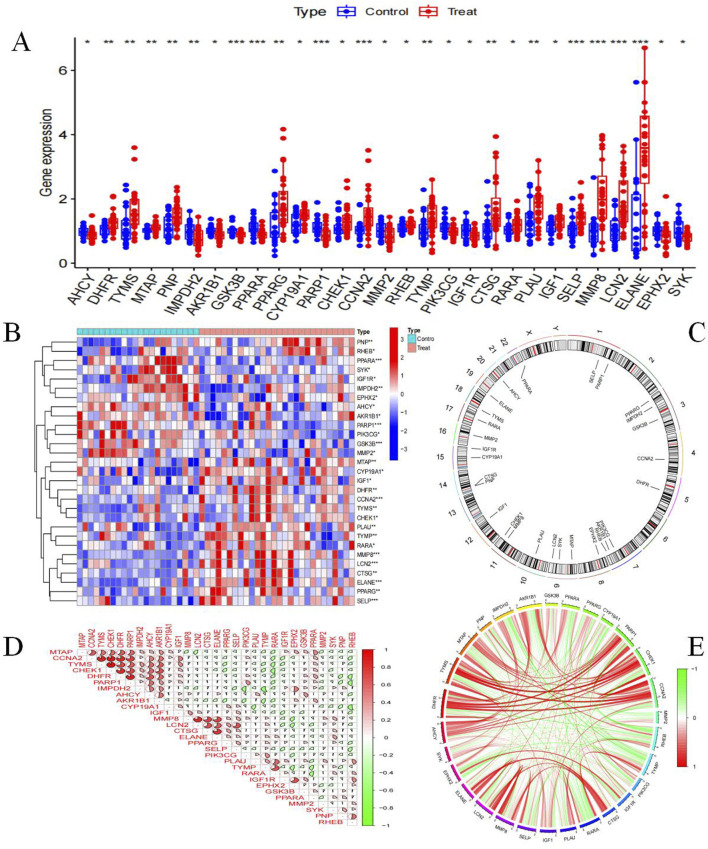
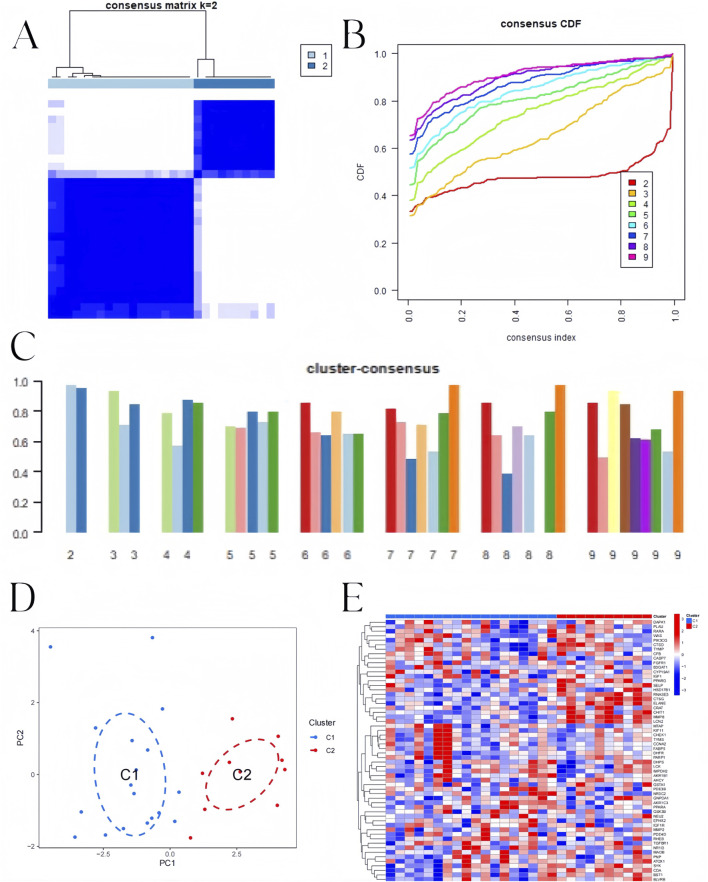
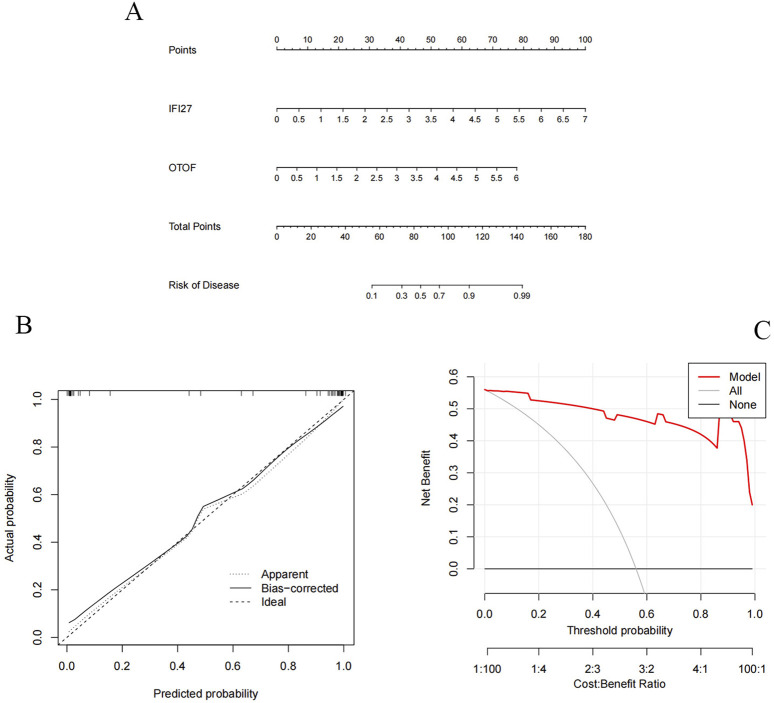
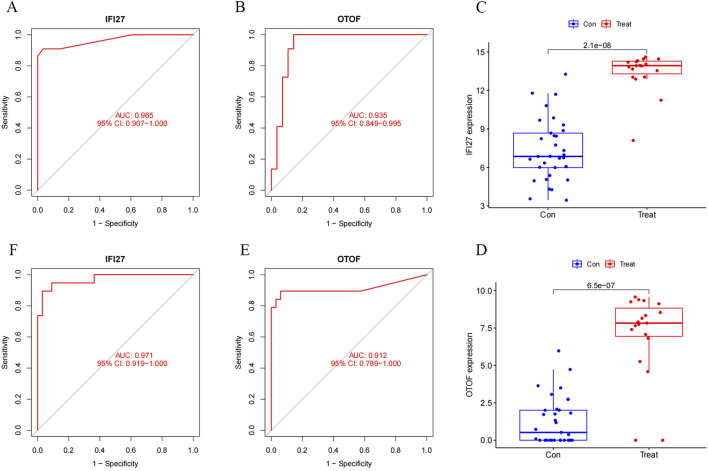
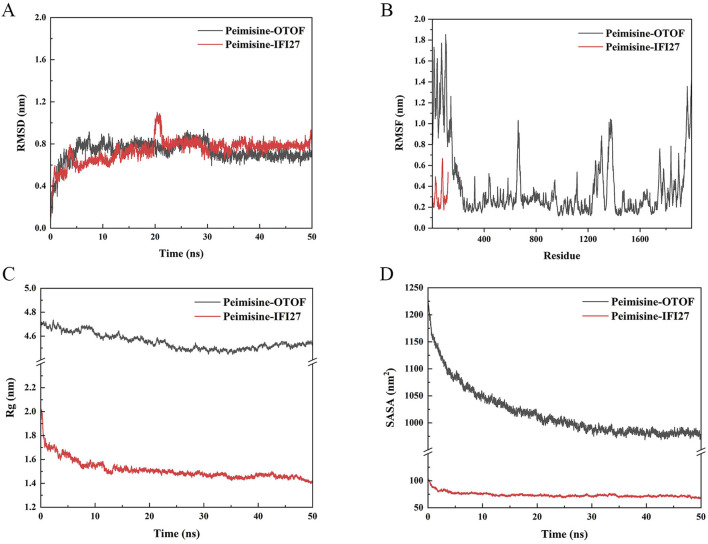
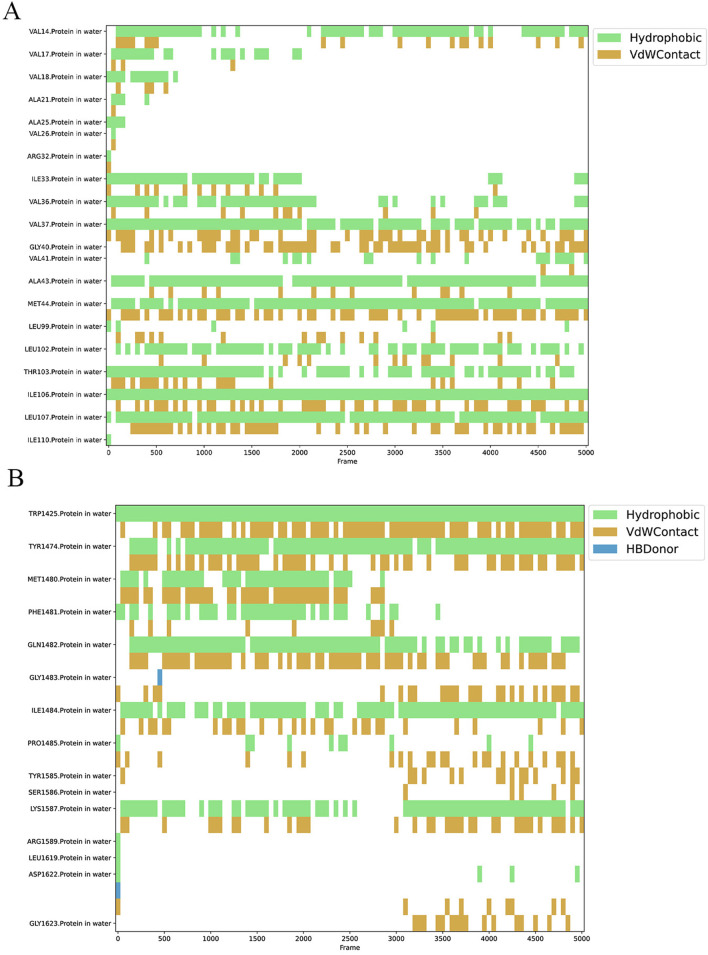
Result: A total of 20 candidate active compounds, 58 potential targets, and 3,819 DEGs were identified. The target network screened the top 10 key components and 6 core targets (PPARG, MMP2, GSK3B, PARP1, CCNA2, and IGF1). Potential target enrichment analysis indicated that BKN may be involved in AMPK signaling pathway, PI3K Akt signaling pathway, etc., to combat pediatric influenza. Subsequently, two hub genes (OTOF, IFI27) were obtained through WGCNA, BKN-cluster WGCNA, and machine learning models as potential biomarkers for BKN-related pediatric influenza. Two hub genes were found to have primary diagnostic value based on ROC curve analysis. Molecular docking confirmed the binding between BKN and hub gene. Molecular dynamics further revealed the stable binding between Peimisine and hub genes.

Conclusion: BKN may alleviate pediatric influenza via key components targeting core targets (PPARG, MMP2, GSK3B, PARP1, CCNA2, and IGF1) and hub genes (OTOF, IFI27), with the involvement of feature genes-related pathways. These results have potential consequences for future research and clinical practice.

Keywords: baikening granules; bioinformatics; machine learning; molecular docking; molecular dynamics simulation; network pharmacology; pediatric influenza.


Conflict of interest statement

The authors declare that the research was conducted in the absence of any commercial or financial relationships that could be construed as a potential conflict of interest.

Figures

FIGURE 1
FIGURE 1
Flow diagram of this study.
FIGURE 2
FIGURE 2
Heatmap of DEGs in pediatric influenza. (A) Heatmap of the entire DEGs. (B) Heatmap of the top 10 DEGs.
FIGURE 3
FIGURE 3
BKN-Herb-component-target network. (A) There were 3 kinds of herbs (Ping-Bei-Mu, Qing-Dai, Bai-Guo-Ren), 19 compounds, and 42 related targets on the network. The blue square represents BKN. Hexagons of different colors represent the active ingredients of different medicinal herbs. The dark green diamond represents the intersection of drug and disease targets. Green represents medicinal herbs. (B) According to the BKN-Herb-component-target network, the degree values of different compounds rank in the top 10. (C, D) The box plot and heatmap showed expression patterns of BKN-ImmuneDEGs in pediatric influenza. (E) Gene network and functional analysis of ImmuneCDEGs generated using GeneMANIA. The inner circle contains ImmuneCDEGs, while the outer circle contains reciprocal genes. *p < 0.05, **p < 0.01, ***p < 00.001.
FIGURE 4
FIGURE 4
Intersection target PPI network and network analysis. (A) Intersection target PPI network. The orange circle represents the intersection target, with a larger degree value indicating a larger shape. (B) Intersection targets greater than or equal to the standard degree value. (C) The CytoHubba plugin was used to identify the core targets from the PPI network. The node’s color ranged from pale yellow to red, with a matching increase in degree. (D) The Upset graph shows the results of eight algorithms represented as core targets.
FIGURE 5
FIGURE 5
GO and KEGG enrichment analysis results. (A) Lollipop diagram showing the BP, CC, and MF. (B) Bubble chart showing the BP, CC, and MF. (C) The KEGG enrichment analysis bubble chart displaying the top 17 pathways. (D) The top 17 pathways’ KEGG types, as determined by KEGG enrichment analysis.
FIGURE 6
FIGURE 6
Analysis of BKN-RCG. (A) Box plot of core gene expression differential analysis between normal samples and pediatric influenza samples, (*p < 0.05, **p < 0.01, ***p < 0.001). (B) Expression of BKN-RCG in normal and pediatric influenza. (C) Chromosome location of BKN-RCG. (D) Correlation analysis between the two BKN-RCG. (E) BKN-RCG correlation network.
FIGURE 7
FIGURE 7
BKN-related clusters in pediatric influenza. (A) Matrix of consensus at k = 2. (B) Cumulative distribution function (CDF). (C) The consensus clustering score. (D) The two subclusters’ distribution in PCA. (E) Heatmap showing the 58 BKN-dysregulated between the two clusters.
FIGURE 8
FIGURE 8
Co-expression network in pediatric influenza. (A) Soft threshold selection. (B) Dendrogram of genes within the co-expression module. Various modules are displayed using various colors. (C) A map of feature genes’ clustering within modules. (D) Correlation heatmap between modules. (E) Module signature gene correlation analysis with clinical traits. (F) Gene significance for pediatric influenza and blue module genes is plotted together in scatter plots.
FIGURE 9
FIGURE 9
BKN-related molecular clusters’ co-expression network in pediatric influenza. (A) Soft threshold selection. (B) Dendrogram of genes within the co-expression module. Various modules are displayed using various colors. (C) A map of feature genes’ clustering within modules. (D) Correlation heatmap between modules. (E) Module signature gene correlation analysis with clinical traits. (F) Gene significance for pediatric influenza and the turquoise module genes is plotted together in scatter plots.
FIGURE 10
FIGURE 10
Candidate hub pediatric influenza genes selection. (A) Venn diagram showing the gene that connects the influenza module-related genes to the BKN-related molecular clusters module-related genes. (B) Biomarker screening based on SVM-RFE. The horizontal axis represents the number of retained variables, and the vertical axis represents RMSE. (C) Error variation trend of RF. The black solid line represents the overall error. The red dotted line and the green dotted line respectively represent the error rates of different classification results. (D) MeanDecreaseGini of each variable in RF algorithm. (E) LASSO logistic regression algorithm to screen biomarkers. The horizontal axis represents Log(λ), and the vertical axis represents Binomial Deviance. The red dotted line represents the λ value corresponding to the point where the deviation is the smallest, and the number above it is the number of variables corresponding to each λ value. (F) A Venn diagram displaying the points where the three algorithms’ diagnostic markers intersected.
FIGURE 11
FIGURE 11
Candidate hub genes of pediatric influenza validate. (A) Nomogram shows the incidence rate of pediatric influenza. (B) Correction curve of characteristic gene column chart for influenza A. (C) Decision curve of feature genes nomogram of pediatric influenza.
FIGURE 12
FIGURE 12
Candidate hub genes of pediatric influenza validate by ROC and expression. (A) ROC of the IFI27 in experimental set. (B) ROC of the OTOF in experimental set. (C) Boxplot of the IFI27. (D) Boxplot of the OTOF. (E) ROC of the IFI27 in validation set. (F) ROC of the OTOF in validation set.
FIGURE 13
FIGURE 13
Molecular docking validation. (A) Heat map showing the results of the molecular docking between hub genes and active components. (B) Peimisine- IFI27 docking models. (C) Peimisine-OTOF docking models.
FIGURE 14
FIGURE 14
Molecular docking validation. (A) The RMSD of Peimisine- IFI27 and Peimisine-OTOF. (B) The RMSF of Peimisine- IFI27 and Peimisine-OTOF. (C) The Rog of Peimisine- IFI27 and Peimisine-OTOF. (D) The fluctuation plot of the complexes SASA.
FIGURE 15
FIGURE 15
The hydrogen bonds of Peimisine- IFI27 and Peimisine-OTOF.
FIGURE 16
FIGURE 16
Key contacts and their residues analyzed in Peimisine-IFI27 complex (A) and Peimisine-OTOF complex (B).

Similar articles

References

    1. Auslander N., Gussow A. B., Koonin E. V. (2021). Incorporating machine learning into established bioinformatics frameworks. Int. J. Mol. Sci. 22, 2903–2919. 10.3390/ijms22062903 - DOI - PMC - PubMed
    1. Bei Y., Tia B., Li Y., Guo Y., Deng S., Huang R., et al. (2021). Anti-influenza A virus effects and mechanisms of emodin and its analogs via regulating PPAR α/γ -AMPK-SIRT1 pathway and fatty acid metabolism. Biomed. Res. Int. 2021, 9066938. 10.1155/2021/9066938 - DOI - PMC - PubMed
    1. Berger S. I., Iyengar R. (2009). Network analyses in systems pharmacology. Bioinformatics 25, 2466–2472. 10.1093/bioinformatics/btp465 - DOI - PMC - PubMed
    1. Blanchet L., Vitale R., van Vorstenbosch R., Stavropoulos G., Pender J., Jonkers D., et al. (2020). Constructing bi-plots for random forest: tutorial. Anal. Chim. Acta 1131, 146–155. 10.1016/j.aca.2020.06.043 - DOI - PubMed
    1. Borkenhagen L. K., Allen M. W., Runstadler J. A. (2021). Influenza virus genotype to phenotype predictions through machine learning: a systematic review. Emerg. Microbes Infect. 10, 1896–1907. 10.1080/22221751.2021.1978824 - DOI - PMC - PubMed

LinkOut - more resources