. 2025 Jul 11:15:1601368.
doi: 10.3389/fonc.2025.1601368. eCollection 2025.

Analysis of cancer-associated glycosyltransferases reveals novel targets of non-small cell lung cancer pathogenesis

Affiliations

Analysis of cancer-associated glycosyltransferases reveals novel targets of non-small cell lung cancer pathogenesis

Chang Liu et al. Front Oncol. .

Abstract

Background: Aberrant glycosylation is associated with cancer progression and patient survival, of which the driving genes could act as biomarkers. Our objective was to characterize the expression of glycosylation-related genes to elucidate the heterogeneity between lung adenocarcinoma (LUAD) and lung squamous cell carcinoma (LUSC), and their prospective diagnostic utility.

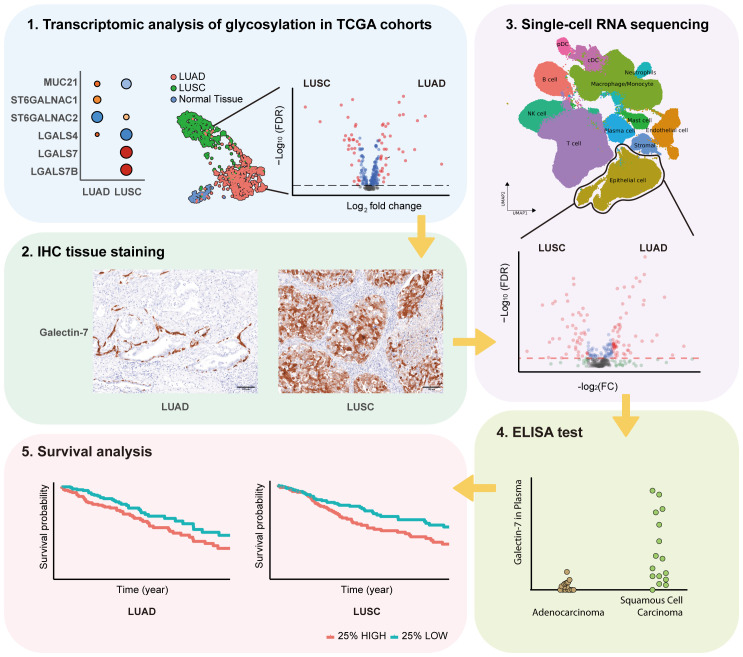
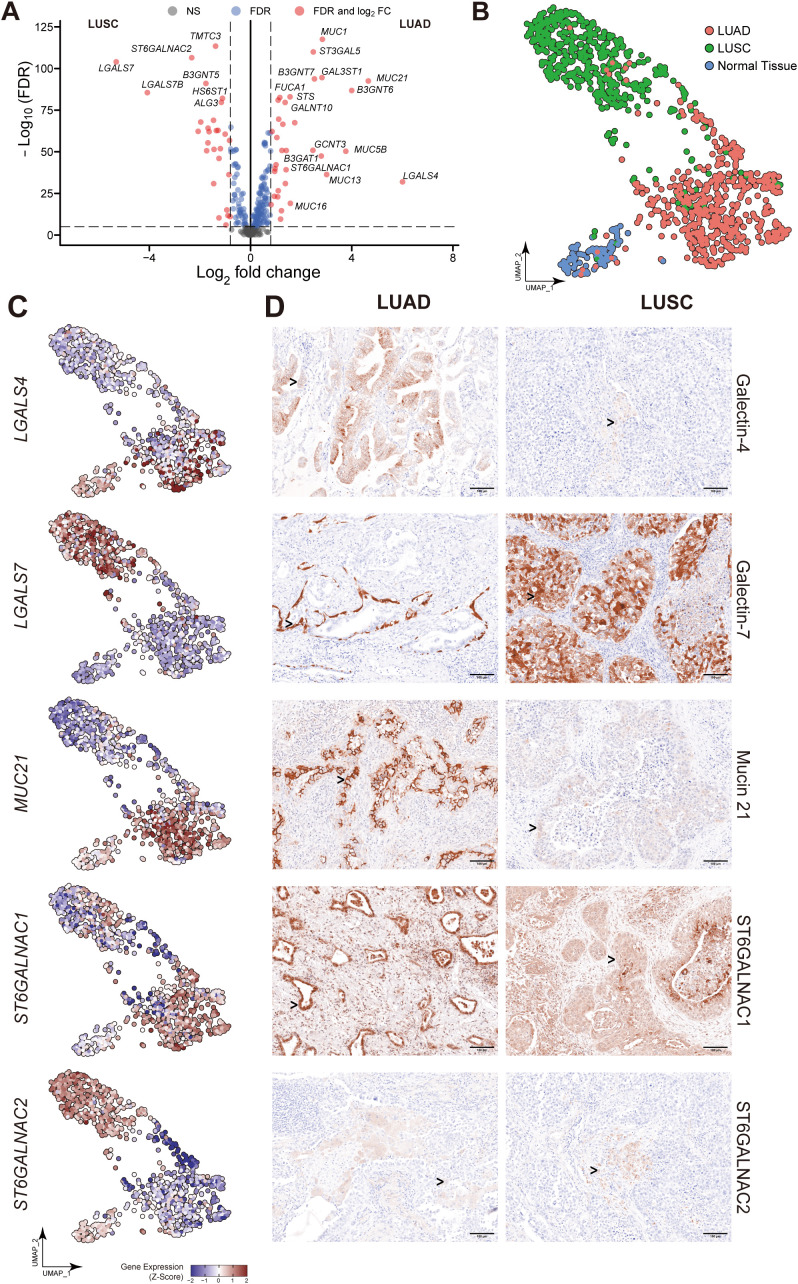
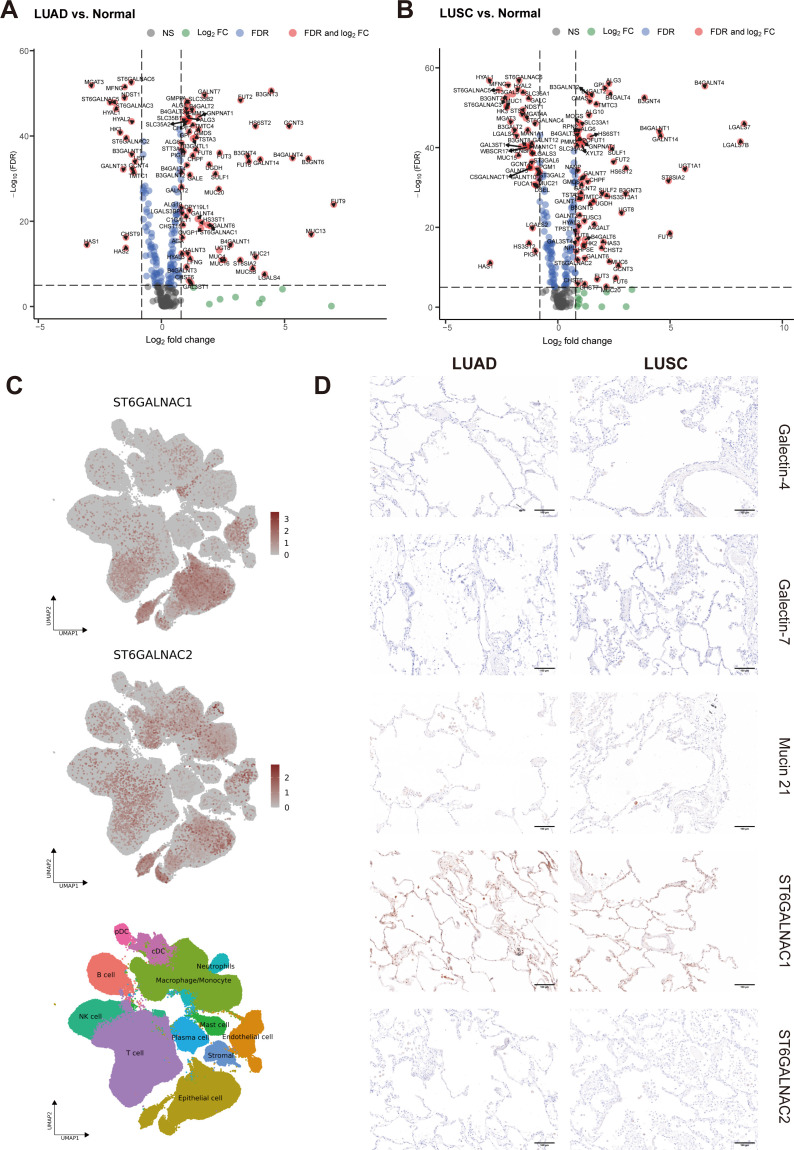
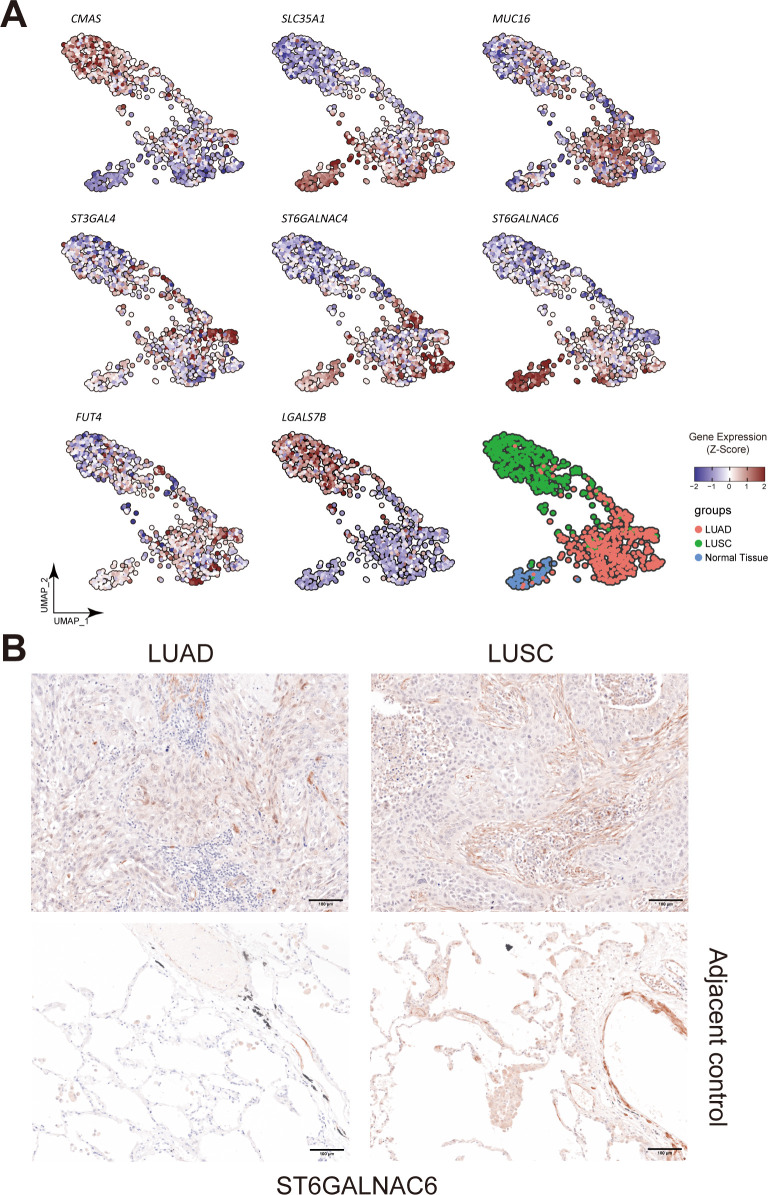
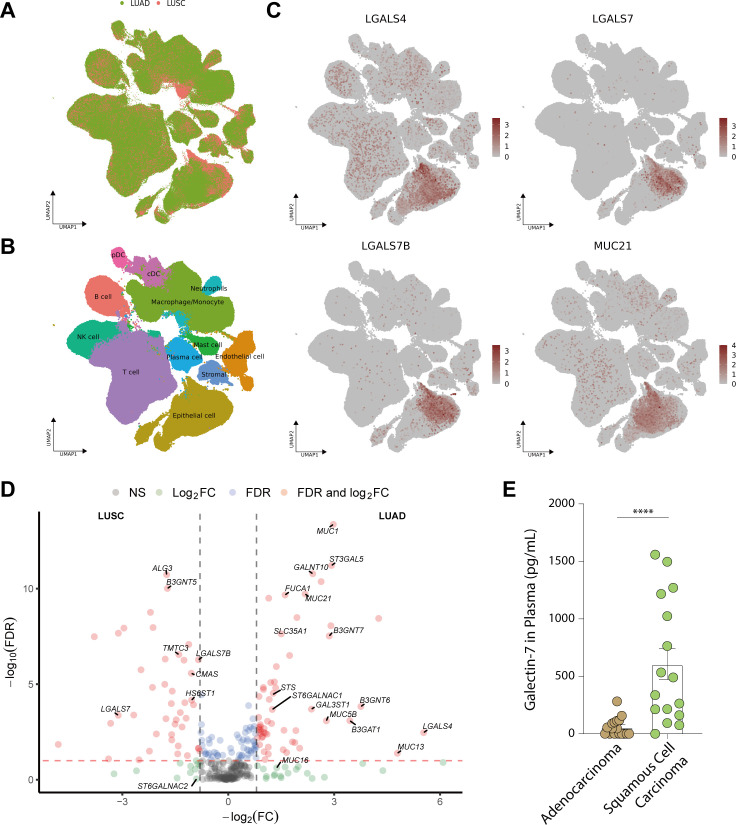
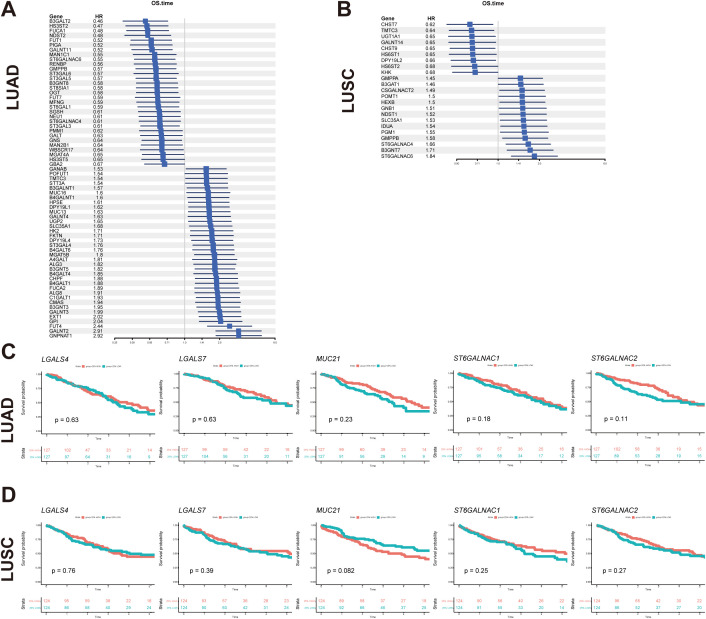
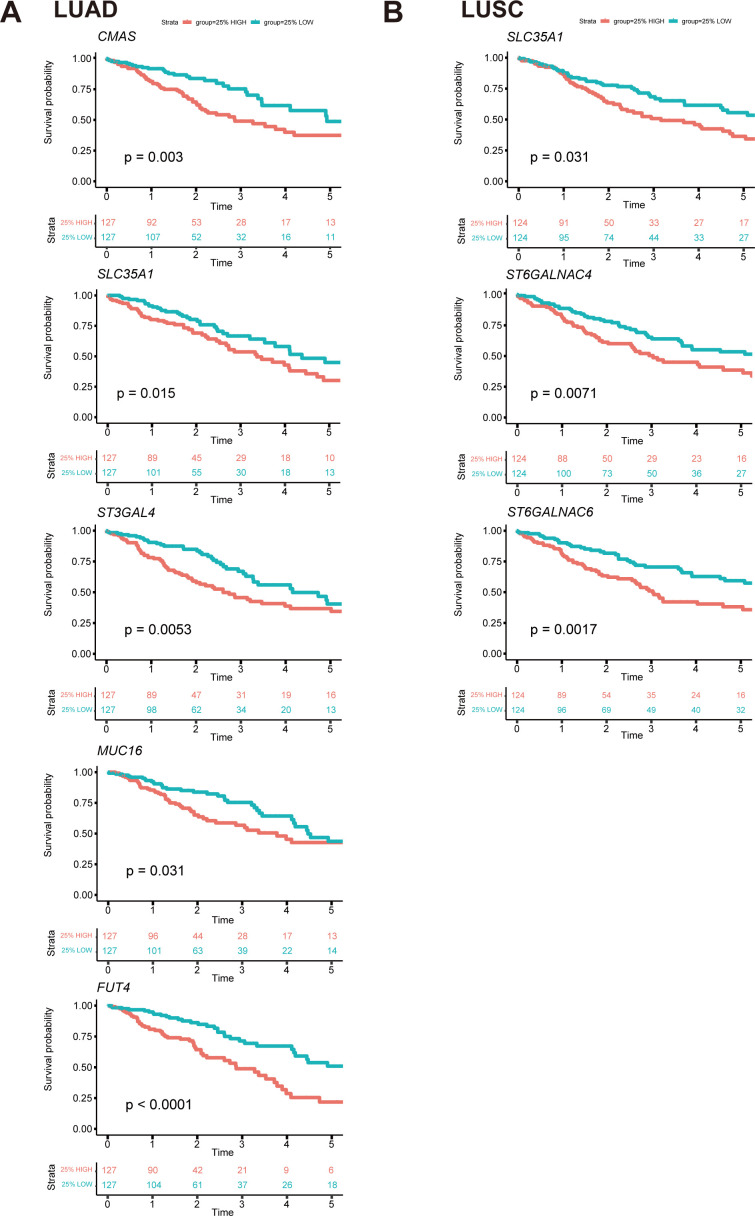
Methods: mRNA expression data for all glyco-relevant genes was collected from 553 LUSC and 576 LUAD patients from the TCGA dataset. Differential gene expression analysis and UMAP dimension reduction analysis were used to compare mRNA expression in LUAD and LUSC. Selected genes were further confirmed through immunohistochemistry of tissue biopsies. Public single-cell RNA sequencing (scRNA-seq) data from 72 LUSC and 163 LUAD patients was retrieved to study cell type-specific expression. Galectin-7 was measured in patients' plasma by ELISA. Univariate Cox proportional regression model was used for prognostic marker detection.

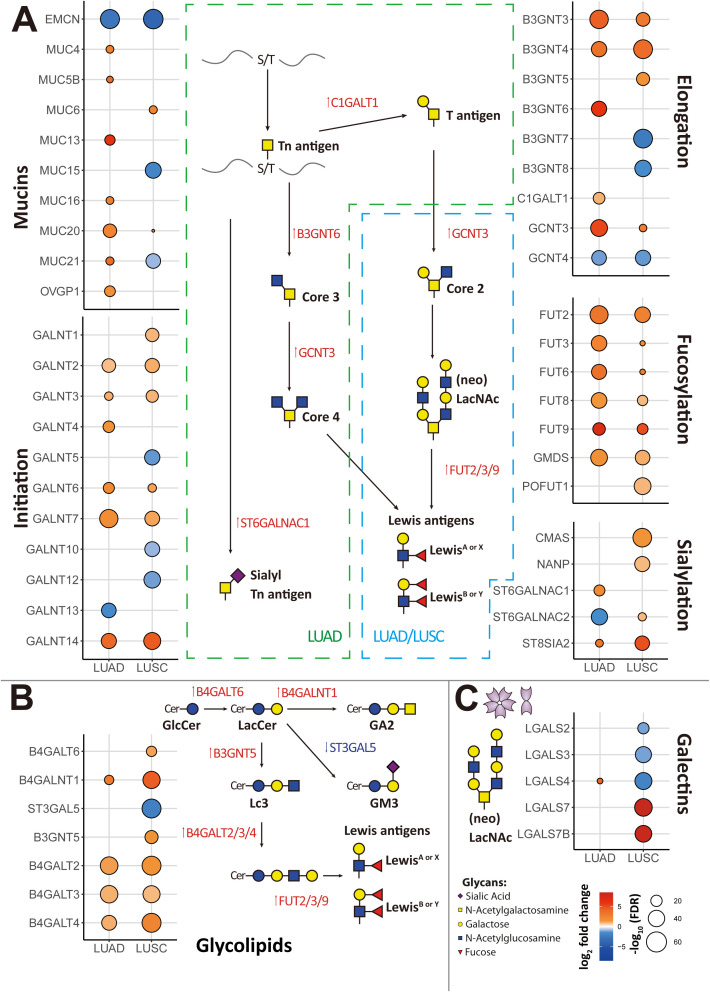
Results: Our analysis revealed genes differentially expressed respectively in LUSC and LUAD compared to normal lung samples. We focused on genes exhibiting high expression in LUSC (LGALS7, LGALS7B, and ST6GALNAC2) and in LUAD (LGALS4, MUC21, and ST6GALNAC1). Key glyco-related signatures were mostly observed in the malignant cell compartment. Galectin-7 concentration in plasma was upregulated in LUSC patients, but not LUAD patients. 67 genes in LUAD and 23 genes in LUSC were strongly linked to patient survival.

Conclusion: We identified several glyco-associated biomarkers in NSCLC, including Galectin-4, Galectin-7, MUC21, ST6GALNAC1, and ST6GALNAC2. Galectin-7 is a promising clinical biomarker for detection in plasma.

Keywords: galectins; glycosylation; mucins; non-small cell lung cancer; α2,6-GalNAc-sialylation.


Conflict of interest statement

The authors declare that the research was conducted in the absence of any commercial or financial relationships that could be construed as a potential conflict of interest. The author(s) declared that they were an editorial board member of Frontiers, at the time of submission. This had no impact on the peer review process and the final decision.

Figures

Figure 1
Figure 1
Flow chart of this study.
Figure 2
Figure 2
Signature of all differentially expressed genes (DEGs) associated with glycosylation in lung cancer from the RNA-Seq TCGA data. (A) DEGs associated with mucins or mucin-like proteins, initiation of GalNAc-type O-glycosylation, elongation, fucosylation, and sialylation were identified in adenocarcinoma (LUAD) and squamous cell carcinoma (LUSC) compared to adjacent normal samples. (B) DEGs associated with glycosphingolipid biosynthesis were identified in LUAD and LUSC compared to adjacent normal samples. (C) DEGs of galectins were identified in LUAD and LUSC compared to adjacent normal samples. Genes with an absolute value of log2 fold change > 0.8 were screened out. Highly expressed genes were plotted in red and low expressed genes were in blue based on log2 fold change value. False Discovery Rate (FDR) < 10–5 was considered statistically significant.
Figure 3
Figure 3
Essential glyco-relevant genes integrated from the TCGA dataset and investigated by IHC staining. (A) Differentially expressed genes (DEGs) associated with glycosylation between adenocarcinoma (LUAD) and squamous cell carcinoma (LUSC) were compared in the volcano plot (n=288 variables). (B) UMAP visualization of features from the TCGA dataset derived from adjacent normal, LUAD, and LUSC. (C) Feature plots of LGALS4, LGALS7, MUC21, ST6GALNAC1, and ST6GALNAC2. Upregulated expression is shown in muted red, and downregulated expression is in muted blue. (D) Immunohistochemical (IHC) staining of Galectin-4 (LGALS4), Galectin-7 (LGALS7), MUC21, ST6GALNAC1, and ST6GALNAC2 in FFPE tissue showed the expression difference between Stage 3 LUAD and LUSC patients (n=5 of each). Gene expression was scaled by z-score transformation. Genes with an absolute value of log2 fold change > 0.8 were screened out. False Discovery Rate (FDR) < 10–5 was considered statistically significant. The scale bar=100μm and arrows indicate individual cells with positive staining.
Figure 4
Figure 4
Identification of DEGs in TCGA dataset and essential gene signatures in scRNA-seq. (A, B) Related to Figure 3A . Volcano plot of glyco-associated DEGs of LUAD (A) and LUSC (B) compared to adjacent normal (n=292). The X-axis is log2 fold change, the dashed line was set to “|log2 fold change|=0.8”, the absolute value showed the multiple of the difference of genes, genes from the top left part were downregulated in the tumor, while upregulated genes were shown in the top right corner. The Y-axis is the negative base-10 logarithm of the False Discovery Rate (FDR), which increases with the increase of the significance of the difference, the horizontal dashed line was set to “-Log10(FDR)=5”. Significant genes calculated by log2 fold change and FDR were shown in red dots with gene names. (C) Related to Figures 6A–C . UMAP visualization of log-transformed and library-size corrected expression of ST6GALNAC1 and ST6GALNAC2 in the scRNA-seq dataset. (D) Related to Figure 3D. Immunohistochemical (IHC) staining of Galectin-4 (LGALS4), Galectin-7 (LGALS7), MUC21, ST6GALNAC1, and ST6GALNAC2 demonstrated their expression in non-malignant tissues adjacent to corresponding LUAD and LUSC samples. Gene expression was scaled by z-score transformation. The scale bar=100μm.
Figure 5
Figure 5
Landscape of different glyco-associated genes integrated from the TCGA dataset. (A) Related to Figure 3C . Feature plots show the expression of CMAS, SLC35A1, MUC16, FUT4, ST3GAL4, ST6GALNAC4, ST6GALNAC6, and LGALS7B in the TCGA dataset. Upregulated expression is shown in muted red, and downregulated expression is in muted blue. (B) Immunohistochemical (IHC) staining of ST6GALNAC6 in FFPE tissue showed the expression difference between Stage 3 LUAD and LUSC patients (n=5 of each). The second row showed ST6GALNAC6 expression in the corresponding adjacent non-malignant tissues. Gene expression was scaled by z-score transformation.
Figure 6
Figure 6
Expression of essential glyco-relevant genes in scRNA-seq dataset and quantification of Galectin-7 in plasma of lung cancer patients. (A-B) UMAP visualization of all features annotated by histological subtype (LUAD or LUSC, A) and 12 major cell types (B). (C) UMAP visualization of log-transformed and library-size corrected expression of LUAD-related genes (LGALS4, MUC21) and LUSC-related genes (LGALS7, LGALS7B). (D) In the volcano plot, DEGs associated with glycosylation between LUAD and LUSC were compared in pseudobulk mixtures generated from the malignant cell compartments. (E) Plasma concentration of Galectin-7 in adenocarcinoma (n = 20) and squamous cell carcinoma (n = 16) of the lung. Genes with an absolute value of log2 fold change > 0.8 were screened out. False Discovery Rate (FDR) < 10-2 was considered statistically significant. ****, P<0.0001.
Figure 7
Figure 7
Glyco-related prognostic gene exploration using TCGA dataset. (A, B) Forest map showed glycol-associated DEGs of LUAD (A) and LUSC (B) in the univariate Cox regression model for overall survival time. (C, D) The survival analysis of key glyco-associated genes (LGALS4, LGALS7, MUC21, ST6GALNAC1, and ST6GALNAC2) was shown in Kaplan-Meier plots of LUAD and LUSC. The top 25% with high expression and the bottom 25% with low expression for each gene are separated into different subgroups. The p-value of survival analysis is based on the log-rank test.
Figure 8
Figure 8
Survival curves of essential genes related to prognosis among all glyco-relevant genes. (A) Kaplan-Meier (KM) plot shows the overall survival difference of CMAS, SLC35A1, ST3GAL4, MUC16, and FUT4 across LUAD patients. (B) KM plot shows the overall survival difference of SLC35A1, ST6GALNAC4, and ST6GALNAC6 across LUSC patients. The top 25% with high expression and the bottom 25% with low expression for each gene are separated into different subgroups. The p-value of survival analysis is based on the log-rank test.

Similar articles

References

    1. Bray F, Ferlay J, Soerjomataram I, Siegel RL, Torre LA, Jemal A. Global cancer statistics 2018: globocan estimates of incidence and mortality worldwide for 36 cancers in 185 countries. CA: Cancer J Clin. (2018) 68:394–424. doi: 10.3322/caac.21492, PMID: , PMID: - DOI - PubMed
    1. Silsirivanit A. Glycosylation markers in cancer. Adv Clin Chem. (2019) 89:189–213. doi: 10.1016/bs.acc.2018.12.005, PMID: , PMID: - DOI - PubMed
    1. Fu C, Zhao H, Wang Y, Cai H, Xiao Y, Zeng Y, et al. Tumor-associated antigens: tn antigen, stn antigen, and T antigen. Hla. (2016) 88:275–86. doi: 10.1111/tan.12900, PMID: , PMID: - DOI - PubMed
    1. Wi DH, Cha JH, Jung YS. Mucin in cancer: A stealth cloak for cancer cells. BMB Rep. (2021) 54:344–55. doi: 10.5483/BMBRep.2021.54.7.064, PMID: , PMID: - DOI - PMC - PubMed
    1. Hugonnet M, Singh P, Haas Q, von Gunten S. The distinct roles of sialyltransferases in cancer biology and onco-immunology. Front Immunol. (2021) 12:799861. doi: 10.3389/fimmu.2021.799861, PMID: , PMID: - DOI - PMC - PubMed

LinkOut - more resources